
Abstract
Background:
Marfan syndrome (MFS) is a genetic disorder of the connective tissue. It most prominently influences the skeletal, cardiovascular, and ocular systems, but all fibrous connective tissue throughout the body can be affected as well.
Objective:
This study aims to investigate a realistic three-dimensional model of an aorta of a specific patient suffering from MFS by considering elastic and hyperelastic materials for the tissue using fluid-structure interaction (FSI).
Methods:
Isotropic linear elastic and Mooney-Rivlin hyperelastic assumptions are implemented. Linear and nonlinear mechanical properties of the aneurysmal MFS aortic tissue are derived from an uniaxial experimental test.
Results:
Vortex generation in the vicinity of the aneurysm region in both elastic and hyperelastic models and the maximum blood velocity at peak flow time is calculated as 0.517 and 0.533 m/s for the two materials, respectively. The blood pressure is not significantly different between the two models (±8 Pa) and the blood pressure difference between the points in the horizontal plane of the aneurysm region is obtained as ±10 Pa for both models. The maximum von Mises stress for the hyperelastic model (2.19 MPa) is 27% more than the elastic one (1.72 MPa) and takes place at the inner curvature and upper part of the aorta and somehow far from the aneurysm region. The wall shear stress (WSS) is also considered for the elastic and hyperelastic assumptions, which is 36.7 Pa for both elastic and hyperelastic models.
Conclusion:
The aneurysm region in the MFS affects the blood flow and causes the vortex to be generated which consequently affects the blood flow in the downstream by adding some perturbations to the blood flow. The WSS is obtained to be lower in the aneurysm region compared to other regions which indicated vascular remodeling.
Introduction
The aorta is the largest artery of the human body which plays a crucial role in distributing blood in the human body. Any dysfunction or malfunction of this organ jeopardizes humans’ lives and finally results in death. Some complications which originate from heart or aorta diseases or disorders bring about aortic dilatation called aortic aneurysm, or aortic dissection. The dissection of the aorta is the rupture in the layer of tunica intima especially in the fragment in which the tension of hydrostatic pressure is high. Indeed, it mostly takes place among old people. In fact, 70 percent of patients who get an aortic dissection have systemic hypertension. Besides hypertension, cystic medial necrosis is also the main cause of aortic dissection. Without surgical intervention, aortic dissection leads to death [1]. An aortic aneurysm, particularly the ascending thoracic aortic aneurysm (ATAA), is extensively prevalent all over the world. Annular statistical estimations show that the incidence of ATAA among people of the United States includes 0.06 percent of the country’s whole population [2,3]. In recent years, a great amount of effort has been devoted in order to find out the main causes of ATAA. Not only did these studies determine the main grounds of ATAA, but classified these reasons as well. By considering this research, some bad habits such as smoking, inborn disorders such as MS and Loeys–Dietz syndrome, some kinds of infections, pregnancy as well as many others trigger an aortic aneurysm can cause ATAA [1–4]. An aortic aneurysm is divided into two types. The first one is a true aneurysm in which all three layers of the aorta – tunic intima, tunica media, and tunica adventitia - are dilated. The second one is called false aneurysm, or pseudo-aneurysm, however, tunica adventitia is separated from the other one and dilated. Hence, the cavity is made between the two layers, and blood fills it [1]. In addition, aortic aneurysms are divided into two groups due to their shapes. Fusiform aneurysms include all the sides of the aortic wall, whereas in saccular aneurysms only a part of the aortic wall is dilated [1].
MFS is a genetic disorder and occurs by a mutation in patients’ genes. Accordingly, it has a remarkable impact on patient’s connective tissues which have the duty of holding human body’s cells, organs and tissues together. Influences of MFS may reveal itself in musculoskeletal, cardiovascular, and ocular systems. Aortic media layer is weakened by MFS due to the loss of elastic fibers [5]. Therefore, it may increase the possibility of the progressive aortic aneurysm which is ended by the dissection or rupture of the weak wall. According to the literature, most patients suffering from MFS need an operation for repairing or replacing the dilated section in third decades of their lives. Otherwise, they pass away from its complications [4,6].
A A great number of investigations have been performed in order to pave the way for rupture risk prediction of the dilated aorta. These investigations can be classified into two groups, namely experimental, and theoretical assessments. By means of experiment, researchers examined aneurysmal tissue by employing methods such as the uniaxial tensile test to get mechanical properties of the tissue [7]. To do this, some of them used animal samples such as mice [8–10], porcine [11–13], bovine [14], rat [15,16], and turkey [9]. Others, however, preferred to use human aorta samples. For instance, Jarrahi et al. evaluated the axial and circumferential mechanical properties of ATAA samples by using uniaxial tensile test machine [7]. All of these samples were collected from MFS. In addition, they compared elastic modulus, maximum stress, and maximum strain with healthy ones. In the end, they concluded that MFS enhances the stiffness of the aorta wall [7]. In the theoretical studies, researchers simulated an aortic aneurysm by means of numerical modeling to assess the hemodynamic parameters of blood and aortic wall. For the simulation of abdominal aortic aneurysms (AAAs), a considerable number of studies have been performed [17]. For example, AAA was simulated by Vorp et al. in order to investigate the effect of diameter and asymmetric swelling on wall stress [18]. They found out that the shape of an aneurysm, as well as its diameter, have a profound impression on the stress distribution in the dilated segment. In addition, a nonlinear growing occurs in the maximum stress by enhancing maximum radius or enhancing asymmetry [18]. The other simulations with the goal of wall stress comparison between rupture and non-rupture AAA were performed [19]. To do so, they built three-dimensional geometries of AAA by using computed tomography (CT) scan of patients with and without rupture in their AAAs. By employing finite element analysis, their investigation showed that the maximum wall stresses in the group with the rupture in their AAAs are significantly higher than that of non-rupture ones [19].
By increasing the hemodynamic load, the risk of dissection simultaneously grows. Sometimes wall stress increases in such an extent that the wall stress reaches the wall strength. Afterwards, aortic wall dissection takes place [19]. The ascending thoracic aorta is the gate of high-pressure blood entrance. Hence, ascending thoracic aorta wall is highly prone to dilation and rupture especially in an aneurysm. In this area, a great struggle has been dedicated by Pasta et al. in order to simulate ATAA [20]. They compared two ATAAs which were caused by the bicuspid aortic valve (BAV) and tricuspid aortic valve (TAV). Different hemodynamic patterns were observed in BAV and TAV. Through stress distribution they found that aortic dissection may occur above sinotubular junction [20]. In another study, a little segment of ATAA was simulated by its images. The different material properties which were obtained from patients’ samples were allocated from different sides of ATAA. As a result, the left side was stiffer than the right, anterior, and posterior sides. Furthermore, the pick stress was observed in both left and right regions. By considering the short length of simulated ATAA sample, it probably casts doubt on the study’s results, as blood flow was not developed properly, and perhaps the stress distribution was not as satisfactory as possible [21]. Krishnan et al. used different approaches to determine stress distribution and material properties [22]. The finite element (FE) model was generated by CT scan images from ATAA in zero pressure. Then, the presumed material property was assigned to ATAA wall in ABAQUS software. After imposing blood pressure, the obtained deformation was compared with MRI measured strain [22]. In another effort, wall stress and rupture possibility were analyzed in ATAA which was caused by the bovine aortic arch (BAA) and BAV by using FE model. In conclusion, no correlation was found between BAA, BAV and ATAA [23].
In fact, in two decades, noticeable progression in technology has broadened our horizon about human aorta and aortic aneurysms. Despite the fact that a great number of studies on AAAs has been performed in recent years [17], there are only a publications about simulation of ATAAs. In particular, there is no simulation of ATAA with the ground of MFS.
The aim of this study was to simulate a realistic three-dimensional model of an aorta suffering from MFS in both assumptions of elastic and hyperelastic materials for the tissue using fluid-structure interaction (FSI). The hyperelastic Mooney-Rivlin constants are derived using uniaxial tensile tests.

The uniaxial machine test (a), digital caliper (b) and the MFS tissue under tensile load from different views (c, d).
Model and geometry
The aorta lumen is obtained by Computed Tomography Angiography (CTA) scan images from a patient with ATAA as a result of MFS at Tehran Heart Center (THC). Each slice has the length and width of 260 mm with a thickness of 0.6 mm.
All materials removal and patients’ CTA data are used with the permission of the donator under the ethical rules of the Tehran University of Medical Sciences (TUMS) based on the 2008 Declaration of Helsinki.
The realistic geometry of the aorta with MFS is constructed using MIMICS and then the model is imported into the Comsol Multiphysics for FE modeling. Aorta thickness is measured precisely using a digital caliper with a resolution of 0.01 ± 0.005 mm (Insize, Vienna, Austria).
Materials and boundary conditions
The model is solved with two assumptions of linear elastic and hyperelastic materials for the aortic tissue and Newtonian-viscous fluid for the blood. The Mooney-Rivlin method with five constants is implemented to solve the problem in the case of hyperelastic assumption. The constants for the hyperelastic equation are derived using experimental test. Experimental tests are done by a uniaxial tensile test machine (Shimadzu, AG-Xplus SC, Precision Universal Tester, Kyoto, Japan) [7]. A rough sand paper is used between the grips of the machine to avoid tissue slippage during the test. The samples in a strip form mounted on the testing machine, and their length (30 + 3 mm) and width (10 + 1 mm) are measured accordingly [7]. Figure 1 shows the uniaxial machine test, digital caliper and the MFS tissue under tensile load [7].
The following strain energy density function (W) is used for the Mooney-Rivlin method:
Mechanical properties of the aorta (elastic and hyperelastic parameters) and blood
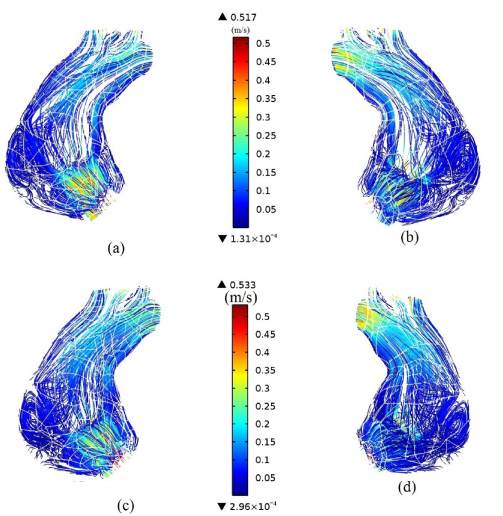
Streamlines in the front and rear of the model for elastic (a, b) and hyperelastic assumption (c, d) during peak flow.
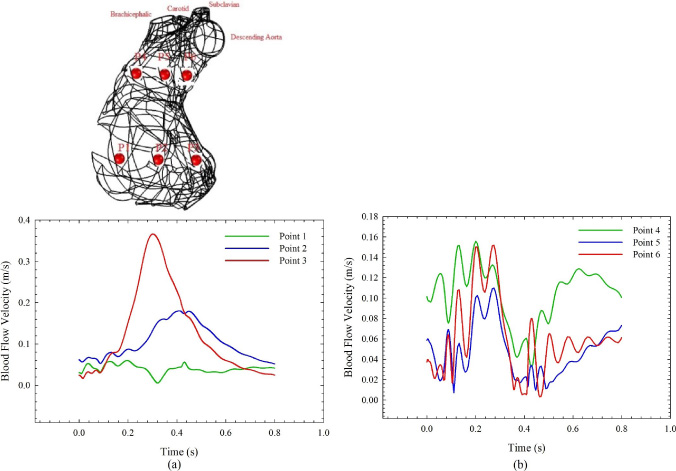
Blood flow velocity at points 1–6 for the hyperelastic material; (a) 1–3 points and (b) 4–6 points.
The blood flow and pressure are applied to the inlet and outlets of the model, respectively, according to the data collected from THC.
Figure 2 shows the streamlines in the aorta. It is observed that a vortex has been generated in the aneurysm region. As can be seen in the figure, the velocity in the aneurysm region (bulge shape) is decreased. This region is under risk of rupture and dissection over time as the vortex generates in this region. By comparing the elastic and hyperelastic materials, we can observe that the maximum velocity at the peak flow time is 0.517 and 0.533 m/s, respectively. The blood velocity at the entrance of the ascending aorta has a larger value and as it goes toward the aneurysm region, the velocity decreases and the vortex generates. As we move from the aneurysm region toward the outlets, the velocity gradually increases.
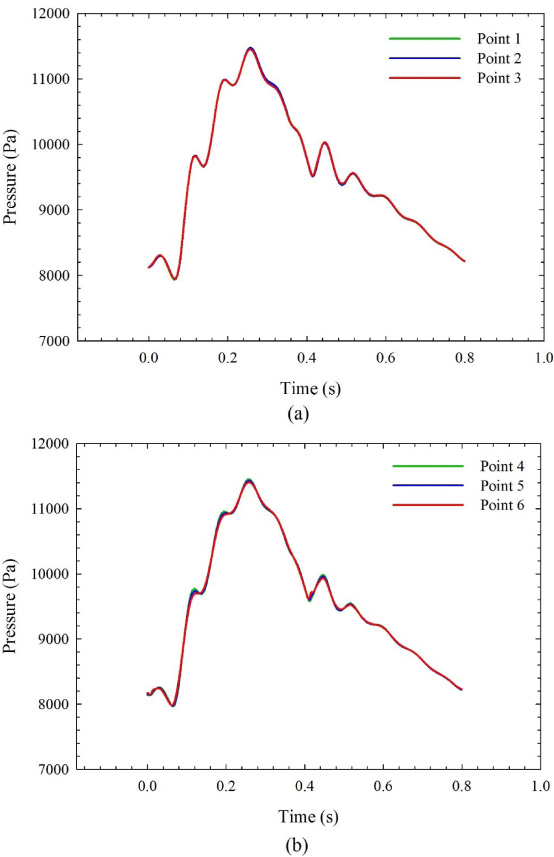
Blood pressure at points 1–6 for the hyperelastic material; (a) 1–3 points and (b) 4–6 points

Blood flow at the brachiocephalic, carotid, subclavian and descending aorta arteries in a heart cycle.
Since the blood velocity, blood pressure and outflows associated with hyperelastic model do not have a considerable difference with that of the elastic one, the results of the hyperelastic model are presented in Fig. 3. Figure 3 shows the blood flow velocity at different points inside the aorta in a complete heart cycle. Figure 3(a) details the points in a plane close to the aneurysm region and Fig. 3(b) details the points in a plane away from the vicinity of the aneurysm. As can be seen from Fig. 3(a), the blood flow velocity increases as we move from the aneurysm region toward the internal curvature of the aorta in the same horizontal plane. In other words, the blood velocity has the minimum value close to the aneurysm region. The maximum blood velocity occurs at peak flow time and this peak velocity gets a delay in time as we move toward the aneurysm region. Another important issue which should be noted in Fig. 3(a) is the more wavy curve in velocity in the vicinity of aneurysm region compared to the other regions (Points 1 and 2). This may be due to the generation of the vortex in the aneurysm region. In a plane far from and above the aneurysm region, the blood flow velocity does not have a considerable difference in different points, but still they are wavy (Fig. 3b). This wavy curve may be due to the effect of vortex generation and perturbations caused by the aneurysm which consequently affects the downstream flow.

von Mises stress during peak pressure in four views of the front, rear, left and right for elastic (a–d) and hyper elastic materials (e–h); units are in Pa.
The blood pressure at six aforementioned points within a heart cycle is shown in Fig. 4. As can be seen in the figure, there is no significant difference between blood pressure at these points (Difference = ±10 Pa). Furthermore, the pressure in the plane of aneurysm region is approximately similar to the plane far from this region. This means that this aneurysm does not have a significant effect on the blood pressure in the aorta. If we compare the blood pressure in this study with the pressure in the normal heart [24], we can suggest that the blood pressure in the aortic aneurysm has some perturbation while it is more smooth in the normal heart. This is probably because of the influence of aneurysm region on the blood pressure.

von Mises stress during peak pressure in different mechanical properties of the aorta and different boundary conditions.
Figure 5 shows the amounts of blood flows exited from brachiocephalic, carotid, subclavian and descending aorta arteries in a heart cycle. According to the figure, we have some perturbations unlike the ones in the normal heart [25]. This can be due to the MFS in the ascending aorta which generates the vortex in the blood. As the radius of the artery increases, the perturbation in the curve increases. These ups and downs (perturbations) in the outflows may have some disadvantages on the blood circulatory system.
As can be seen from Fig. 6(a–d) for elastic and Fig. 6(e–h) for hyperelastic material, the region in the vicinity of the aneurysm has higher values in von Mises stress. It is worth mentioning that among the above four views, the von Mises stress gets the maximum value associated with the inner curvature of ascending aorta and the upper part of aneurysm region. By comparing the von Mises stress in elastic and hyperelastic models, we can understand that the maximum stress is 1.72 and 2.19 MPa for the elastic and hyperelastic model, respectively. The maximum stress in the hyperelastic model is 27% higher than the elastic one. It is worth mentioning that as we move from the aneurysm region to the outlets’ region, the von Mises stress is decreased. The WSS is also considered for the elastic and hyperelastic assumption. The maximum WSS is 36.7 Pa for both elastic and hyperelastic models. The WSS in the vicinity of the aneurysm is less than other smooth regions of the aorta which may contribute to the artery remodeling.
As a matter of simplification, some studies simulate the aorta tissue as an elastic material. Nonetheless, experimental studies, such as uniaxial and biaxial tensile test, show the nonlinearity characteristics in the aorta tissue. According to contours of von Mises stress in this paper, although the pattern of the stress distribution is almost the same in both the elastic and hyperelastic cases, their intensities reveal a considerable difference between both regarded cases. In fact, Figure 6 shows that the amount of the maximum von Mises stress increases with 27% in the hyperelastic case compared to the elastic model. As a result, by considering a study conducted on the investigation of the wall stresses in patients with aortic aneurysm [26], the hyperelastic material assumption model is more realistic and the results presented here are in the agreement with [26] in view of the comparison between elastic and hyperelastic assumptions.
To see the effects of the mechanical properties of the aorta on the von Mises stress, the structural analysis of the aortic aneurysm model is done for the different values of Young’s modulus in different boundary conditions. These results are shown in Fig. 7. As can be seen, if the Young’s modulus of the aorta is increased, the maximum von Mises stress is decreased. In other words, with the stiffer aorta, the stress is decreased in the aortic aneurysm model. Furthermore, in case of increasing the pressure (i.e. hypertension case), the stress is increased compared to the normal boundary condition. Hence, it can be concluded that in the patients suffering from MFS, the risk of rupture is higher in those who have hypertension pressure and lower modulus of elasticity.
In this research, hemodynamic and structural analysis of a three-dimensional model of realistic aorta suffering from MFS is performed using FSI. The mechanical properties of the MFS tissue are obtained using experimental test and used for the elastic and hyperelastic modeling. The aneurysm region in the MFS affects the blood flow and causes a vortex to be generated which consequently affects the blood flow in the downstream by adding some perturbations to the blood flow. The WSS is obtained to be lower in aneurysm region compared to other regions which indicates vascular remodeling. The blood pressure and blood flow at the outlets do not have a significant difference in elastic and hyperelastic models. Furthermore, in the patients suffering from MFS, the risk of rupture is higher in those who have hypertension pressure and lower modulus of elasticity.
Footnotes
Acknowledgements
The authors acknowledge the Iran University of Science and Technology for funding this project. They also appreciate the cooperation of Prof. Hossein Ahmadi Tafti and their colleagues at Tehran Heart Center (THC) for their intellectual guidance during this project.
Conflict of interest
None to report.