
Abstract
Brain tumors are considered to be a leading cause of cancer death among young people. Early diagnosis is thus essential for treatment. The brain segmentation process is still challenging due to complexity and variation of the tumor structure, intensity similarity between tumor tissues and normal brain tissues. In this paper, a fully automated and reliable brain tumor segmentation system is proposed. This system is able to detect range of slices from a volume that is likely to contain tumor in MRI images. An iterated k-means algorithm is used for the segmentation process in conjunction with a cluster validity index to select the optimal number of clusters. The proposed approach is evaluated using simulated and real MRI of human brain from multimodal brain tumor image segmentation benchmark (BRATS) organized by MICCAI 2012 challenge. Our results achieved average for Dice overlap and Jaccard index for complete tumor region of 91.96% and 98.31% respectively when testing a set of 77 volumes. This shows the robustness of the new technique for clinical routine use.
Introduction
Brain tumors are one of the major causes for the increase in mortality among children and adults. A tumor is a mass of tissue that grows out of control of the normal forces that regulates growth [1]. In 2012, the Central Brain Tumor Registry of the United States (CBTRUS) have reported that brain tumors are the second cause for cancer–related deaths in children under age 20 and in males from age 20 up to 39 years old and is also considered as the fifth leading cause of cancer-related deaths in women aged 20 to 39 [2].
Early detection of brain tumor is very important and it is a motivation for further studies. In the brain magnetic resonance imaging (MRI), the tumor may appear clearly but for further treatment, quantification of tumor area is required. There are large variety of MRI imaging modalities that can be used for mapping tumor-induced tissue changes, such as T2-weighted image (T2WI) and FLAIR MRI, T1-weighted image (T1WI) and post-Gadolinium T1 MRI, which clearly demonstrate the borders. Therefore, each of these modalities provide different types of biological information useful in the segmentation of brain tumor regions for further analysis [3,4]. As the brain tumor exhibits inhomogeneous intensities and weak boundaries, segmentation is still a challenging process [5].
Automated tumor segmentation methods proposed in the literature can be classified into conventional, classification, clustering and deformable model methods [2]. In conventional methods, conventional image processing methods are used (such as edge detection and region growing) based on gray intensities of images [6], which have limited efficiency in segmenting brain tumor. As a result, these methods were used either as a preprocessing step in the segmentation of brain tumor or refinement step [2]. Recently, these techniques have been combined with artificial neural networks (ANNs) [7], genetic algorithm (GA) [8], fuzzy logic [9], and Markov model to improve the performance.
Classification approaches are based on supervised techniques such as ANN and support vector machine (SVM), and unsupervised clustering techniques such as k-means, self-organization map (SOM), and fuzzy c-means [10–12].
In [9], a fuzzy system for brain tumor segmentation based on contrast enhanced 2 D T1-weighted MRI images was developed. The accuracy of this system varied between 0.73 and 0.93. In [13], SVM classifier is integrated with features selected in the kernel space to select the most useful features that give better segmentation with low time consumption.
Other work used to classify pixels of the brain based on features extracted from training data. This work is based on using supervised classification method, namely random decision forest to classify the pixels based on meaningful features. The approach aimed to automatically segment the tumor as well as segment different tumor constituents with better results for high grade tumors than for low grade [14].
Since texture based brain characterization has been proven to be an effective way for brain analysis, a texture-based automated algorithm which was experimented on multi sequences MRI images separately was proposed in [15]. Results for segmentation were 95.9 ± 0.4 for simulated database, and 93.2 ± 0.3 for real database. The main drawback for this algorithm is the computational complexity.
Clustering approaches are widely used in tumor segmentation. In [16], a technique based on fuzzy c-means clustering with cluster validity measure is proposed. The validity measure based upon fuzzy entropy was used. Another technique [17] is based on fuzzy variable string length genetic (fuzzy-VGA), in which the point symmetry distance is used instead of Euclidean distance for membership. In order to get the benefit of simple and low computational complexity of k-means and the quite accurately results and stability of fuzzy c-means, the k-means clustering technique is integrated with fuzzy c-means algorithm [18]. The authors in [19] presented a segmentation algorithm for extracting the brain tumor using anisotropic diffusion filter (ADF) to smooth the MR image, then the enhanced image is fed to k-means clustering algorithm.
A colored-based segmentation method is proposed [20] that uses the k-means clustering technique to extract the tumor region. The aim of color translation from gray level MR image into color space image is to obtain more useful feature to achieve good segmentation.
In this paper, a system that is able to detect the tumorous range of slices in a volume that likely contains tumorous regions is proposed. This in turns speeds up the process of segmentation as it does not segment all slices of the volume. The automated k-means is used for segmentation and it is based on color segmentation. Details of the proposed system, results and discussion are described in the next sections.
Methodology
The proposed system is divided into two phases, as shown in Fig. 1. The first phase is the range detection, to define the MR slices range that contains the tumor. Initially each patient volume is processed to determine in which brain hemisphere the tumor is located.

Block diagram of the proposed system.
The second phase is the automatic segmentation for the slices in the obtained range, which are tumorous. Segmentation is a multi-step process, in which the tumorous images are applied to anisotropic diffusion filter [16] to smooth intra-region while maintaining objects boundaries intact. Then required features are selected for clustering process by converting the gray-level brain image into CIElab color model (L∗a∗b) [20]. Finally, brain tumor is segmented using k-means clustering method with cluster validity measure (index).
This phase is based on two steps. The first step is done to divide the brain into two hemispheres [21], then the histogram of both of these is calculated using mutual information [22]. The second step is the sliding window, which is used to find out a range of slices where the tumor is clearly shown.
The brain image is divided into two hemispheres and then the one with higher intensity values is chosen. This is summarized as follows and applied on case HG0001 for illustration: Separate the brain region from the background and find the brain’s center using center-mass algorithm and its borderline. Divide the brain region into two hemispheres using bounding box as shown in Fig. 2. For all slices in the volume, obtain the mean value of the intensity level of each hemisphere as in Eq. (1). These values are plotted in Fig. 3. Calculate the area under curve. A higher area under curve value indicates the presence of a tumor.
The result of this step is the location of the tumor (either in the upper or lower hemisphere) based on the area under the curve. For the case shown in Fig. 2, the tumor is located in the upper hemisphere. This is confirmed with the plot in Fig. 3.

(a) MRI brain image, (b) the brain borderline, (c) and (d) the two brains’ hemispheres (case HG0001).

The mean value of intensities of upper and lower hemispheres in all slices.
The second step is to detect a range of tumorous slices from the whole volume for each patient (each volume contains 160 slices). This range should include the highest intensity values. For the case in Fig. 3, the maximum intensity located between slices is 40 and 50. This range is not correct as these peak values give fake results. To avoid these incorrect (peaks) values, an averaging step is performed over the curve using a sliding window of size (2h +1). The average μ and standard deviation S are calculated from Eqs ((2)) and ((3)) for slices within a window of size 17 over the curve. The value of h is determined experimentally and set to 8.
Figure 4 illustrates that the range of tumorous slices in each volume can be determined in the most continuous and smoothest part of the average metric curve as shown in Fig. 4-a. Also the lowest and continuous parts in the standard deviation metric show the exact range of tumorous slices as shown in Fig. 4-b. This indicates that the correct range is between 83 and 103 and this is confirmed by manual visualization for all slices in that volume.
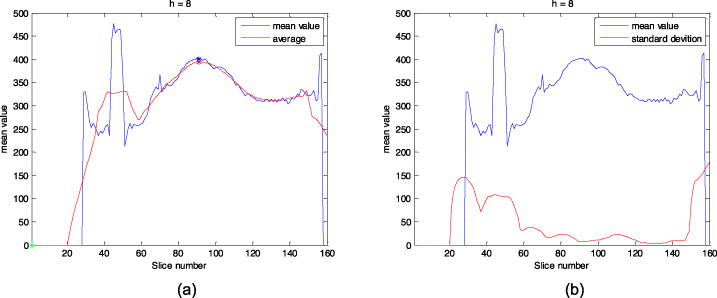
Mean value of the hemisphere intensities (blue): (a) average, and (b) standard deviation using a sliding window with h = 8 (red).
To obtain the range, the entropy is calculated from Eq. 4.
If the standard deviation > 6.2 Then calculate entropy as second metric
For example, in case Real LG0004: the detected range by average sliding window was (36–93) which is 57 slices. Then we calculate the entropy for this range and selected 21 slices with maximum entropy values [0.90 to 0.948]. This comprises the ranges of slices between 72 and 92.
The structure of the brain is very complex so that segmentation of brain tumor partition is still a challenging process. Accurate segmentation requires ground truth images, while assessing the segmentation results without ground truth requires a validity measure which can be used to obtain high accuracy segmentation results [5,16].
Anisotropic diffusion filter
Anisotropic diffusion filter [24] is used as an enhancement process for the tumorous images in order to smooth images while preserve edges. The anisotropic filter is applied according to the following equation:
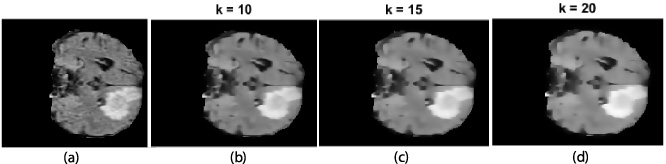
(a) Tumorous image, and (b, c, d) enhanced image with different K diffusion constants.
In the proposed system, a color transformation function is applied to enhance tumorous images. First, the gray level image is converted into RGB image in order to utilize useful features and enhance the visual density [20]. Then, the RGB color space is further converted to a CIELab color model (L∗a∗b∗) [23]. This consists of a luminosity layer L∗, a chromaticity-layer a∗, which indicates where color falls along the red-green axis, and a chromaticity-layer b∗, which indicates where the color falls along the blue-yellow axis. Both a∗ and b∗ layers contain all required color information which are useful for clustering process. The next step is to use the k-means clustering algorithm for brain tumor segmentation.
K-means clustering
To find the accurate number of clusters to get the best partition, k-means algorithm is iterated for a range of predefined numbers of clusters k = 3, 4, 5, 6, 7. The correct number of clusters changes from case to another. To set the process automatically, the optimal number is chosen based on a cluster validity index. Many cluster validity indices such as Calinski-Harabsz (CH), I index (I), Silhouette index (S), and Dunn’s index (D) [25,26] have been introduced in the literature.
In the proposed method, the Calinski-Harabsz (CH) cluster validity index is used. It is based upon the average between- and within cluster sum of squares, and is calculated as follows:
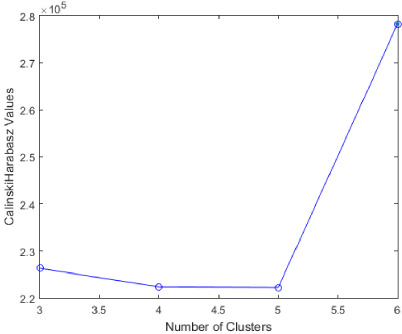
Calinski-Harabsz (CH) values for real data (case HG0002).
K-means algorithm consists of two phases in which it calculates k centroid and then calculates the distance between each point to the cluster and the nearest centroid. Although k-means algorithm is simple and computationally faster than hierarchical clustering, it has a drawback, as it produces different cluster results as the initial centroid is randomly chosen.
In this paper, the color model features applied to the k-means clustering using Euclidian distance gives better results. On the other hand, these results are not stable and many times the tumor is divided between two clusters, as will be illustrated in the result section. Other distance metrics are investigated such as Manhattan and Cosine distance for k-means clustering instead of the Squared Euclidean to utilize more stable and accurate results. Equations for these metrics [27] as follows:
Squared Euclidean distance:
In this paper, two similarity measures are used to assess the segmentation results, namely Dice similarity coefficient [28] and Jaccard index [29]. The former is the overlap between two images and is described as:
The Jaccard index is another similarity coefficient and can be by defined as the size of intersection divided by the size of union of two sets which is described as:
The proposed system is evaluated using a publicly available dataset: MICCAI 2012 Challenge on Multimodal Brain Tumor Segmentation (Brats) [30]. It consists of 29 real-patients containing 20 high-grade volumes and 9 low-grade volumes. Also simulated Brats dataset consists of 25 high-grade volumes and 25 low-grade volumes. Each volume contains 160 slices of FLAIR MRI images. The slice range detection step is tested using all volumes (79 volumes). The tumor segmentation is tested using a set of 77 volumes only as two volumes were excluded (cases: real LG0014 and HG0026).
Slice range detection
The proposed algorithm for slice range detection effectively determined the right tumorous brain’s hemisphere in all subjects (79 volumes) in addition to a successful detection of the tumorous range of 74 volumes out of 79 volumes. Table 1 summarizes these results and shows the required time for execution this step for 79 volumes. In 5 out of 79 volumes, the sliding window technique failed to detect the exact range of slices that likely contain the tumor.
The processing of the proposed algorithm was implemented on a laptop computer with a 2.7 GHz Intel I7 processor with 16 GB RAM. We did not use any GPU assisted processes and thus all the operations are processed through the CPU/FPU. As is generally accepted in the graphics processing community, parallel processing using GPU architectures can speed up the processing time in the range of 10-100x depending on the level of parallelism of the program. However, this is beyond the scope of this paper.
Slice range detection results
Slice range detection results
Figure 7 shows the segmentation results which indicate the success of the proposed segmentation method to extract the brain tumor completely for each slice in different cases. It shows the original image for different cases from the dataset and the output for different steps of the proposed method. As discussed above, the CH index is used in order to find the optimum number of clusters for the k-means clustering algorithm. Different distance metrics are investigated to evaluate the stability of the proposed algorithm.
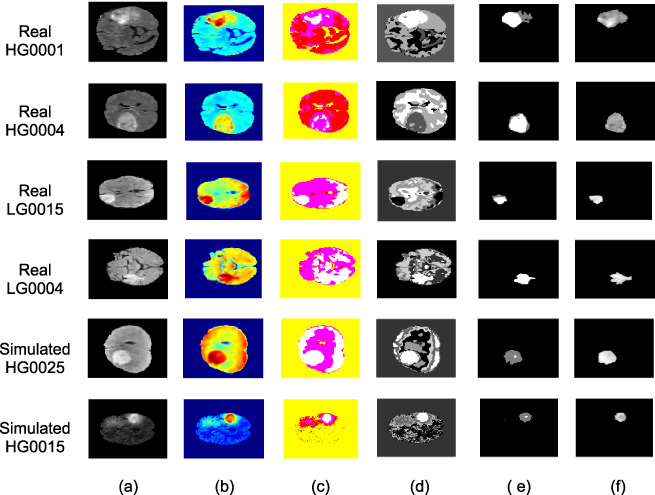
Segmentation results: (a) original MRI, (b) RGB image, (c) Lab image, (d) clustering results, (e) ground truth, and (f) output of the proposed method.
Figure 8 shows the performance of k-means clustering with different distance metrics Squared Euclidean (Fig. 8-a), Manhattan distance (Fig. 8-b) and Cosine distance (Fig. 8-c) on real case HG0001. For each volume, a range of 21 slices is determined automatically.
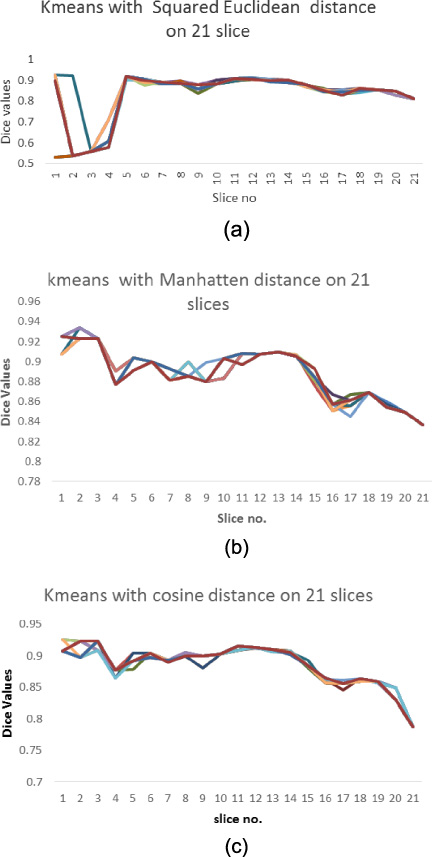
K-means using: (a) Squared Euclidean, (b) Manhattan distance, and (c) Cosine distances on the tumorous brain slices range of real data case: HG0001. Colors of the lines indicate the trial numbers.
For each slice in this range the segmentation step is performed to segment the tumor for 20 iterations to test the stability and accuracy of the proposed method based on Dice values. As shown in Fig. 8-a, using Euclidean distance, the algorithm was unstable. However, using either Manhattan distance (Fig. 8-b) or Cosine distance (Fig. 8-c) gives more stable results. In the proposed system, the Manhattan distance is used.
The proposed approach is evaluated by using the Dice and Jaccard similarity measures. Average values for 77 volumes are summarized in Table 2.
Average results of the proposed method on 77 subjects, each subject has 160 slices
Table 3 shows the Dice mean and standard deviation accuracy results for 27 Brats Flair (single-spectral) real data which consist of 19 high-grade (HG) and 8 Low-grade (LG) volumes. Also 50 simulated data consists of 25 high-grade and 25 low-grade volumes. Table 3 demonstrates that the proposed segmentation method achieves higher accuracy values on simulated data which are 0.929±0.0506 compared with the accuracy values for real data which are 0.9007±0.0541. It also illustrates its efficiently to segment the low-grades subjects for both real and simulated data of Brats more than high-grades subjects.
Results for the Brats dataset using Dice similarity coefficient index
The algorithm is compared with the fuzzy c-means and the standard k-means with different distance metrics including Euclidean and Manhattan distance in conjunction with the Calinski–Harabsz (CH) cluster validity index. Results are compared to the work proposed by Nabizadeh and Kubat [21] which are summarized in Table 4.
In [21], two different feature sets (Gabor-wavelet and statistical features) obtained from flair MR images of real and simulated data where a set of twenty-five real and simulated multi spectral (T1-w and flair) MR images of the brain with high-grade glioma were used. It is clear from Table 4 that k-means with Manhattan distance and Calinski-Harabsz (CH) cluster validity index has better accuracy compared to fuzzy c-means and the standard k-means with Euclidean distance or with Manhattan distance.
Comparison of FCM, k-means, and method in Nabizadeh and Kubat [21]
∗Dice mean and standard deviation are calculated for 44 real and simulated HG patients and 33 real and simulated LG patients.
Comparison of Dice coefficient on Brats dataset for real data high-grade (HG) and low-grade (LG) subject
∗FA denotes fully automatic, and SA denotes semiautomatic.
Table 5 shows a comparison for the results of the proposed system on real data for complete tumor region with results presented by the MICCAI Brats challenge. The comparison is based on high-grade (HG) and low-grade (LG) subjects.
In this paper, an automated system for brain tumor segmentation from MRI images has been proposed. As demonstrated, the system consists of two main phases: slice detection and tumor segmentation. The first phase used the whole volume (160 slices) to determine whether the tumor is located in the upper or lower hemisphere of the brain. Then a range of 21 slices where the tumor strongly appeared were defined. The system achieved an accuracy of 94% for the slice range detection step.
The second phase is the brain tumor segmentation using k-means clustering algorithm which is based on anisotropic diffusion filter and the CIELab color features. A cluster validity index is used to determine the optimum number of clusters which coincides with the true number of clusters. This improves the performance and helps to get a fully automated process with more stable and reliable results. For performance evaluation, a real world dataset has been used. Experimental results show an average value for Dice and Jaccard of 91.96% and 98.31% respectively when testing a set of 77 volumes.
Conflict of interest
The authors declare that there is no conflict of interest regarding the publication of this paper.