
Abstract
A numerical investigation of Newtonian/non-Newtonian unsteady pulsatile entry blood flow inside a 3D curved stenosed artery is presented. For considering the non-Newtonian effect (shear thinning or shear thickening behavior), the blood viscosity is characterized by the power-law model (Ostwald de Waele Equation). At the inlet of the artery, a realistic pulsatile waveform is utilized according to the experimental data reported by other researchers. This study belongs to the analysis of the curvature ratios, percentage and length ratio of stenosis, and blood thickening on hemodynamic characteristics of the flow. The results emphasize that the maximum wall shear stress happens near the stenosis neck and as expected, by decreasing the stenosis length, the maximum value of wall shear stress increases. In addition, the results indicate that the shear thickening fluid shows a more stable velocity profile rather than the shear thinning fluid flow.
Keywords
Introduction
The arteries are the blood vessels that deliver oxygen-rich blood from the heart to the tissues of the body. Vascular diseases, such as atherosclerosis, thrombus, and aneurysm, frequently occur in curved arteries [1,2]. Atherosclerosis is the leading cause of heart attack and death in the developed world. This is a geometrically focal disease that has a propensity to involve the outer edges of blood vessel [3]. Although the initialization, development, and progression of atherosclerosis are associated with system risk factors, such as hypertension, smoking, diabetes mellitus, social stress, and hyperlipidemia, the hemodynamic flow fields and bloodstream play an important role as well [4]. Curvatures, bifurcations, narrowing the cross section of arteries, and formation of plaque on the inner artery wall (stenosis), significantly affect the normal hemodynamics of the bloodstream. In these susceptible zones, clinical evidence has shown that blood flow changes direction with the cardiac cycle, and a weak net hemodynamic wall shear stress (WSS) happens. In contrast, vessel regions that are subjected to steady blood flow and a powerful shear stress, remain comparatively disease-free [3–6]. Hence, it gets to a common view that mechanical and hydrodynamic characteristics of curved arteries with stenosis are considerably vital and essential.
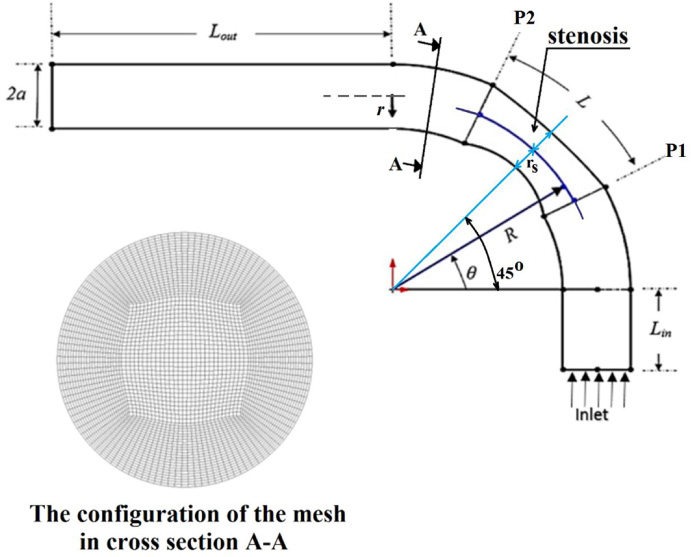
Geometry of curved artery with stenosis and the configuration of meshing.
According to the above-mentioned importance of stenosed curved arteries on the progression of atherosclerosis, many recent vascular studies have focused on the dynamical examination of blood fluids inside such arteries. In 1999, Dash et al. [7] studied the fluid mechanics of steady and laminar blood flow in a catheterized curved artery with stenosis via an analytical method. They modeled blood as an incompressible Newtonian fluid. They investigated the effect of catheterization on the pressure drop, impedance and the wall shear stress for different values of the catheter size and Reynolds number of the flow. In 2000, Yao et al. [8] developed a 3D computational model of blood flow inside curved arteries with elliptic stenosis. In their studies, the blood was considered to be, homogeneous, incompressible and a Newtonian fluid. They investigated the influence of curvature and stenosis on the flow characteristics and wall shear stress. In 2006, Jung et al. [9] performed a multiphase transient non-Newtonian (Carreau-Yasuda viscosity model) three-dimensional simulation for pulsatile hemodynamics in an idealized curved vessel of a human coronary artery. They concluded that the two-phase model predicts greater shear thinning than the single-phase model. In 2007, Liu [10] investigated numerically the influence of stenosis on hemodynamic characteristics of the pulsatile blood flow (such as secondary flow, flow separation, wall shear stress, and pressure drop) in curved arteries with stenosis at the inner wall was. Their results demonstrated that when the intensity of a stenosis at the inner wall of a curved artery reaches a certain value, the flow pattern in the downstream of the artery shows a dramatic change.
In 2011, Wang and Li [11] presented a numerical approach to find the effect of arterial curvature on arterial wall shear stress for pulsatile blood flows. The blood fluid was assumed to be an incompressible isotropic Newtonian fluid. They showed that wall shear stress is high in curvature regions, indicating that the curved part is a high-risk region in the artery. In 2011, Keshavarz-Motamed and Kadem [12] carried out numerical investigations about the pulsatile blood flow in a simplified model of the curved aorta with coexisting coarctation of the aorta and aortic stenosis. In their study, blood was assumed to be incompressible and Newtonian. They reported that the coexistence of both coarctation and stenosis has a significant impact on the flow in a curved pipe in terms of secondary flow patterns, wall shear stress and pressure loss. In 2012, Alastruey et al. [13] investigated the influence of vascular curvature on flow patterns and wall shear stress in the idealized blood vessels. They found that at Reynolds numbers between 50 and 500, secondary movements in the directions of the local normal and bi-normal behave as two underdamped oscillators. In 2013, Melih Guleren [14] investigated numerically the pulsatile blood flow characteristics through an artery with concentric and eccentric plaque stenosis using Large Eddy Simulation (LES) turbulence technique. They found that the pulsatile behavior in conjunction with non-Newtonian blood model has a considerable effect on wall shear stress and pressure drop.
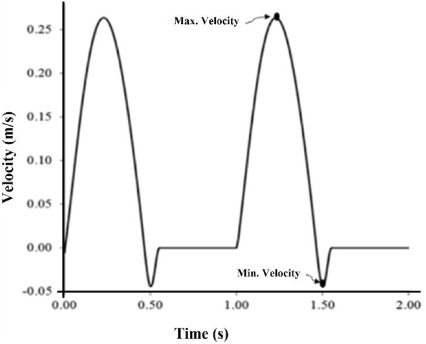
A realistic pulsatile inlet velocity waveform.
In 2014, Liu et al. [15] carried out the fluid-structure interaction analysis for pulsatile Newtonian blood flow through elastic arteries with eccentric stenotic plaques based on the finite element method. Their results showed that the values of WSS, pressure drop, and von Mises stress at the stenosis are in positive correlation with the narrowing of the lumen. In 2014, Habibian et al. [16] performed a numerical simulation of steady-state and Newtonian blood flows in S-shaped stenosed bends (a model of the femoral artery) with a sweep angle of 45 degrees at different Reynolds numbers. They stated that the wall shear stress depends on both the location of stenosis on curvature and Reynolds number. In 2016, Li et al. [4] presented numerical investigations on wall shear stress profiles in three-dimensional pulsatile flow through curved stenotic coronary arteries. They assumed that the blood is Newtonian and incompressible. They found that only in severe stenosis cases, a time-dependent fluctuating WSS region downstream of the stenosis is identified. In 2016, Govindaraju et al. [17] examined the influence of artery curvature on the anatomical assessment of stenosis severity using a 3D computational model. In their study, blood was assumed to be non-Newtonian and followed the Carreau model. In 2016, Gharahi et al. [18] developed a specific CFD simulation using MRI to improve estimating hemodynamics of the curved carotid artery. They considered four various viscosity models (Newtonian, Power law, Casson, Carreau-Yasuda) for modeling the blood fluid. In that year, Vahidkhah et al. [19] presented a computational study on the blood flow of deformable red blood cells in microvessels with stenosis. In 2016, Jabir and Lal [20] reported the numerical simulation of steady and pulsatile blood flow through a vessel with an eccentrical stenosis having an elliptical cross-section. To estimate the influence of non-Newtonian nature of blood, they considered the Carreau viscosity model. They found that WSS distribution on post-stenotic region possesses a high degree of randomness arising from turbulent effects. In 2017, He et al. [1] performed a numerical simulation of pulse wave propagation in a curved artery. They emphasized that modeling of pulse wave propagation can be better made to perform hemodynamic distributions and predict vascular disorders in a curved artery. In 2017, Hong et al. [21] measured the velocity fields of pulsatile flows with different Reynolds numbers in 3D curved stenosed vessel models using time-resolved particle image velocimetry and numerical simulation. Their obtained results indicated that the curvature of the tube considerably influences the skewness of the flow, and the shear stress is magnified near the outer curvature wall due to centrifugal force.
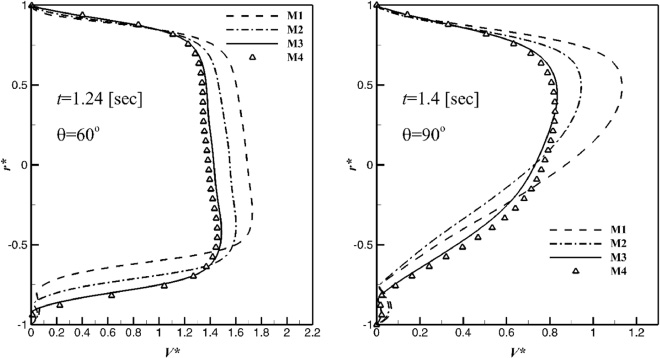
Dimensionless axial velocity profile (V ∗) versus dimensionless radius (r ∗) at sections of 𝜃 = 60° and 𝜃 = 90° in the symmetry plane of the artery with the stenosis length ratio of 𝛿 = 0.3, curvature ratio of 𝜀 = a∕R = 0.17, and stenosis of P S = 25 percent.
As emphasized in the above mentioned published literature, narrowing the area in the curved arteries has a significant effect on the hemodynamics of the bloodstream which can dramatically affect vascular diseases progression. In such regions (stenosis), the flow is extremely complex, and a proper understanding of current physics is not possible except by the dynamical examination of blood fluid flows. Hence, in the present study, the pulsatile blood flow through stenosed curved arteries is numerically simulated. Blood is modeled as both Newtonian and non-Newtonian fluids. For considering the non-Newtonian effect (shear thinning or shear thickening behavior), the blood viscosity is characterized by the power-law model (Ostwald de Waele Equation). At the artery entry, a realistic pulsatile waveform is applied according to the experimental data reported by other researchers. The effect of curvature ratios, percentage and length ratio of stenosis, and blood thickening on hemodynamic characteristics of blood flow are investigated. The results confirm that the maximum wall shear stress arises near the stenosis neck and as expected, by decreasing the stenosis length, the maximum value of wall shear stress increases. In addition, the results prove that the shear thickening fluid shows a more stable velocity profile rather than the shear thinning fluid flow.
According to Fig. 1, a curved artery including an inlet straight circular cylinder with L
in
length, a 90-degree elbow with an axisymmetric stenosis, and an outlet straight circular cylinder with L
out
length is considered. The peak of stenosis is located at 𝜃 = 45°. The diameter of the artery is 2a and the curvature radius of the elbow is R. Normally, the atherosclerosis disease and the plaque deposits cause the inner wall of the artery to become roughened and also cause the muscle wall to be rigid and inelastic. Therefore, in this simulation, the wall of geometry is assumed to be rigid. It is also assumed that the stenosis develops in an axially symmetric manner due to some abnormal growth over a length L of the artery (between position P1 and P2), as shown in Fig. 1. In this study, for determining percent stenosis (P
S
), the following relation is considered based on Ref. [22] (The equation of stenosis wall is assumed to be a parabolic form):
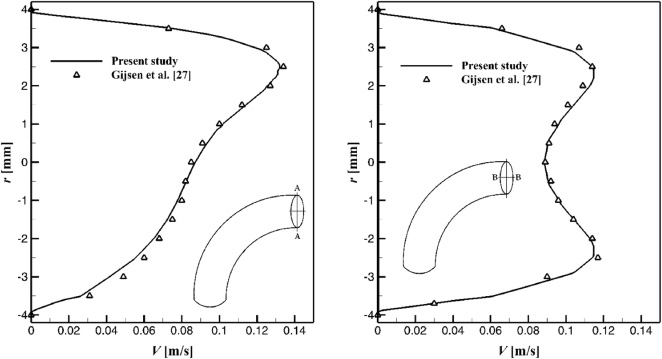
Axial velocity profile (V ) versus radius (r) at end diastole for the Newtonian blood flow at section 𝜃 = 90° in the symmetry plane of the artery (line A-A) and perpendicular to this plane (line B-B).
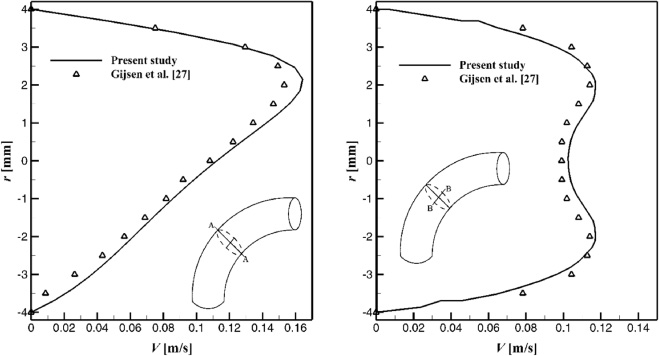
Axial velocity profile (V ) versus radius (r) at begin diastole for the non-Newtonian blood flow at section 𝜃 = 45° in the symmetry plane of the artery (line A-A) and perpendicular to this plane (line B-B).
At the inlet of the artery, a realistic pulsatile waveform is utilized according to the experimental data reported by Pedley [24] as plotted in Fig. 2. In this figure, the maximum velocity of cycle is 0.262 [ms−1] at 1.24 [sec] of Systole, the minimum velocity is

Dimensionless wall shear stress (𝜏∗, in inner wall of symmetry plane) via angular position (𝜃) at t∕t c = 1.24 for different stenosis lengths: 𝛿 = 0.0 (1), 𝛿 = 0.31 (2), 𝛿 = 0.50 (3), and 𝛿 = 0.67 (4).
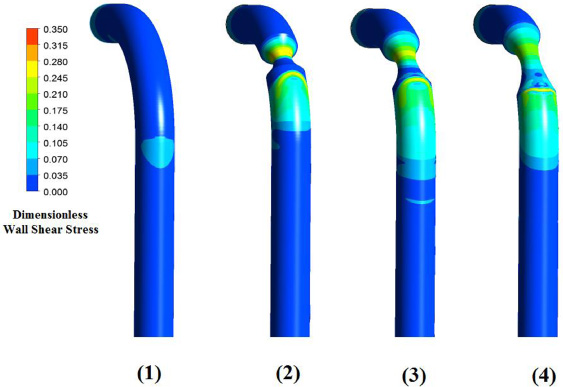
Dimensionless wall shear stress (𝜏∗, in whole arterial wall) at t∕t c = 1.24 for different stenosis lengths: 𝛿 = 0.0 (1), 𝛿 = 0.31 (2), 𝛿 = 0.50 (3), and 𝛿 = 0.67 (4).
In this investigation, to obtain a numerical solution of the governing equations (3) and (4), the commercial computational flow solver, FLUENT, based on the finite volume method, is used. Discretization of the mentioned equations at each control volume involved a power law differencing scheme. The system of discretized equations is solved iteratively using the SIMPLE algorithm. Time stepping employed a fully implicit scheme. Each pulse cycle (i.e., 1.0 [sec]) is divided into 400-time steps of size 2.5 milliseconds. In addition, a user-defined function (UDF) is written in C programming language to load the non-Newtonian power-law model inside the FLUENT solver.
Grid independence study
It is generally accepted that, in a numerical simulation, the numbers of cells directly affect the solution accuracy and the CPU run-time. One of the main aspects on checking the solution accuracy of a numerical study is to examine the influences of different cell numbers on the prediction of flow behavior. Therefore, to find a suitable number of cells, four different mesh sizes are considered as reported in Table 1. The profile of dimensionless axial velocity (V ∗) versus dimensionless radius (r ∗) at sections of 𝜃 = 60° and 𝜃 = 90° in the symmetry plane of the artery with the stenosis length ratio of 𝛿 = L∕R = 0.3, curvature ratio of 𝜀 = a∕R = 0.17, and stenosis of P S = 25 percent are plotted in Fig. 3 for t = 1.24 [sec] and t = 1.40 [sec], respectively. Here, r ∗ = r∕a and V ∗ = V∕U, where, U = 0.262 [ms−1] is the maximum velocity of pulsatile cycle at 1.24 [sec] of Systole (See Fig. 2). The results show that the dimensionless axial velocity profiles for both M3 and M4 are approximately conformed. Therefore, to keep the computational costs low, the mesh resolution of M3 is selected for the next analysis.
Four different mesh sizes considered for grid independence study
Four different mesh sizes considered for grid independence study
In order to validate the proposed methodology, the unsteady Newtonian and non-Newtonian blood flow inside a 90° curved tube (without any stenosis) is selected. The inlet and outlet boundary conditions are similar to those set by Gijsen et al. [27]. The dimensions of the tube are based on a carotid artery, i.e., tube radius is 4 mm and the curvature radius of the elbow is 24 mm. According to Section 5, around 3,200,000 cells are generated inside the tube. For the Newtonian blood flow, the axial velocity profiles at section 𝜃 = 90° in the symmetry plane of the artery (line A-A) and perpendicular to this plane (line B-B) are plotted in Fig. 4. The results are for the time at the end diastole. For the non-Newtonian blood flow, the axial velocity profiles at section 𝜃 = 45° in the symmetry plane of the artery (line A-A) and perpendicular to this plane (line B-B) are plotted in Fig. 5. The results are for the time at the begin diastole. The excellent agreement between the current numerical results and the works of Gijsen et al. [27] for both Newtonian and non-Newtonian blood flows (presented in Figs 4 and 5) gives credence to the accuracy of the present numerical study.
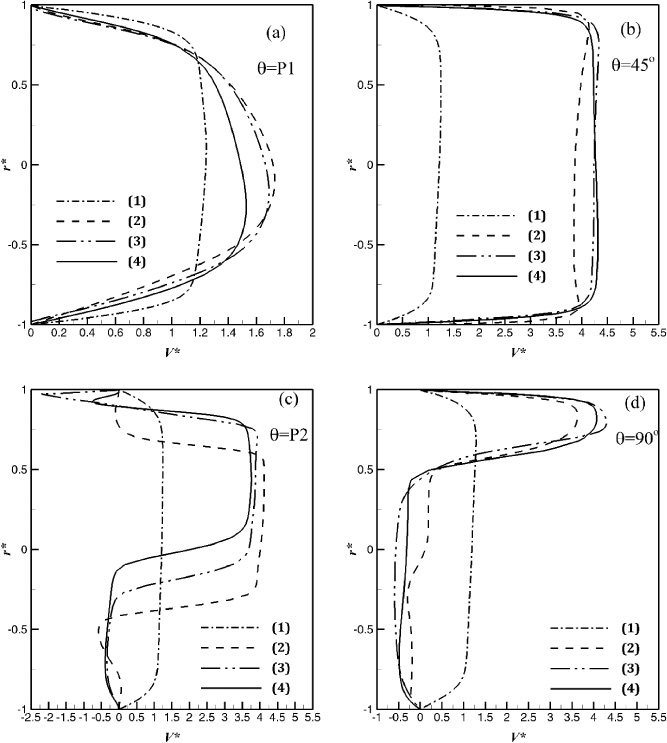
Dimensionless axial velocity profile (V ∗, in symmetry plane) versus dimensionless radius (r ∗) at time t∕t c = 1.24 and four angular positions of P1, 𝜃 = 45°, P2, and 𝜃 = 90° for different stenosis lengths: 𝛿 = 0.0 (1), 𝛿 = 0.31 (2), 𝛿 = 0.50 (3), and 𝛿 = 0.67 (4).

Dimensionless wall shear stress (𝜏∗, in inner wall of symmetry plane) via angular position (𝜃) at t∕t c = 1.24 for different curvature ratios: 𝜀 = 0.17 (1), 𝜀 = 0.09 (2), and 𝜀 = 0.05 (3).
Vascular biologists believe that narrowing the area (stenosis) in the curved arteries has a significant effect on the hemodynamics of the bloodstream which can greatly affect vascular diseases progression. Therefore, in this section, the effect of some crucial parameters such as curvature ratio, percentage and length ratio of stenosis, and blood thickening on hemodynamic characteristics of the pulsatile blood flow through stenosed curved arteries are investigated and discussed. The governing parameters for these simulations are summarized and given in Table 2.
The governing parameters for nanofluid simulations
The governing parameters for nanofluid simulations
It is observed that increasing stenosis length is an independent risk factor for periprocedural stroke or death in the endovascular treatment and carotid endarterectomy. Stenosis length merits further investigation in carotid revascularisation trials (vascular bypass and angioplasty). Because of these issues, in this subsection, the effect of the stenosis length ratio (𝛿 = L∕R) on hemodynamic characteristics of the pulsatile blood flow, i.e., dimensionless wall shear stress (𝜏∗ = 𝜏∕(𝜌U 2)) and dimensionless velocity profile (V ∗ = V∕U) through stenosed curved arteries are presented via Figs 6 through 8. For this purpose, a curved artery with curvature ratio 𝜀 = a∕R = 0.17 and a stenosis of P S = 50% is considered. Three different stenosis lengths, i.e. 𝛿 = 0.31,0.50, and 0.67, are selected and the results are compared to an artery with no stenosis. Figure 6 presents the dimensionless wall shear stress (𝜏∗, in inner wall of symmetry plane) versus angular position at time t∕t c = 1.24 (maximum velocity of Systole). The obtained results depict that in the case of no-stenosis the wall shear stress is not highly dependent on the angular position. But for the case of stenosis, the results display that the wall shear stress increases from position P1, reaches its maximum value near the middle of stenosis and falls again towards the position P2. Also, as expected, by decreasing the stenosis length, the maximum value of wall shear stress increases. In addition, for a better understanding of arterial blood flow patterns, the wall shear stress contours on the whole arterial wall for four mentioned stenosis length ratios are demonstrated in Fig. 7. These contours are again emphasized that the maximum wall shear stress happens near the stenosis neck. Figure 8 illustrates the dimensionless axial velocity profile (V ∗ = V∕U, in the symmetry plane) at time t∕t c = 1.24 in four different angular positions, i.e. P1 (begin of stenosis), 𝜃 = 45° (middle of stenosis), P2 (end of stenosis), and 𝜃 = 90° (end of bend). The results show that, in the case of no-stenosis, the velocity profiles from position P1 to 𝜃 = 90° are approximately the same, because the flow becomes nearly fully developed after position P1. In the case of stenosis, the results illustrate that the velocity profile at positions P1, 𝜃 = 45°, and 𝜃 = 90° is not highly dependent on the stenosis length, but at position P2 (or end of stenosis), the influence of stenosis length on velocity profile is highlighted. The reason for this behavior is due to the flow separation behind the stenosis and its strength near the stenosis.
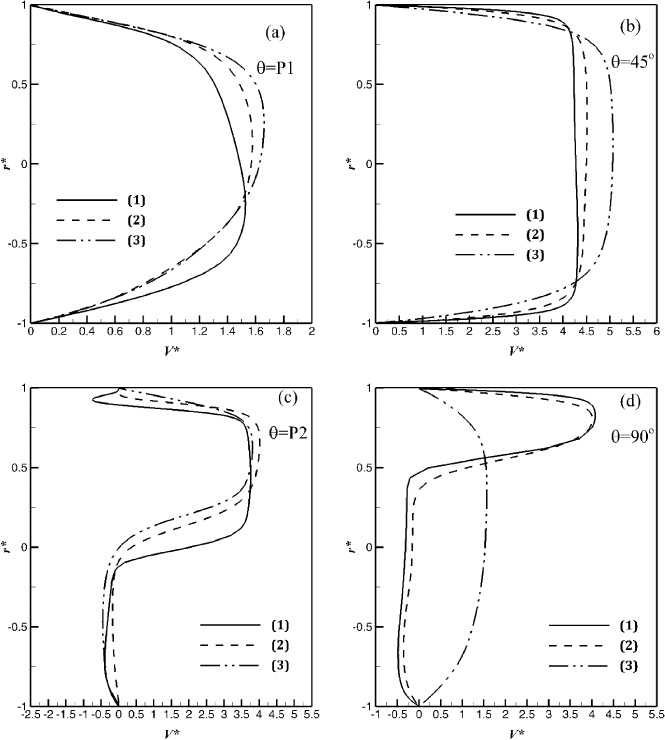
Dimensionless axial velocity profile (V ∗, in symmetry plane) versus dimensionless radius (r ∗) at time t∕t c = 1.24 and four angular positions of P1, 𝜃 = 45°, P2, and 𝜃 = 90° for different artery’s curvature ratios: 𝜀 = 0.17 (1), 𝜀 = 0.09 (2), and 𝜀 = 0.05 (3).

Dimensionless wall shear stress (𝜏∗, in whole arterial wall) at t∕t c = 1.24 for different power-law indexes: n = 0.6 (1), n = 1.0 (2), and n = 1.5 (3).
In this subsection, the effect of the curvature ratio (𝜀 = a∕R) on hemodynamic characteristics of the pulsatile blood flow, i.e., dimensionless wall shear stress (𝜏∗ = 𝜏∕(𝜌U 2)) and dimensionless velocity profile (V ∗ = V∕U) through stenosed curved arteries are analyzed via Figs 9 and 10. For this target, a curved artery with the stenosis length ratio of 𝛿 = 0.67 and a stenosis of P S = 50% is considered. Three different curvature ratios, i.e. 𝜀 = 0.05, 0.09, and 0.17 are chosen. Figure 9 demonstrates the dimensionless wall shear stress (𝜏∗, in inner wall of symmetry plane) versus angular position at time t∕t c = 1.24 (maximum velocity of Systole). The graphs show that the curvature ratio has no high impact on dimensionless wall shear stress. Also, the maximum wall shear stress always occurs near the middle of the stenosis (at position 𝜃 = 45°), as expected. The dimensionless axial velocity profiles (V ∗ = V∕U, in the symmetry plane) at time t∕t c = 1.24 in four different angular positions, i.e. P1 (begin of stenosis), 𝜃 = 45° (middle of stenosis), P2 (end of stenosis), and 𝜃 = 90° (end of bend) are plotted in Fig. 10. The velocity profiles in angular positions of P1, 𝜃 = 45°, and P2 for all three curvature ratios have the same pattern. It means that the value of 𝜀 does not highly influence the velocity configuration from the inlet of the artery to the end of the stenosis. However, as predicted for narrow curved arteries (such as 𝜀 = 0.05), the fluid flow again reaches to a fully-developed pattern at the end of bend (𝜃 = 90°) but for capacious arteries (𝜀 ≥ 0.09) the effect of flow separation is seen even at the end of artery’s bend.

Dimensionless axial velocity profile (V ∗, in symmetry plane) versus dimensionless radius (r ∗) at time t∕t c = 1.24 and four angular positions of P1, 𝜃 = 45°, P2, and 𝜃 = 90° for different power-law indexes: n = 0.6 (1), n = 1.0 (2), and n = 1.5 (3).
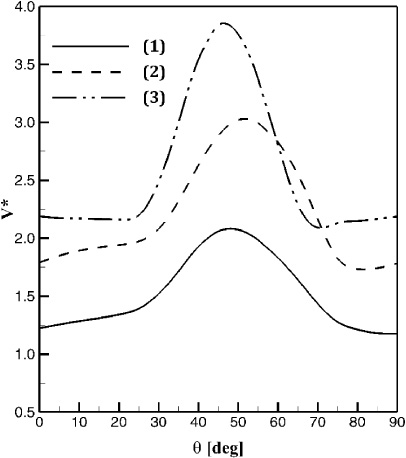
Dimensionless axial velocity at the artery centerline via angular position (𝜃) at t∕t c = 1.24 for different fluid types: n = 0.6 (1), n = 1.0 (2), and n = 1.5 (3).
Increasing the number of red blood cells (RBCs) is a natural response due to the deficiency of oxygen, e.g. at altitude, or in some heart diseases. However, producing too many RBCs can do more harm than good; leading to altitude sickness and death. Thickening of the blood due to hypoxia, oxygen starvation, is also a very common symptom of many cardiovascular diseases. In order to analyze the effect of blood thickening (polycythemia) on hemodynamic characteristics of the pulsatile blood flow, blood can be modeled as a non-Newtonian fluid. Referring to the power-law model (Eq. ((4))), the influence of power-law index (n = 0.6,1, and 1.5) on dimensionless wall shear stress (𝜏∗ = 𝜏∕(𝜌U 2)) and dimensionless velocity profile (V ∗ = V∕U) through stenosed curved arteries are investigated via Figs 11 through 13. For this aim, a curved artery with the stenosis length ratio of 𝛿 = 0.67, a curvature ration of 𝜀 = 0.17, and a stenosis of P S = 25% is chosen. Figure 11 depicts the dimensionless wall shear stress contours on the whole arterial wall for three mentioned power-law indexes at time t∕t c = 1.24. The results show that the wall shear stress of n = 1.5 is around 380 times higher than the one for the n = 1.0. This means that blood thickening will increase the amount of wall shear stress and can be harmful for the arterial walls.
In Fig. 12 the dimensionless axial velocity profiles (V ∗ = V∕U, in the symmetry plane) at time t∕t c =1.24 in four different angular positions, i.e. P1 (begin of stenosis), 𝜃 = 45° (middle of stenosis), P2 (end of stenosis), and 𝜃 = 90° (end of bend), are displayed. For each angular position, three different power-law indexes, i.e., n = 0.6 (a non-Newtonian fluid with shear-thinning behavior), n = 1.0 (a Newtonian fluid), and n = 1.5 (a non-Newtonian fluid with shear-thickening behavior fluid), are considered for modeling of blood flow. At peak systole (t∕t c = 1.24), the shear thickening fluid (n = 1.5) shows a more stable velocity profile from position P1 to position 𝜃 = 90°. This means that a pronounced flow separation is not seen at the end of stenosis (position P2). But as shown in Fig. 12(c), a backflow is observed at the end of stenosis for the shear thinning fluid (n = 0.6). Another point is that the streamwise velocity profile of the shear thinning fluid (n = 0.6) shifts towards the outer side of the artery at the bend exit but this issue is not highlighted for the shear thickening fluid (n = 1.5). Figure 13 expresses the dimensionless axial velocity at the artery centerline for these three types of fluids from the beginning of bend (𝜃 = 0°) to the end of bend (𝜃 = 90°). It is seen that the value of the axial streamwise velocity at the artery centerline for the shear thickening fluid is larger than the shear thinning fluid.
Conclusion
The unsteady Newtonian/non-Newtonian pulsatile entry blood flow inside a 3D curved stenosed artery is investigated numerically. For taking into account the shear thinning or shear thickening behavior of non-Newtonian fluids, the blood viscosity is defined by the power-law model (Ostwald de Waele Equation). At the inlet of the artery, a realistic pulsatile waveform is proposed based on the experimental data reported by other researchers. This study concerns the effect of the curvature ratios, percentage and length ratio of stenosis, and blood thickening on hemodynamic characteristics of the flow. The results conclude the following essential items:
The maximum wall shear stress happens near the stenosis neck. As expected, by decreasing the stenosis length, the maximum value of wall shear stress increases. Shear thickening fluid shows a more stable velocity profile rather than the shear thinning fluid flow. The streamwise velocity profile of the shear thinning fluid shifts towards the outer side of the artery at the bend exit but this issue is not highlighted for the shear thickening fluid. Due to the flow separation behind the stenosis, the influence of stenosis length on the velocity profile is highlighted at the end of stenosis.
Footnotes
Acknowledgements
The authors would like to acknowledge the Shahrood University of Technology, which supported this study.