
Abstract
BACKGROUND:
Titanium nitride (TiN), titanium carbide (TiC) and titanium carbonitride (TiNC) thin films show promising practical applications due to their photoelectric properties and corrosion behaviour.
OBJECTIVE:
In this work, we investigated the factors which may affect the optical properties and the corrosion behaviour of these coatings.
METHODS:
The titanium coatings were carried out by sputtering using the target of Ti6Al4V (purity 99.96%) with different N2, CH4 and Ar partial pressures. XRD, FTIR, Raman and SEM with EDX studies show the formation of titanium nitride, titanium carbide coatings. Uv-vis spectroscopy was carried out to estimate the optical properties using the numerical Swanepoel method. Potentiodynamic polarization studies in Hank’s solution show that the corrosion resistance is found to be in the order of C-TiN(2) > C-TiN(1) > TiN > TiC.
RESULTS:
A high protective efficiency was determined (60%) when comparing TiNC(2) and TiC corrosion current densities, which confirms the lower corrosion velocity and the higher passivation stability of the coatings composed with TiN and TiC phases. Electrochemical impedance spectroscopy studies show that the Rct increases in the following order: TiC < TiN < C-TiN(1) < C-TiN(2), highlighting the fact that C-TiN(2) coating has the higher corrosion resistance.
Keywords
Introduction
In the recent decade, much research has been devoted to develop thin films with relevant physical properties. Thin films are widely used as protective coatings against corrosion [1,2]. Because the ions released in the corrosion process may affect the environment, it is important to minimize this number by developing protective layers [3]. The number of ions released depends on the corrosion current that can be measured by the Tafel curves (potensiodynamic tests). Tafel curve is a test that identifies the biocompatibility of a material used in many studies. By taking, for example, titanium and its alloys, results of corrosion current densities obtained for titanium nitride (TiN), I corr = 0.270 μA∕cm2 [4], H2 doped TiN, I corr = 0.168 μA∕cm2 [5], and C doped TiN, I corr = 0.175 μA∕cm2 [3], measured in simulated biologic fluid at 37 °C confirm that these materials can be used as metallic implant coatings. From these results, it is shown that titanium and its alloys have biomedical properties resistant to corrosion and are therefore strongly used as protective coatings in the medical field [6,7]. In order to design implants with corrosion-resistant properties, there are a variety of chemical and physical procedures that could be used for the deposition of thin layers. Also the chemical vapor deposition [8], sol-gel [9] and electron beam evaporation [10] can be found.
The RF magnetron sputtering is a very useful technique as it provides large surface coatings with good uniformity of thickness. The use of a RF generator is essential to maintain the discharge and to avoid charge build-up when sputtering insulating materials. Magnets are used to enhance the vicinity of the target (magnetron sputtering). Their use provides the advantage of trapping not only electrons, but also charged species at the target, so that they do not hit the substrate, with an improvement of the film quality [11–13]. The main objective of the paper is to investigate the electrochemical corrosion behaviour and the optical properties of TiN, TiC, TiNC(1) and TiNC(2) thin films. These studies open up a new field of application.
Experiment
The TiN, TiC, C-TiN(1) and C-TiN(2) coatings were deposited on pure titanium, intrinsic single crystalline silicon and glass substrate by controlling the flow rate of N2, CH4 and Ar. RF magnetron sputtering (RF source 13.56 MHz, power: 150 W) was used. The substrate surfaces were mechanically grounded by different grades of SiC emery papers, polished by diamond pastes to a surface roughness of R a = 0.4 μm, cleaned in an ultra-sonic methanol bath for 10 min and finished with distilled water. The deposition chamber was equipped with a circular Ti6Al4V target (99.96% purity, 5 cm in diameter). To ensure homogeneity of the deposited coatings, the substrates were placed between 2 magnetrons (at 4 cm above and 0.5 cm below the substrate). The reactor was evacuated to a pressure of 2.10−5 mbar using a turbomolecular pump. To remove any possible oxides layers from the target surface prior the deposition, the Ti surface was pre-sputtered by argon plasma for 10 min (etching operation). The total gas pressure was kept constant at 10−2 mbar during the deposition. The sputtering conditions for the four coatings are given in Table 1.
Sputtering conditions for the four coatings
Sputtering conditions for the four coatings
The study of the crystal structure was carried out by X-ray diffraction (XRD) and was carried out in the range 2𝜃 = 30–90° using D8 Siemens Advance diffractometer with Cu K𝛼 radiation (𝜆 = 1.5406 Å). Fourier Transform Infrared spectrometer Jasco FT/IR-6300 was used to record FTIR spectra in the transmission mode in the range 400–4000 cm−1. Raman spectra were measured using SENTERRA R200L with a 532 nm radiation from an argon ion laser as exciting light. The samples were illuminated with 10 mw of laser power and the spectral data were collected in the continuous scan mode over the region of 50–2000 cm−1. The estimation of the coating thicknesses, refractive indexes and energy band gaps was carried out from optical transmission spectra recorded with UV-Visible Jasco V-670 spectrometer in similarity to the method used by Manifacier et al. [14], Swanepoel [15], Marquezet et al. [16], and Abdelrahman [17]. Potentiodynamic polarization curves and electrochemical impedance spectroscopy (EIS) were obtained in a biological fluid solution maintained at 37 ± 1 °C (composition given in Table 2). The isothermal nature of the solution required the use of a cell provided with an electrode having an exposed area of 1 cm2, a reference electrode (Ag/AgCl) and a platinum wire counter-electrode. To eliminate oxygen, the solution was purged with nitrogen for one hour before sample immersion. Nyquist diagrams were obtained by frequency sweep in the range of 100 kHz to 0.001 Hz using sinusoidal voltage amplitude of 10 mV applied to the working electrode and the reference electrode. For the characterization of the corrosion behaviour of the coatings, a cyclic potentiodynamic polarization device (PGP 201 Potentiostat/Galvanostat) equipped with a cell containing the three conventional electrodes, is used. Samples of 1 cm2 are used as working electrodes. The potentiodynamic polarization curves were plotted from −2000 to +1500 mV at a scan rate of 20 mV/min. The Tafel’s slope, the corrosion current density (I corr ) and the corrosion potential (E, i = 0) were determined for these samples.
Composition of SBF solution for one liter of distilled water and 1 ml of HCl
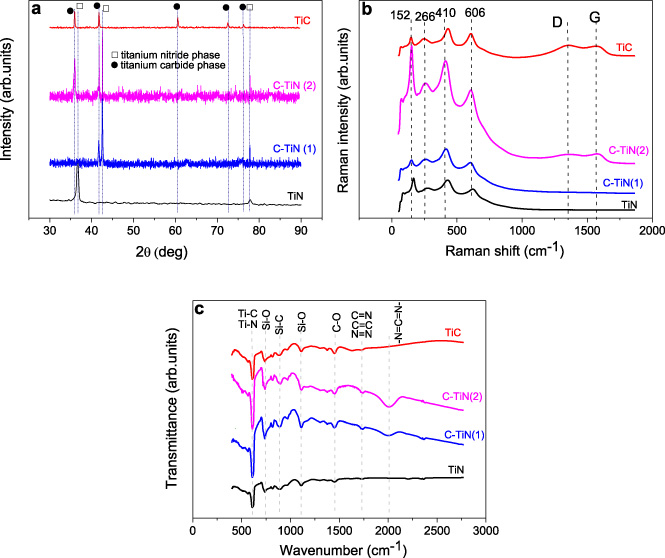
(a) X-ray diffraction patterns of TiN, TiC, C-TiN(1) and C-TiN(2) thin films, (b) Raman spectra in the range 0–1700 cm−1, and (c) FTIR spectra of C-TiN and TiN deposited on Si single crystal.
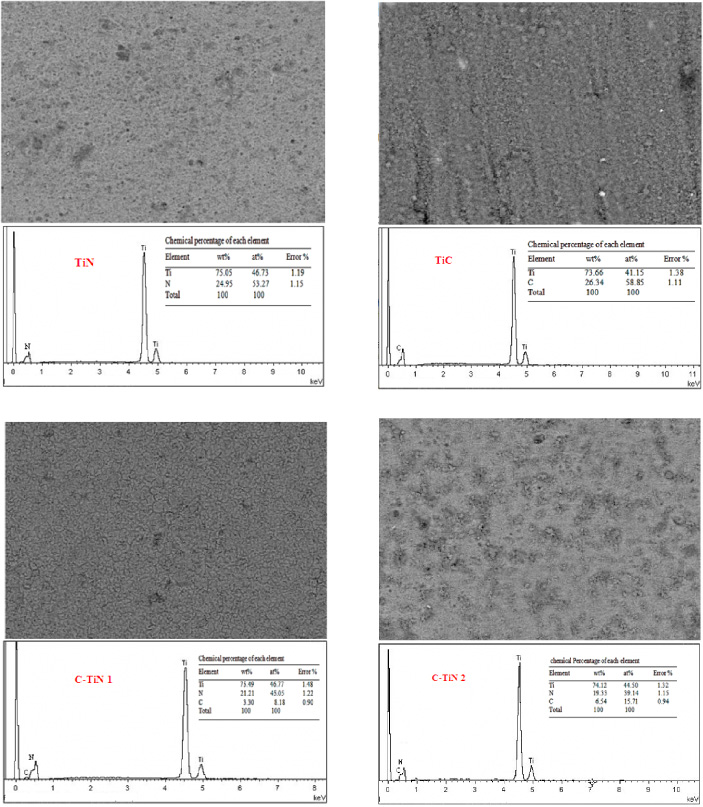
SEM with EDX element map taken on the film surface of TiN, TiC, C-TiN(1) and C-TiN(2) thin films.

Theoretical calculation and the experimental of optical transmission data for TiC, TiN, C-TiN (1) and C-TiN (2) thin films.
Figure 1a shows the XRD patterns of TiN, TiC, C-TiN(1), and C-TiN(2) thin films, recorded in the 2𝜃 range 10°–90°. The peaks at 2𝜃 = 35.97°, 41.78°, 60.49°, 72.61°, 76.28° correspond to (111), (200), (220), (311) and (222) reflections of face centered cubic phase of titanium carbide (JCPDS 32–1383). The peak at 2𝜃 = 36.64° is a characteristic of the TiN phase [2]. The patterns of C-TiN(1) and C-TiN(2) show the presence of the TiN and TiC phases both. Figure 1b shows the FTIR transmission spectra of films, deposited on silicon single crystal substrate which is transparent to infrared radiations. The FTIR spectra of C-TiN(1) and C-TiN(2) show the presence of compounds containing Ti, N, C and O-H. The stretching vibrations of Ti-C bond can be distinguished at 550 cm−1 [18] and an intense Ti-N stretching mode is observed at 600 cm−1. The peaks centred at 740 cm−1 and 884 cm−1 are related to the symmetric stretching of Si-O and Si-C bonds respectively [20–22]. Oxygen and carbon may come from silicon native oxidation and the reactive gas used for sputtering (Ar + 10% CH4). The peak around 1110 cm−1 is associated with asymmetric stretching of Si-O [23], while the peak located at 1445 cm−1 corresponds to the C-O bond [24]. The band at 1630 cm−1 may be attributed to C=C, N=N and C=N double bonds [25]. An asymmetric stretching band at 2050 cm−1 may be attributed to −N=C=N− [19]. The small band at 2914 cm−1 indicates the presence of C-H [19,26] and the band near 3300 is related to O-H from air exposure [26,27]. Comparing FTIR spectra of TiN before and after carbon addition shows the appearance of four new peaks, after C addition, at 550, 1445, 2050 and 2914 cm−1 which are attributed to Ti-C, C-O, −N=C=N− and C-H bonds respectively. Figure 1c presents the Raman spectra of the samples. A green 532 nm laser with a power of 20 mW was used. C-TiN(1) and C-TiN(2) have a very similar Raman spectrum to those of titanium nitride TiN and titanium carbide TiC in the range 100 cm−1 to 800 cm−1 [28]. This spectral region shows acoustical and optical modes of titanium compounds [29]. It has been evidenced that the peak at 152 cm−1 is mainly determined by the vibrations of the heavy Ti ions in the acoustic range [30]. Peaks at about 266, 410 and 606 cm−1 are characteristic of TiN, TiCN and TiC [28]. No Raman bands were found in the 2000–2400 cm−1 range corresponding to C≡N stretching vibrations [31]. In the range 1300–1650 cm−1 reveals two weak bands located at about 1350 and 1600 cm−1 that can be due to the presence of amorphous carbon, graphite [28] and C-N. These last two peaks are the only difference between TiC and TiN. The difference in relative intensity of the last two peaks between C-TiN(1) and C-TiN(2) may be related to the rate of carbon. So, these results indicate that our films contain carbonaceous phases, in agreement with XRD and FTIR results.

Refractive index dispersion curves of TiC, TiN, C-TiN (1) and C-TiN (2) thin films with Swanepoel calculation.
The EDX elemental distribution is shown in Fig. 2. This figure shows that analysis in different points of the four coatings the presence of Ti, N and C. The percentage of each element in the surface is summarized in Fig. 3, which shows the transmission spectra of TiC, TiN, C-TiN(1) and C-TiN(2) thin films as a function of wavelength fitted to Eq. (1) that was obtained by modifying the values of film thickness (d) and refractive index (n). The transmittance of these films decreased with the decrease of wavelength and the transmission spectra estimated from Eq. (1) fits well with the transmission data obtained experimentally. The optical transmission T for normal incidence is given by the following equations [32], as developed by Swanepoel [15]:
The estimated refractive indices were plotted as a function of wavelength in Fig. 4 and the values are given in Table 3. The higher refractive index observed for the TiC thin film is probably due to the strong absorbance of this film. As shown in Fig. 5, the energy band gap of the TiC, TiN, C-TiN(1) and C-TiN(2) thin films is estimated by extrapolating the linear part of the (𝛼h𝜈)2 against (h𝜈) plot to the horizontal axis.
Refractive indexes and energy band gap of TiN, TiC, C-TiN(1) and C-TiN(2)

Plot of (𝛼h𝜐)2 vs. h𝜐 for the four thin films. The optical band gap is given by the intersection of the linear section of the (𝛼h𝜐)2-h𝜐 curve with the h𝜐 axis.
The potentiodynamic polarization curves of the coatings immersed in SBF solution are shown in Fig. 6a. Tafel polarization curves have been used to calculate the surface corrosion rate. We have deduced from these curves the anodic and the cathodic slope values, which are necessary to calculate the corrosion rate for each system. The measured values (I corr, TiN = 1.020 μA∕cm2, I corr, TiC = 0.875 μA∕cm2, I corr, C-TiN(1) = 0.645 μA∕cm2, I corr, C-TiN(2) = 0.453 μA∕cm2) indicate that the deposited films improved the corrosion resistance of the pure titanium. The polarization data are presented in Table 4. We point out that the corrosion behaviour of pure titanium used as substrate was studied in SBF solution in the same conditions of the four coatings. The measured value of corrosion current densitie I corr , substrate = 2.020 μA/cm2 [2]. This results indicate that the deposited films significantly improve the corrosion resistance of the pure titanium.
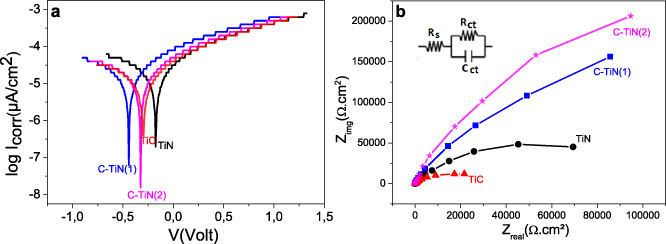
(a) Potentiodynamic polarization curves of the deposited films in SBF solution at 37 °C. (b) Impedance spectra in the low frequency.
Polaraziation data obtained for TiN, TiC, C-TiN(1) and C-TiN(2)
The electrochemical impedance spectroscopy (EIS) results are presented in Fig. 6b. The charge transfer process at the interface between electrocatalyst and electrolyte is represented as a semicircle in the Nyquist plot. The diameter of the semicircle reflects the charge-transfer resistance. It consists of a charge transfer resistance (RCT) and a capacitor (CCT) in parallel, all connected in series to a spreading or electrolyte resistance (RS). The diameter of the semicircle reflects the charge-transfer resistance. Bigger diameter corresponds to a low corrosion current. As can be seen, the arch of C-TiN2 electrode appeared much bigger. The values of the series resistance of the electrochemical system are summarized in Table 5.
The values of the series resistance of the electrochemical system
Radio frequency sputtering is used in this study to deposit four titanium coatings: TiN (30% Ar + 70% N2), TiC (30% Ar + 70% CH4), C-TiN(1) (30% Ar + 50% N2 + 20% CH4) and C-TiN(2) (30% Ar + 20N2% + 50% CH4). XRD analyses show the formation of titanium nitride, titanium carbide and a mixture of them with different quantities in C-TiN(1) and C-TiN(2) films. In addition, FTIR spectroscopy shows that the band −C=N=C− has completely disappeared in the TiC and TiN films when only one reactive gas (N2 or CH4) was used in the sputtering. Potentiodynamic polarization in Hank’s solution showed that the corrosion resistance is found to be in the order of C-TiN(2) > C-TiN(1) > TiN > TiC. In addition to this, a high protective efficiency was determined (60%) by the comparison of C-TiN(2) with TiC corrosion current densities.
Footnotes
Conflict of interest
None to report.