



Abstract
BACKGROUND:
During the masticatory cycle, loads of different intensities and directions are received by the dental structures and/or implants, which can cause micromovements at the junction between the abutment and implant.
OBJECTIVE:
The objective of this in vitro study was to evaluate the behavior of three different implant connections subjected to different load values using a digital radiography system. Additionally, the torque values for removing the abutment screws were also measured and compared.
METHODS:
Ninety sets of implant and abutment (IA) were used, divided into three groups according to the type of connection (n = 30 per group): EH group, external hexagon type connection; IH group, internal hexagon connection; and, MT group, Morse taper connection.
RESULTS:
MT group showed the better vertical misfit behavior at the three intensity of load applied, in comparison with EH and IH groups. In the analysis of torque maintenance (detorque test), MT group showed higher values of detorque when compared with the measured values of EH and IH groups (p < 0.001).
CONCLUSIONS:
The IA sets of EH and IH groups showed a microgap in all levels of applied loads, unlike the MT group this event was not observed. In the detorque test, MT group increase in the torque values when compared to the initial torque applied, unlike EH and IH groups showed a decrease in the initially torque applied in all conditions tested. A positive correlation was detected between the misfit and detorque values.
Introduction
Different connections between implant and abutment have been proposed to improve the stability and increase the predictability of this set when receiving masticatory loads. Basically, two types of forces are transmitted to the sets (implant/abutment), axial and transversal forces. Axial forces are more favorable, while transverse forces exert very high stress peaks on the sets [1,2].
The external hexagon connection was the first to be used and became the standard for the worldwide implant industry [3]. Although other types of connections have emerged that have some advantages, external hexagon implants still dominate the markets in the United States and Europe [4]. However, internal connection systems were created to improve, mainly, the stability in unit rehabilitation.
Complete sealing between the set (abutment and implant) is a desired condition so that bacterial infiltration does not occur in this area. In fact, several studies demonstrated the same microbiological contamination of the implant/abutment connection and the peri-implant sulcus, due to micro-pumping effect during masticatory loading [5]. And this might increase the risk of peri-implant disease onset [6].
Although, from a clinical standpoint, the complete sealing at the connection level seemed to be unobtainable, the quality of this characteristic was proved to be highly variable [7]. Therefore, understanding the bio-mechanical background of the different settings may result in providing more information to the clinicians.
Several studies have demonstrated, through bacterial infiltration tests, that the behavior between the different connection models is variable [8–11], and with the application of torque and loads can change these scenarios [12–14]. However, the visualization of micro movements during the application of loads on the sets (implant and abutment) is difficult to show and there are few reports in the literature [15]. Most evaluations of misfit of the sets or not are performed after the end of the tests by images obtained in scanning microscopy or X-ray microtomography [16,17]. On the other hand, these micro movements can alter the stability of the abutment fixing screw, which can lose the initial torque value.
Recently, Zipprich and collaborators [15] used microtomography to compare several implant models and showed the micro movements in different types of connections, however, they did not present measures of misfit of the sets (abutment and implant). The present in vitro study used a digital radiography system to assess the behavior of three different implant connections subjected to different load values. The interfaces and their stability during load application were evaluated. In addition, the torque values for removing the pillar screws were also measured and compared. A possible correlation between the misfit generated during the load application and the torque maintenance was analyzed.
Materials and methods
A total of 90 sets of implant and abutment (IA) were used, divided into three groups according to the type of connection (n = 30 per group): EH group, IA sets of external hexagon type connection; IH group, IA sets of internal hexagon connection; and, MT group, IA conical Morse taper connection sets. All implants used presented a conical design with dimensions of 4 mm in diameter and 11 mm in length. Meanwhile, the abutments used were 10 mm in total length and with dimensions of the connection parts described in Fig. 1.
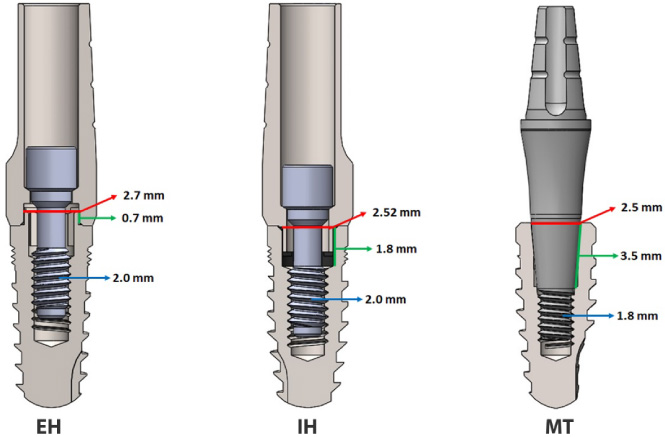
Schematic images of sets (IA) evaluated in each group. Red line represents the connection diameter, green line the connection length and blue line the screw diameter.
Initially, the 90 sets (n = 30 per group) were torqued at 30 N and, after 10 min all samples were retorqued [18]. One hour after the torque, the maximum value of detorque was measured and recorded for all samples. All torque and detorque applications were made using a computerized torque testing machine CME-30 nm (Técnica Industrial Oswaldo Filizola, São Paulo, Brazil). Then, all sets were torqued again as previously described (at 30 N, repeated after 1 h) for the load test execution.
Load application and radiographic images acquisition
The 30 samples of each group were analyzed with the application of non-axial loads with an angle of 30 ± 2 degrees [19] and inserted in a support base with the cervical portion of the implant (5 mm) out. The support base was manufactured in wrought stainless steels ASTM F899, with a square shape and a dimension of 15 ×15 cm. This support bar for the implants was fixed to the testing machine by means of a screw on its base. The loads were applied using a universal testing machine (AME, Osvaldo Filizola, São Paulo, Brazil), which was programmed to stop at three different intensities: load 1 at 200 N, load 2 at 400 N and load 3 at 600 N. The load level in each sample was kept stable for 5 min. Figure 2 shows the positioning of the samples during the application of the loads.

Representative image of the conditions (load application and set angulation) during the test.
To performance the radiographic images, a digital radiography system with a portable IriX-ray DX 3000 device (Dexcowin, Seoul, Korea) was positioned at a distance of 5 cm from the sample using a digital film RVG First intraoral system (Trophy, Toulouse, France) at a distance of 1 cm from the sample (Fig. 3). All images were taken observing the parallelism of the equipment with the IA junction line of the sets. The exposure time to obtain each radiograph was adjusted in 0.35 s. The images were transmitted directly to the computer using the Trophy imaging software (Toulouse, France).
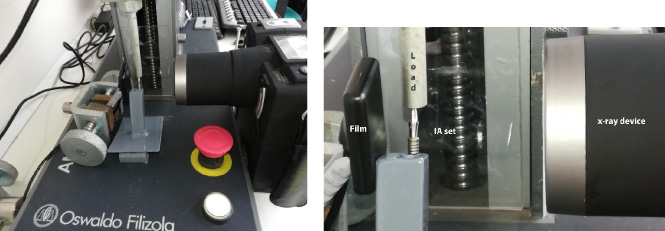
Image of the devices used during the load application and X-ray acquisition.
The radiographic images obtained from each group at each proposed load level were measured using the ImageJ version 1.44 program (National Institute of Mental Health, Bethesda, Maryland, USA). Firstly, the captured radiographic images were used for the calibration of the program, considering the original diameter of the implants (4.0 mm). After calibration, the sites of greatest separation observed between the implant and abutment were measured. Figure 4 shows the location where measurements of possible misfit were performed for each sample. In the present study, the misfit was considered the separation (opening) caused between the parts (implant and abutment) during the application of the load. In addition, the inclination angle of the sets was measured in each sample (Fig. 5). To reduce the margin of error in the measurements, all images were measured three times by two authors (SAG and BAD) and a general average of these measurements was used as the value for each sample.
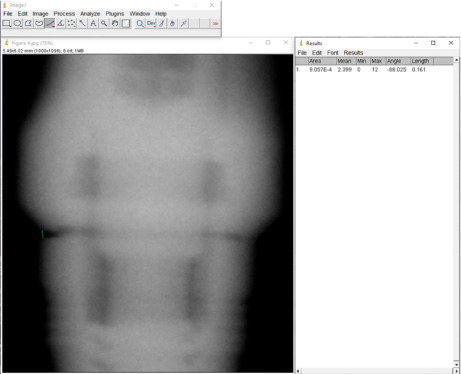
Representative image shows the location where the measurements of the misfit were made in each sample.
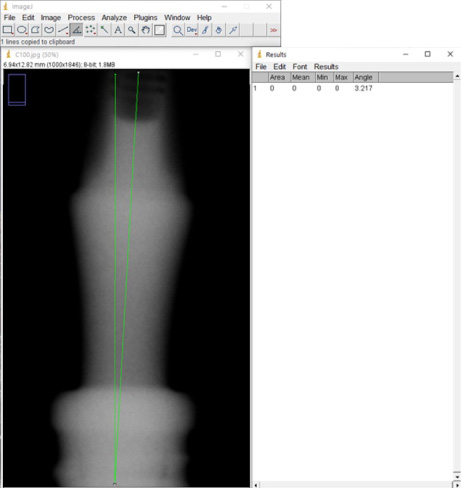
Representative image shows the location where the deformation angle of the sets was measured in each sample.
The sample size was based on a power level of 85% to obtain a p-value of 0.05, calculated using the software SigmaStat 4.0 (Systat Software Inc., San Jose, USA). For a desired power level of 85% with differences between the means and standard deviations of each group, the minimum sample size for each group under each condition was 8 sets. Statistical analyses were performed using a one-way analysis of variance (ANOVA) to determine the differences between the three conditions inside of each group. Bonferroni’s multiple comparison test was used to compare each condition between the four groups. Finally, the Pearson correlation test was applied to investigate the correlation between the torque and misfit values obtained in each group. All analyses used p < 0.05 to determine the statistical significance. GraphPad Prism program, version 5.01 (GraphPad Software) was used to perform all statistical analyses.
Results
Detorque measurements data and analysis
All samples resisted the proposed tests without exceeding the plastic deformation curve (permanent deformation).
Figure 6 shows a bar graph with the mean and standard deviation of the collected data of detorque values of screw abutment (EH and IH groups) and the solid abutment of MT group for the different conditions. The analysis of measured values at one hour after the torque application, the ANOVA one-way test showed an important statistical difference between the groups (p < 0.001). In the samples that received the load application of 200 N, the ANOVA one-way test showed a significant statistical difference between the groups (p = 0.0090). In the samples that received the load application of 400 N, the ANOVA one-way test showed a significant statistical difference between the groups (p = 0.0064). In the samples that received the load application of 600 N, the ANOVA one-way test showed an important statistical difference between the groups (p = 0.0074). Tables 1, 2, 3 and 4 present the data comparison between the groups for all conditions.
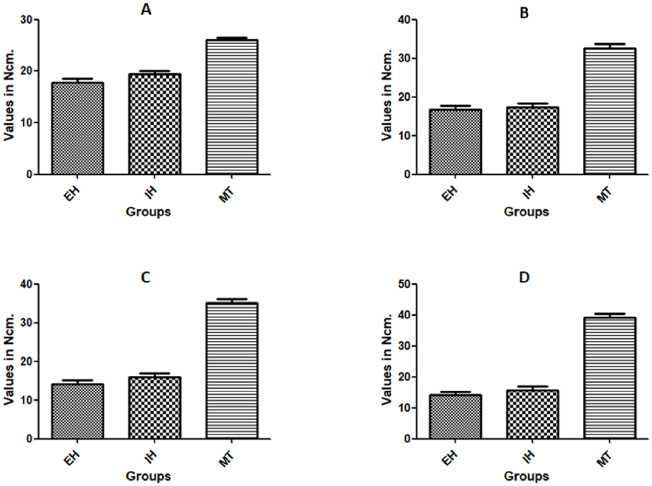
Bar graph of detorque values of screw abutment (EH and IH groups) and the solid abutment of MT group: (A) without load application (one hour after the torque application), (B) after 200 N of load application, (C) after 400 N of load application and (D) after 600 N of load application.
Bonferroni’s multiple comparison test of the measured detorque values of the abutment screws (EH and IH groups) and solid abutment (MT group), one hour after the initial torque application
vs = versus; Diff. = difference; CI = confidence interval; ∗ = statistically significant.
Bonferroni’s multiple comparison test of the measured detorque values of the abutment screws (EH and IH groups) and solid abutment (MT group), after the load application of 200 N
vs = versus; Diff. = difference; CI = confidence interval; ∗ = statistically significant.
Bonferroni’s multiple comparison test of the measured detorque values of the abutment screws (EH and IH groups) and solid abutment (MT group), after the load application of 400 N
vs = versus; Diff. = difference; CI = confidence interval; ∗ = statistically significant.
Bonferroni’s multiple comparison test of the measured detorque values of the abutment screws (EH and IH groups) and solid abutment (MT group), after the load application of 600 N
vs = versus; Diff. = difference; CI = confidence interval; ∗ = statistically significant.
The results obtained during the application of loads with different intensities showed that the sets IA of the groups EH and IH presented a misfit in all levels of loads proposed, while in the MT group no misfit was observed. In this MT group, it was possible to observe that the abutment receives most of the applied load and not the joining of parts between the sets. The means and standard deviation of the misfit values measured in the groups are shown in Table 5.
Mean, standard deviation and ANOVA statistical test of the misfit values measured in each group after the different load applications. Values in micrometer
Mean, standard deviation and ANOVA statistical test of the misfit values measured in each group after the different load applications. Values in micrometer
When the angle formed between the IA sets in each group was measured, higher angle values were observed in the MT group, as the curvature occurred in the transmucosal portion of the abutment. The values of the angle formed in the sets after the application of loads with different levels are shown in Table 6. In all cases the statistical analysis presented significative (p < 0.05).
Mean and standard deviation of the angle values measured in each group after the different load applications
The Pearson correlation test showed a strong positive correlation for the EH and IH groups between the values analyzed (detorque and misfit), showing these results: for the EH group R = 0.9795 and, for IH group R = 0.963. In the MT group the correlation cannot be tested because it was not detected misfit between the sets.
Discussion
In the present study, tests of quasi-static loads of 200, 400 and 600 N were performed on the specimens, with values close to the forces measured by different studies that measured the maximum bite force in the natural dentition. The force was applied on the samples with an angulation of 30 ± 2° simulating the most critical situation for the IA sets, according to the ISO 14801:2015 standard [19]. Once the preload (torque) decreases to a critical level and the external load quickly wears out the remaining preload. Vibrations, micro movements and openings in the interface resulting from the application of loads can lead to loosening of the fixing screw [20].
As for the devices used for torque and untwisting of the fixing screws, a computerized device was used because differences are found when the torque is applied by mechanical devices or manually. Studies have shown that the tightening torque performed with a manual wrench showed variability for the same operator, between different operators and between implant systems [21,22]. On the other hand, authors stated that the screws must work within their elastic range both during the application of torque to occur preload, and during chewing [23]. If the screws deform plastically at any time, the preload and clamping forces will be lost, which will result in the loss of the abutment fixation. The equipment that we used for torque and detorque tests present an angular measurement system with 0.002° of resolution.
The influence of the type of hexagonal connection on maintaining the stability of IA sets was analyzed by several authors, which stated that the connections of the internal hexagon are superior to those of the external hexagon [24,25]. Our results corroborate these previous statements, however, when these two hexagonal systems were compared with the Morse taper connection system, the latter presented a much superior performance in all analyses. This significant performance in relation to the stability of the Morse taper internal connection noted in our study was also confirmed by research by several other authors [26–29]. However, other authors have observed that the fastening screws of the screwed joint only loosen if external forces that try to separate the parts, that is, forces of separation of the assemblies are greater than the forces that hold them together, said clamping forces [30].
This may be due to the improvement of the embryos between the straight solid abutment and the Morse taper, increasing the force required to remove the screw, since the taper induces frictional forces between the component and the implant, with an intimate adaptation between the overlapping surfaces [27]. While the thread tension preload can be completely compensated, the friction in the taper guarantees a stable and rotation-free connection between the implant and the connection [31].
The measurement of the misfit caused by the application of loads, with different values, demonstrated that in the systems of hexagonal connections, whether internal or external, always occurs. However, in the Morse taper connection system, the separation of the walls of the IA sets was not observed in any of the samples. These findings coincide with the study presented by Zipprich and collaborators [15], who observed a similar situation analyzing different implant systems.
Chewing loads can range from approximately 20–200 kg depending on the type of food to be crushed. [32] The most frequent studies to see the dissipation of these forces were carried out using a finite element simulation [33–35]. However, this type of simulation does not show the movement of the sets. Normally, in the studies that were performed the measurement of microgaps, the cuts were made after the loads were applied, and when the sets are released from the applied pressure, they return to their normal state, as long as the load value does not exceed the limit of resistance of the tested sets. Thus, our study sought to present what actually occurs at the interface during the moment that the sets are receiving the application of the loads and, demonstrated that the micromotion correlates with the loss of torque of the abutment fixing screws.
The IA sets have misfit that allow the entry and exit of bacteria and bacterial fluids, which are responsible for contamination and inflammation of peri-implant tissues. In hexagonal connection systems, there is a vast literature affirming the occurrence of bacterial infiltration, as well as the attempt to seal these spaces [22,36–39]. In this sense, to meet the disadvantages of hexagonal connections, the Morse taper connection was developed, which would provide close contact between the walls of the cones with precise angles, allowing a torque by friction of the internal walls of the cone of the implant and thus reducing the GAP between abutment and implant [40,41]. However, in other authors it has been proven that even in Morse taper connections, infiltrations have occurred [42]. As a clinical result of bacterial infiltration, patients report a sensation of unpleasant odor and taste [43,44], this is due to bacterial colonization inside the implants, where anaerobic and facultative streptococci predominate, in addition to gram-positive anaerobic rods of the genera Propionibacterium, Eubacterium, Actinomyces and Gram-negative anaerobic rods such as Fusobacterium, Prevotella and Porphyromonas [42]. This fact may increase the risk of inflammation of perimplant tissues [22], and consequently compromises the stability of the implant [9,10]. The micro movements shown by the IA sets during chewing further increase this scenario.
The main limitation of the present in vitro study is represented by the design itself. Additional weakness might be considered the loads applied in a quasi-static system, without the totality of chewing movements, and in sets with a relatively small crown-implant ratio. However, in vitro studies are the only way to simulate clinical situations to check the behavior of materials without involving and/or affecting patients.
Conclusions
Within the limitations of the present in vitro study, the results obtained in the detorque test, after the application of loads with different intensity levels, we can observe that the MT group samples showed an increase in the torque values when compared to the initial torque values applied, unlike groups EH and IH, which present a decrease in torque initially applied to the fixing screws for two-piece abutments. In addition, the abutments of EH and IH groups showed a separation of the sets (microgap) at all levels of applied loads, unlike the sets of the MT group where this separation between the parts was not observed. A positive correlation was detected between the misfit and torque loss for the EH and IH groups.
Conflict of interest
The authors declare no conflict of interest.