
Abstract
BACKGROUND:
Control of the pharmaceutical manufacturing process and active pharmaceutical ingredients (API) is essential to product formulation and bioavailability.
OBJECTIVE:
The aim of this study is to predict tablet surface API concentration by chemometrics using integrating sphere UV-Vis spectroscopy, a non-destructive and contact-free measurement method.
METHODS:
Riboflavin, pyridoxine hydrochloride, dicalcium phosphate anhydrate, and magnesium stearate were mixed and ground with a mortar and pestle, and 100 mg samples were subjected to direct compression at a compaction pressure of 6 MPa at 7 mm diameter. The flat surface tablets were then analyzed by integrating sphere UV-Vis spectrometry. Standard normal variate (SNV) normalization and principal component analysis were applied to evaluate the measured spectral dataset. The spectral ranges were prepared at 300–800 nm and 500–700 nm with SNV normalization. Partial least squares (PLS) regression models were constructed to predict the API concentrations based on two previous datasets.
RESULTS:
The regression vector of constructed PLS regression models for each API was evaluated. API concentration prediction depends on riboflavin absorbance at 550 nm and the excipient dicalcium phosphate anhydrate.
CONCLUSION:
Integrating sphere UV-Vis spectrometry is a useful tool to process analytical technology.
Keywords
Introduction
Control of the pharmaceutical manufacturing process and active pharmaceutical ingredients (API) is essential to product formulation and bioavailability. FDA has issued ‘Guidance for Industry: PAT (process analytical technology)’, a regulatory framework for innovative development, manufacturing, and quality assurance of pharmaceuticals [1]. Predictive determination of pharmaceutical formulation tablet in product line is important for the control of final pharmaceutical production. Various spectroscopic methods such as Raman [2], mid-infrared [3], near infrared (NIR) [4], terahertz [5] are said to be non-destructive analytical tools. The pharmaceutical formulation includes API and several excipients, and their spectra also include overlapped peaks. Chemometric approaches to investigate multivariate spectral dataset are well accepted for PAT. For both inline and online real time monitoring systems, principal components analysis (PCA) and partial least squares (PLS) are commonly applied to predict pharmaceutical properties or for predictive quantifications.
An integrating sphere (IS) method on UV-Vis spectroscopy is widely used for qualitative analysis in material science and engineering [6,7]. An IS attachment encloses a well-shaped ceramic diffuse reflector with spherical reflecting surfaces in the interiors. The UV-Vis spectroscopy is inexpensive and widely used in laboratories. The reflection and absorption of samples can be investigated without sample destruction and complicated preprocessing; therefore, the IS method in the range of UV-Vis wavelength has potential application to PAT. However, there are few studies that have utilized analytical methods for the quantification of pharmaceutical formulations in the UV-Vis range.
In our previous study, we reported quantification and process analysis of pharmaceutical formulations using spectroscopic analyses such as NIR [8], Raman [9], ATR-MIR [10,11], powder X-ray diffraction [12,13], and liquid UV-Vis spectra [14], using chemometrics. The objective of the current study is to report simultaneous quantification of multiple component tablets by IS UV-Vis spectroscopy using chemometrics.
Materials and methods
Materials
Riboflavin (Ri), pyridoxine hydrochloride (Py), and magnesium stearate (MS) were purchased from Wako Pure Chemical Industries Ltd. (Osaka, Japan). Dicalcium phosphate anhydrate (Fujicalin SG: FJ®) was supplied from Fuij Chemical Ind. Co. Ltd., Tokyo, Japan.
The formulation powders were mixed by hand and ground with a mortar and pestle to obtain formulations containing different ratios of the APIs (Table 1). The crystal colors of Ri, Py, and FJ powders were yellow, white, and white, respectively (Supplementary Fig. S1). Mixed formulation powders were compressed into 7 mm diameter tablets at 6.0 MPa pressure. P16-B (RIKENKIKI Co. Ltd., Japan) compressor was applied for direct compression.
Formulation components of direct compress multi API tablets
Formulation components of direct compress multi API tablets
The Multi-API tablets of objective were named S2, S4, S6, and S8.
UV-Vis spectra were measured with an UV-Vis spectrometer (V-750, Jasco Co., Japan) equipped with an integrating sphere attachment (ISV-922, Jasco Co., Japan). The spectra were measured in the range of 300 to 800 nm at a resolution of 1 nm. The measurement calibration was performed using a standard white plate 095G (6708-H006A, Jasco Co., Japan). The tablets were sandwiched between the glass plate and the white pusher in the sample holder and measured.
Principal component analysis (PCA)
PCA is one of the chemometric methods for data mining. The objective of this analysis is to extract the variable of the analyzed dataset and reduce its dimension. In this study, the observed IS UV-Vis spectra can be regarded as a dataset. PCA decomposes the dataset matrix X into several principal components.
The spectral dataset (variable X) and API concentrations (variable Y) were regarded as multivariate chemical data matrix. The models were built using PLS based on two datasets ranging from 300 to 800 nm and from 500 to 700 nm, respectively. Furthermore, the IS UV-Vis spectra were preprocessed using standard normal variate (SNV) [16]. Cross validation was performed by selecting 20 segments. Kernel algorithm [17] was applied to construct PLS non-linear regression models. The predictive ability of calibration is most often evaluated from root mean square error of prediction (RMSEP).
The PCA and PLS regression were performed using the Unscrambler version 10.5.1 from CAMO (Computer Aided Modelling, Trondheim, Norway).
Results and Discussion
IS UV-Vis spectra of the prepared direct compressed tablets
Figures 1a–c show IS UV-Vis spectra of sample tablets. The spectral datasets were produced from three types of raw spectra (1a), SNV normalized spectra (b), and extracted spectra in the range of 500–700 nm (c).
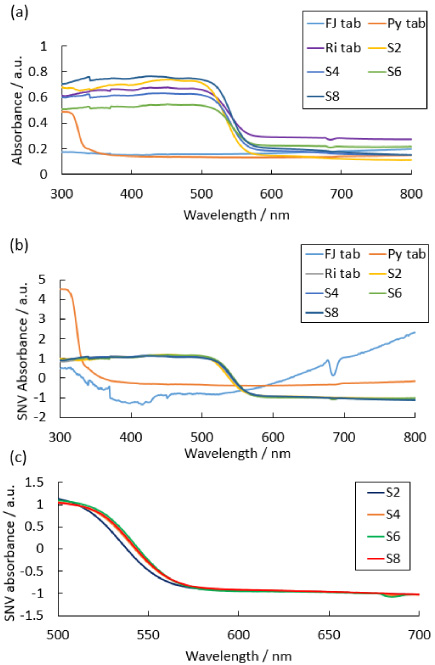
(a–c) IS UV-Vis spectra of prepared tablet; raw spectra (a), SNV normalized spectra (b) and extracted spectra from 500 to 800 nm (c).
Although the FJ tablet shows no significant peak in raw spectra, it displays a specific absorption peak at 690 nm in SNV normalized spectra. Py tablet has a pronounced absorbance peak in the UV range from 300 to 340 nm. Ri tablet has a UV-Vis absorbance ranging from 300 nm to 570 nm. The multiple component tablet groups S2, S4, S6, and S8 have absorbances in UV- Vis range from 300 to 570 nm with baseline drifts. The SNV normalization was successful in eliminating the baseline drifts. The visible range spectra were prepared to compare predictive accuracy in both the PLS regression models.
It has been reported [12] that combining PCA and PLS is effective for the evaluation of principal component number in the spectral dataset. The principal variation in the dataset can be explained by loadings, and cumulative explained variance. The dataset that was obtained from spectra with SNV normalization was evaluated by PCA. The cumulative explained variances on calibration and validation models are listed in Table 2.
Cumulative explained variance of PCA based on the SNV normalized spectra
Cumulative explained variance of PCA based on the SNV normalized spectra
The percentages of both models increased from PC1 through PC7. The cumulative explained variance percentage from PC1 through PC4 was over 99% as indicated in the calibration. Therefore, the variability in the dataset can be attributed to the four principal components.
Figures 2a and b show Loadings (a) and Score values (b) of PCA results based on IS UV-Vis spectra. The loadings expressing PC1 through PC4 indicate four formulation contents. The loading of PC1 shows the double sigmoidal spectra at 330 nm and 550 nm. On comparing the score value of variance, the PC1 can be classified into three types, pure Ri tablet, Py tablet, and other tablets. PC2 demonstrates a peak at 327 nm, an asymmetric positive peak at 558 nm, and a pronounced positive peak at 690 nm. The peak at 327 nm indicates maximum absorbance per wavelength in the Py tablet spectra. The loading of PC3 shows peaks at 300 nm, 552 nm, and 690 nm. The negative peaks from 300 nm to 340 nm and an asymmetrical positive peak at 552 nm suggests an inverse correlation on the pure Py tablet absorbance range, a pure Ri tablet of absorbance point and a pure FJ tablet spectrum. The loading of PC4 demonstrates positive loading from 300 nm to 340 nm, like the 1st differentiated pure Ri tablet spectra around 550 nm, and a negative 690 nm peak due to the pure FJ tablet.
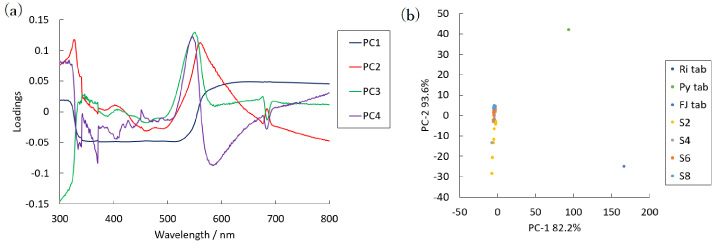
(a,b) Principal component analysis based on the normalized IS UV-Vis spectra; Loadings (a) and Scores (b).
From the PCA results, the absorbance wavelength ranges were observed to be 300–340 nm for Py crystal, 550 nm for Ri crystal, and 690 nm for di-calcium phosphate. In our previous study, the phase transformation kinetics of metastable calcium phosphate was evaluated by its MIR spectra with wavenumber extraction. The extraction indicated a correlation between metastable calcium phosphate and other components. Dataset extraction is a common analytical method to evaluate spectral datasets.
In order to predict Ri and Py weight percentages in the tablet, two PLS regression models were constructed based on SNV normalized spectral wavelength range 300–800 nm and its extracted wavelength range 500 nm to 700 nm. Both models were constructed based on the 45 spectra of S2, S4, S6, and S8 tablets.
Table 3 lists the cumulative percentages variance of calibration and validation models in the ranges of 300–800 nm and 500–700 nm, respectively. It can be noted that the percentage variance increases with PC number. The percentages of wide range spectral dataset were lower than those of the short-range dataset until PC4 in the calibration models. In the wide range dataset, no percentage decrease was observed in the validation models from PC1 through PC7 and no over fitting problem [19] was indicated. On the other hand, percentage decrease was found in the short-range dataset from PC6 through PC7. The values of PC7 suggested overfitting models in this dataset. There were 4 components to the prepared sample tablet. The model was regarded as 4 components.
Cumulative explained variance of constructed PLS regression models
Cumulative explained variance of constructed PLS regression models
Figures 3a–c show regression vector (RV) and X loading evaluation in the constructed PLS regression models for each API based on the wide range dataset. PC1 RV for Ri has significant peaks at 300–390 nm, 390–430 nm and 690 nm with sigmoidal curves on 510 nm. The specific sigmoidal curve was found at 410–440 nm, 490–530 nm, and 540–590 nm on loading of PC1. The loading of PC2 also displays similar spectra but the specific negative peaks at 680 nm and positive peak at 690 nm can be seen in the figure. RVs on PC2-PC4 indicate the relationship between RV for Ri and Py contents prediction (Fig. 3a) were inverse correlation on every PC. It can be noted that the inverse correlation of RVs was due to the relationship between Ri and Py. Fig. 3c shows X loadings on the PLS regression models.
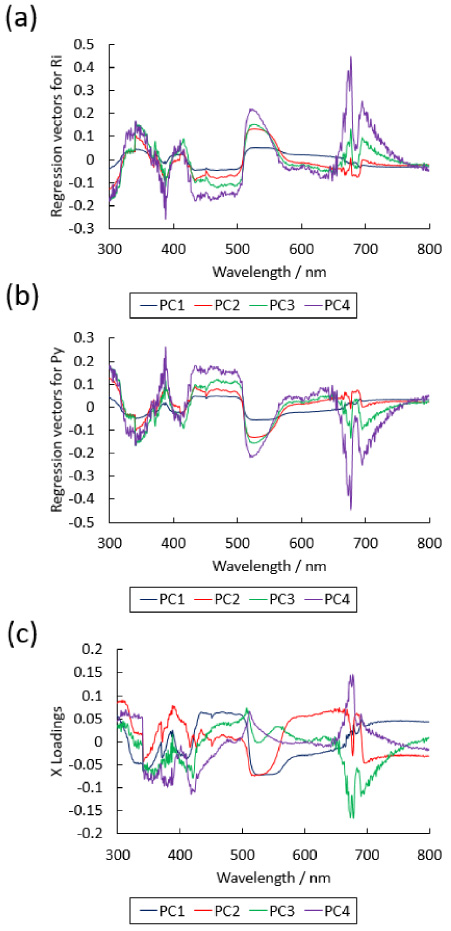
(a–c) Regression vectors and correlation loadings of constructed PLS regression models based on the normalized IS UV-Vis spectra from 300 to 800 nm; the models predict for Ri concentration (a) and Py concentration (b) and correlation loadings (c).
Figures 4a–c show the RV for Ri (a) and Py (b) and X loadings (c) based on the range of 500–700 nm dataset. The RVs for Ri and Py were found to be similar. The RV for Ri on PC1 shows sigmoidal intensity increase from 507 to 510 nm, and small negative peaks were observed at 680 nm and 690 nm. The RV for Ri on PC2 shows sigmoidal intensity increase from 500 nm to 520 nm. Both sigmoidal wavelengths ranging from 500 to 520 nm of RV were due to crossing point on the dataset spectra (Fig. 1c). A similar peak was indicated in the RV of PC3 and PC4. The root mean square values of PC3 and PC4 for Ri and Py based on their intensity were 0.9636 and 0.9638, respectively. The loading of PC1 shows sigmoidal intensity decrease from 500 to 520 nm, a negative value from 520 to 650 nm, and a specific negative peak at 680 nm. The loading of PC2 shows sigmoidal peak from 540 to 580 nm, a pronounced negative peak at 680 nm and a sigmoidal intensity decrease at 690–700 nm. The RVs and X loading evaluation indicate that there are specific correlation points between IS UV-Vis spectra and their API and excipients. The loading amount of excipients contains the same weight percentages and constant pressure in the prepared tablet. Further, the balance between excipients and loading API that affects tablet density and other physical parameters was considered. The effects of API amount on tablet surface condition and UV-Vis spectra reflectance and absorbance ability can be noted from the evaluation of RVs and loadings.
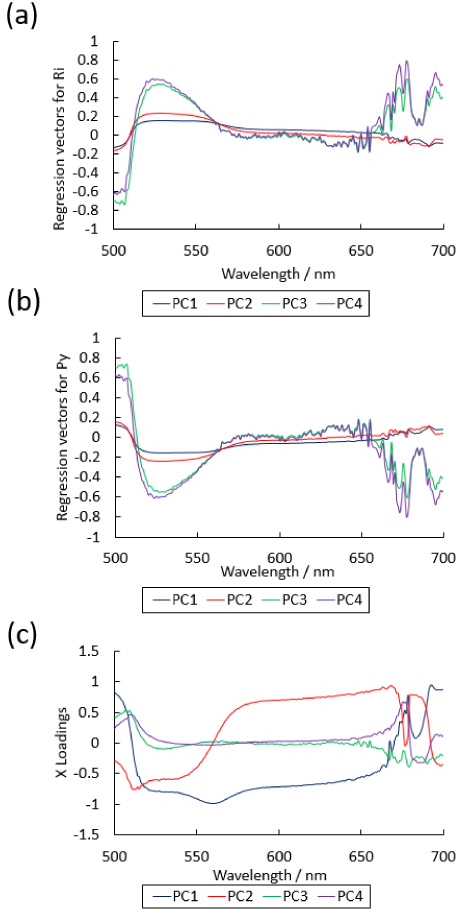
(a–c) Regression vectors and correlation loadings of models based on normalized IS UV-Vis spectra from 500 to 700 nm for Ri concentration wt% (a), Py concentration (b) and correlation loadings (c).
Table 4 lists the predictive parameters for Ri and Py weight percentages based on IS UV-Vis spectra from previously constructed models of two datasets of wide and short ranges (each 44 spectra) for both Py and Ri concentrations (w/w%).
The parameters of predicted Ri and Py concentration by constructed PLS models
The parameters of predicted Ri and Py concentration by constructed PLS models
RMSEP values decreased with an increase in PC number in all models. The values indicated that there are no over fitting models on constructed PLS regression models. From these predictive parameters, we determined that PC4 models are the most suitable for the predictive evaluation of component number.
Figures 5a–d demonstrates the predictive evaluation of Ri and Py weight percentages based on IS UV-Vis spectra of different ranges (44 spectra) on PC4. All the correlation values were found to be over 0.91.
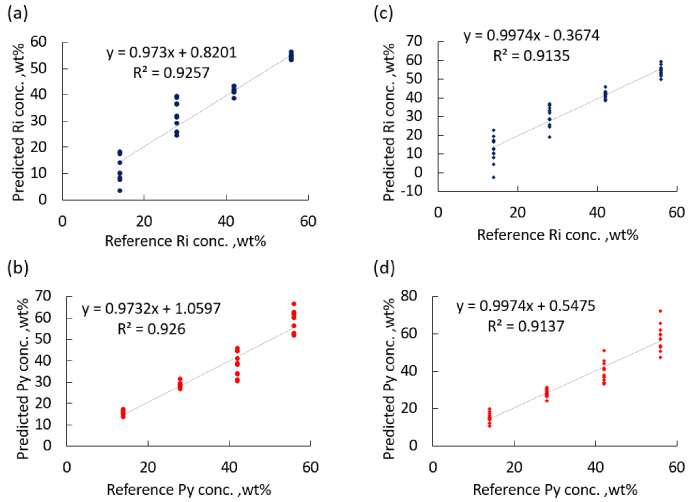
(a–d) The prediction accuracy based on the constructed PLS regression models on PC4; Ri (a) and Py (b) concentration wt% based on 300–800 nm wavelength dataset; Ri (c) and Py (d) concentration wt% based on spectra range of 500–700 nm.
Alcala et al. obtained near-infrared spectra and PLS to quickly analyze tablets and blends containing 0–5% ibuprofen [19]. The obtained spectrum was evaluated by the second derivative. It became clear that it was not suitable for analysis of low content. Luo et al prepared naproxen tablets and evaluated the process using PLS and near-infrared spectroscopy [20]. The tablets contained naproxen, starch, dextrin, carboxymethyl, sodium starch and magnesium stearate. They prepared 7 kinds of mixed ratio naproxen tablets. The near-infrared spectrum was evaluated between 10,000 cm−1 and 4000 cm−1. They conclude that the percent particle size distribution and average particle size were predictable by PLS. Nascimento et al enabled simultaneous quantification of dilopin and papaverine in solution using PLS regression and UV-vis spectrophotometer [21]. There are few studies that evaluated tablet drug concentrations in the visible light region using PLS regression. The IS UV-Vis spectroscopy measurement is a non-destructive and contact manner easement method. In our IS UV-Vis spectra study, the SNV normalization is effective for the predictive evaluation of multi API direct compressed tablets. In the diffuse reflectance measurement on NIR ranges, the spectral dataset includes multi-collinearity. The IS UV-Vis spectra including multi-collinearity were found in the PCA and PLS model evaluations. The attenuated total reflectance MIR and predictive reflectance NIR spectra measurements are commonly known to give penetration depth at each wavenumber. On the other hand, the IS UV-Vis absorption occurs only at a few nanometer scale surfaces. The controlling depth for a suitable sample is one of the most important factors in product measurement. It can be suggested that IS UV-Vis spectroscopy is possibly one of the most critical measurement methods in PAT. The measurement method is a surface sensitive method and is therefore suitable for tablet coating quantification, tablet whisker evaluation.
IS UV-Vis spectroscopy was applied to simultaneous predictive quantification for multi API direct compress tablet. The API contents were predicted from PLS regression models based on wide range IS UV-Vis spectra and short visible range spectra. The constructed PLS regression model evaluation from regression vector and loadings suggested the prediction was not only based on the absorbance of the API contents in the crystal but that was also based on surface conditions characterized by the excipients used in the compression. In conclusion, IS UV-Vis spectroscopy is a non-contact and non-destructive method and a great technique for PAT in the pharmaceutical product line.
Footnotes
Acknowledgements
This work was partly supported by JSPS KAKENHI (Grant numbers JP18H06115 and 19K21233). The authors would like to thank Prof. Satoru Goto, Dr. Yohsuke Shimada, Mr. Shota Shimizu and Mr. Daishi Nawa, Faculty of pharmaceutical Sciences, Tokyo University of Science. The dicalcium phosphate anhydrate powder of Fujicalin® SG was supplied by Fuji Chemical Industries Co., Ltd, Tokyo, Japan.
Conflict of interest
The authors declare that they have no conflict of interest.