
Abstract
BACKGROUND:
Acute liver failure is one of the most intractable clinical problems. The use of bioartificial livers may solve donor shortage problems. Human umbilical cord mesenchymal stem cells (hUCMSCs) are an excellent seed cell choice for artificial livers because they change their characteristics to resemble hepatocyte-like cells (HLCs) following artificial liver transplantation.
OBJECTIVE:
This study aimed to determine whether the immunological characteristics of hUCMSCs are changed after being transformed into hepatocyte-like cells.
METHODS:
HUCMSCs were isolated by the adherent method. The following hUCMSC surface markers were detected using flow cytometry: CD45, CD90, CD105, CD34, and octamer-binding transcription factor 4 (OCT-4). Functional detection of adipogenic differentiation was performed. The hUCMSCs were cultured in complete medium (control group) or induction medium (induction group), and flow cytometry was used to detect cell surface markers. Peritoneal lavage fluid was collected after intraperitoneal injection of 1 × 10⁶ cells/mouse over 40 minutes. The leukocyte count, labeled CD45, CD3, CD4 and CD8 antibodies, and flow detection of T lymphocyte subsets were determined using the peritoneal lavage fluid.
RESULTS:
Using phenotypic and functional identification, hUCMSCs were successfully isolated using a two-step induction method. The surface markers of the hUCMSCs cells changed after HLC induction. In vivo immune results showed that hUCMSCs and HLsC induced leukocyte production.
CONCLUSION:
Hepatic induction of hUCMSCs changes their cell surface markers. Both HLCs and hUCMSCs cause leukocytosis in vivo, but the immune response induced by HLCs is slightly stronger.
Introduction
Acute liver failure is an intractable clinical problem that has an extremely high mortality rate [1]. The development of bioartificial livers will hopefully solve the donor shortage problem. Bioartificial livers are biological devices that use scaffold materials and have little or no immunogenicity to seed cells, such as stem cell-like hepatocytes. These cells can replace or partially replace liver function [2–6]. Mesenchymal stem cells differentiate into a wide range of cells, including adipoblasts and osteoblasts, and have multi-directional differentiation potential. Fu et al. [7] found that umbilical cord mesenchymal stem cells increased immunogenicity after osteogenic differentiation. However, another study showed that the transformation of umbilical cord mesenchymal stem cells into male reproduction-like cells did not change immunogenicity in vitro [8]. The differences in immunogenicity results after induction of differentiation could be caused by different methods of induction or could result from differences in the target cells induced. The immunogenicity of human umbilical cord mesenchymal stem cells (hUCMSCs) after liver-like differentiation in vivo and in vitro has rarely been reported. Therefore, this study aimed to evaluate the in vivo immunogenicity of induced mature cells to lay a theoretical foundation for subsequent transplantation.
Materials and methods
Preparation of hUCMSCs
We isolated and cultured hUCMSCs using the adherent method. The umbilical cord was disinfected and sterilized in 75% alcohol, and then rinsed three times in saline solution. Ligation at both ends of the umbilical cord was then removed, and the cord was cut into segments of 3–5-cm long. The segments were soaked in 4 °C phosphate-buffered saline (PBS), while the arteries (n = 2) and vein (n = 1) were removed. The tissues were then washed twice in PBS and cut into pieces approximately 1 mm in length. The tissue blocks were placed in six-well plates and incubated at 37 °C in a 5% CO2 incubator for 30 minutes. Dulbecco’s modified Eagle medium (DMEM; 37 °C, 2 mL) was added to the six-well plates and refreshed every 3 days. When the confluence of cells reached 80%, it was subcultured.
Identification of hUCMSCs
The cell phenotype was determined by flow cytometry. Briefly, P3 generation cells were collected, and the fluorescence intensity of each marker was analyzed by monochromatic labeling for CD45, CD90, CD105, CD34, and octamer-binding transcription factor 4 (OCT-4). Osteogenic differentiation was then induced. Briefly, hUCMSCs of the P3 generation were collected and inoculated in 24-well plates (1 × 10⁴ cells/well). After 48 hours of adherent growth, an osteogenic induction reagent (dexamethasone 1 μmol/L, β-glycerol phosphate 10 nmol/L, and vitamin C 0.05 nmol/L) was added to induce osteogenic differentiation for 28 days. Alizarin red staining was performed, and the plates were observed under a microscope and photographed. Adipogenic differentiation was then induced. Briefly, hUCMSCs of the P3 generation were collected and inoculated in 24-well plates (1 × 10⁴ cells/well). After 48 hours of adherent growth, an osteogenic induction reagent was added (dexamethasone 1 μmol/L, rifampicin-1-1 methylxanthine 0.5 μmol/L, and indomethacin 100 μmol/L). The cells were cultured for 28 days. Oil red O staining was then performed, and the plates were observed under a microscope and photographed.
Liver orientation induced differentiation of hUCMSCs
To differentiate hUCMSCs from hepatocyte-like cells (HLCs), we performed in vitro pre-culture using staged cytokine induction. Briefly, after laying the plate, serum-free pretreatment medium (20 ng/mL epidermal growth factor and 10 ng/mL basic fibroblast growth factor [bFGF]-DMEM) were added to the cells when the cell fusion rate reached 80%–90%. After 2 days, the supernatant was discarded, and hepatocyte differentiation induction solution (20 ng/mL hepatocyte growth factor, 10 ng/mL bFGF, and 0.61 g/L nicotinamide) was added. The differentiation induction medium was cultured for 5 days and changed three times a week. The maturation induction medium contained 20 ng/mL hepatocyte growth factor, 10 ng/mL bFGF, and 0.61 g/L nicotinamide in DMEM. The cells were cultured in this medium for 7 days. The hepatocyte maturation induction medium contained 20 ng/mL OSM, 10 μmoL/L dexamethasone, and 10 μL/mL 1 × ITS + Premix, and was cultured for 14 days and refreshed three times a week. The control group was cultured in complete medium without the inducing factor for 21 days and changed three times a week.
Identification of HLCs
After liver-like induction for 21 days, the cell morphology of the induced HLCs was photographed and recorded. Differences between the induced hUCMSCs group and the control hUCMSCs group were observed by periodic acid–Schiff (PAS) staining.
HLC cell marker analysis
The cell surface markers CD34, CD45, CD90, CD105, and OCT-4 were analyzed by the paired t-test to compare their mean fluorescence intensity before and after induction.
In vivo HLC immunogenicity analysis
HLCs and hUCMSCs were collected, and the cell concentrations were adjusted to 2 × 10⁶ cells/mL in PBS. Female BALB/c mice (n = 25) were randomly divided into the induced group (I, 10 mice), control group (C, 10 mice), and placebo group (P, 5 mice). The mouse groups received an intraperitoneal injection of 0.5 mL HLC suspension (induced group), 0.5 mL hUCMSC cell suspension (control group), or 0.5 mL PBS (placebo group). After 4 hours, peritoneal lavage fluid was collected, and aseptic PBS flushing was performed (5 mL/mouse, centrifugation at 1400 rpm for 5 minutes). The supernatant was discarded, the cells were re-suspended in PBS, and the leukocyte count was analyzed. One-way analysis of variance was performed to compare leukocyte counts in each group. Post-hoc testing was performed using the Bonferroni test. The t-test was used to compare the percentages of CD45, CD3, CD4, and CD8 between the groups.
Results
Isolation and culture of hUCMSCs
The isolated hUCMSCs were consistent in shape to that of typical hUCMSCs. P0 cells were irregular and fusiform (Fig. 1A, B), and P3 cells were regular and fusiform (Fig. 1C, D). The homogeneity of the cells was good.
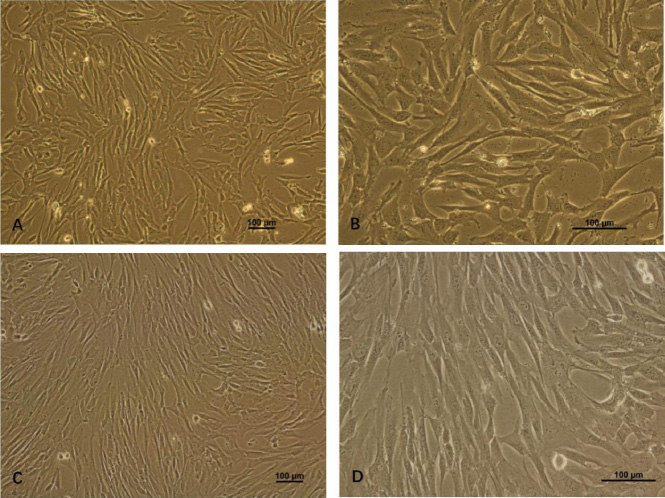
Morphological observation of hUCMSCs in different times of passage. A, B: Morphological features of P0 hUCMSCs (scale bar = 100 μm). C, D: Morphological features of P3 hUCMSCs (scale bar = 100 μm).
The cell surface markers of P3 cells were detected by flow cytometry (Fig. 2). P3 cells showed high expression of CD90 and CD105 (Fig. 2A, B), low expression of CD34 and CD45 (Fig. 2C, D), and high expression of OCT-4 (Fig. 2E). The percentages of CD90, CD105, CD45, CD34, and OCT-4 expression are shown in Fig. 2F (n = 50).

Surface markers of hUCMSCs were detected by flow cytometry. A: High expression of CD90. B: High expression of CD105. C: Low expression of CD34. D: Low expression of CD45. E: High expression of OCT-4. F: Quantitative results of marker expression. Date are presented as mean ± standard deviation, n = 50.
Obvious calcium nodules were observed after alizarin red staining in the induction group (Fig. 3A). No obvious calcium nodules were observed after alizarin red staining in the control group (Fig. 3B). With regard to adipogenic differentiation, obvious oil droplets were observed in the cells of the induced group after oil red O staining (Fig. 3C). No oil droplet aggregation was observed in uninduced hUCMSCs stained with oil red O (Fig. 3D).
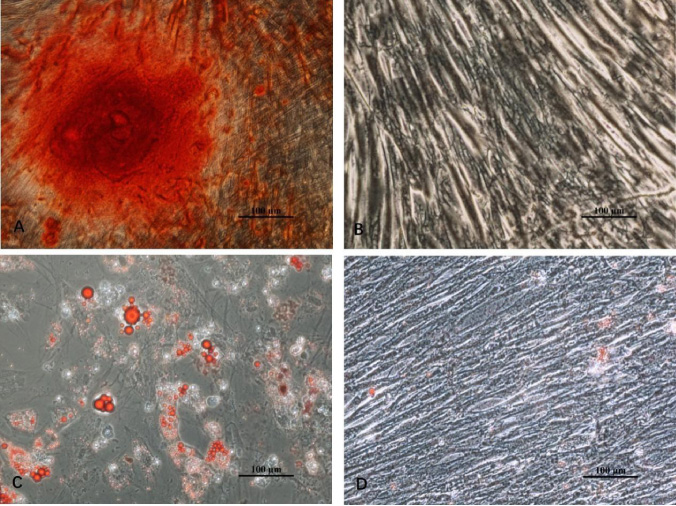
Images of osteogenesis and induction of adipogenesis. A: Calcium nodules can be seen after the induction of osteogenesis (scale bar = 100 μm). B: No calcium nodules can be seen in the control group (scale bar = 100 μm). C: In the adipogenic induction group, fat droplets can be seen inside the cells (scale bar = 100 μm). D: No fat droplet has formed in the control group (scale bar = 100 μm).
After 21 days of hepatogenic differentiation, the morphology of the cells changed from a long fusiform shape to an irregular polygonal shape (Fig. 4). PAS staining showed a larger number of sugars in the induced group (purplish-red stain; Fig. 5C) compared with the control group (Fig. 5B, D).

Change in morphology of hUCMSCs after induction treatment. A: The hUCMSCs in the control group still show a long spindle shape (scale bar = 100 μm). B: The induced cells were deformed from a long spindle shape to a polygon at 21 days (scale bar = 100 μm).
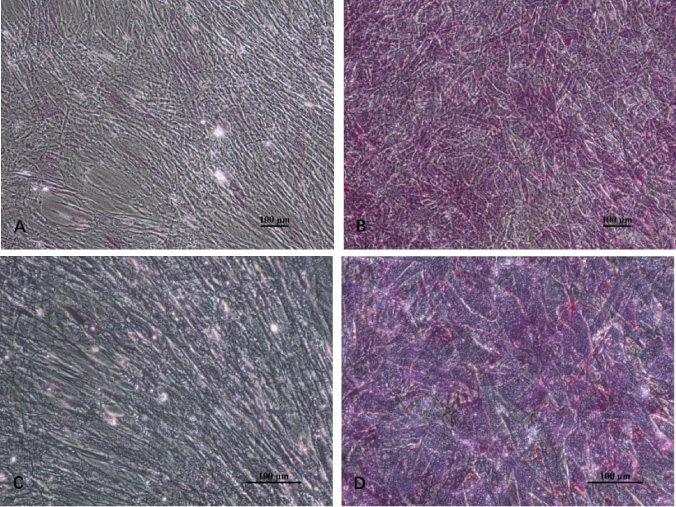
PAS staining (scale bar = 100 μm). A, C: PAS staining is not present in the control group. B, D: The induced group is strongly positive for PAS staining (scale bar = 100 μm).
The mean fluorescence intensity of hUCMSCs cell surface markers was detected by flow cytometry before and after induction (Fig. 6). The mean fluorescence intensity of CD105, CD90, and OCT-4 in the control group was 20.37 ± 16.55, 90.2 ± 40.99, and 11.61 ± 9.98, respectively. The mean fluorescence intensity of these markers in the induction group was 8.12 ± 6.58, 47.17 ± 10.42, and 9.75 ± 6.61, respectively. Paired t-test analysis showed no significant differences in these markers between the control group and the induction group. There was no change in CD34 or CD45 between before and after induction (2.12 ± 1.07 and 1.91 ± 0.77 in the control group and 1.92 ± 1.25 and 1.85 ± 1.14 in the induction group, respectively). The expression patterns of CD34 and CD45 were low (Fig. 6).
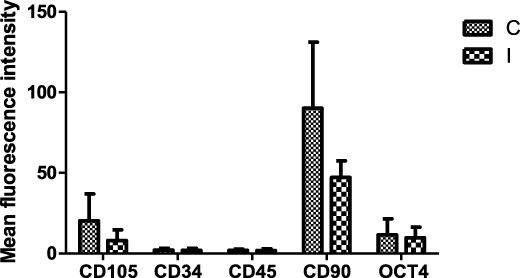
Comparison of the mean fluorescence intensity of cell surface markers before and after induction. The data are presented as mean ± standard deviation (n = 3).
The leukocyte count was significantly lower in the placebo group than in the control group and the induced group, but there was no significant difference between the control group and the induced group (Fig. 7). The positive percentages of CD3, CD4, CD8, and CD45 in the control group were 2.74 ± 0.81, 21.3 ± 2.71, 2.84 ± 2.21, and 95.52 ± 3.90, respectively. The positive percentages of CD3, CD4, CD8, and CD45 in the induction group were 2.77 ± 1.71, 19.76 ± 6.19, 5.70 ± 1.88, and 80.32 ± 16.62, respectively. There was no significant difference in CD3 or CD4 expression between the induction group and the control group (Fig. 8). CD8 expression in the induction group was significantly higher than that in the control group (P < 0.01; Fig. 8).
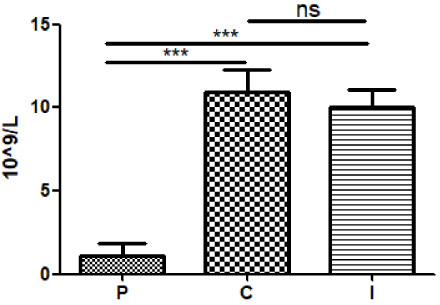
Graph of the white blood cell count in the three groups. The white blood cell count in the P group was significantly lower than that in the C and I groups. Data are presented as mean ± standard deviation. ***P ≤ 0.01. P: placebo; C: control; I: induction.
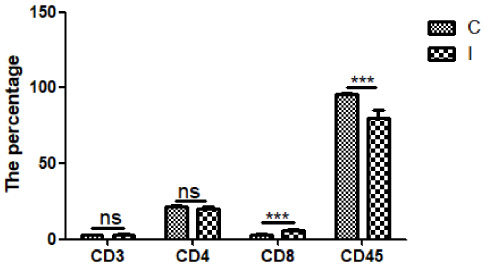
Flow cytometric results of peritoneal lavage fluid. Data are presented as mean ± standard deviation. ***P ≤ 0.01.
In this study, cultured hUCMSCs were fusiform in shape, and were detected using flow cytometric analysis with the surface markers CD90, CD105, CD34, CD45, and OCT-4. Flow cytometry showed similar characteristics of hUCMSCs to those reported in previous studies. These findings indicate that isolated and cultured hUCMSCs can retain differentiation abilities of adipogenesis and osteogenesis.
Previous studies in our laboratory showed that differentiation of hUCMSCs could be induced using a two-step method [9]. The morphology of induced HLCs changed from a long fusiform shape to an irregular polygonal shape. This finding is consistent with previous reports of HLC morphology [10,11]. In our study, PAS staining showed greater glycogen accumulation in the induced group compared with control group, which indicated that HLCs initially functioned as hepatocytes.
CD90 and CD105 are stem cell surface markers. A high expression of CD90 and CD105 indicates that the cells are dry. In this study, CD90 and CD105 expression was lower in HLCs compared with hUCMSCs, but this difference was not significant. The reason for this finding may be because of the small sample size and variations in the effect shown by individuals following induction. Regardless, this decreased trend suggested that the induction group was in a state of differentiation and desiccation [12,13].
In this study, intraperitoneal injection resulted in a higher leukocyte number in the abdominal cavity in the control and induction groups compared with the placebo group. However, there was no significant difference in the number of leukocytes between the control and induction groups. This finding suggests that hUCMSCs have low immunogenicity in vitro, but they can also cause an immune response in vivo. HLCs and hUCMSCs have an increased leukocyte count, but they show some differences in composition, and the percentage of CD3+ cells is low. However, the percentages of CD4+ and CD8+ cells are relatively high in HLCs and hUCMSCs, and there is a significant difference in CD8+ cells between these two groups of cells. This suggests that these cells are composed of non-T cells (such as natural killer cells), and that the early response is mainly non-specific immunity. However, in this study, there was a significant difference in the reaction of CD8+ cells, and the reaction of the induced group was more severe than that in the control group.
Conclusion
HUCMSCs can be transformed into HLCs using a two-step method. This induction process changes cellular surface markers and is an indicator of HLC differentiation as the stemness of stem cells decreased. Immune experiments in vivo suggest that HLCs and hUCMSCs can cause an immune response, but the immune response caused by HLCs is slightly stronger than that by hUCMSCs. However, whether the use immunosuppression allows smoother transplantation of HLCs and whether it creates immune tolerance after implantation are unknown. These issues need to be addressed in a follow-up study.
Footnotes
Acknowledgements
The authors thank Tamara Leahy, PhD, from Liwen Bianji (Edanz) (![]() ) for editing the English text of a draft of this manuscript. This work was supported by research grants by Kunming Science and Technology Bureau (grant number: 2019-02-07-001) and The Affiliated Calmette Hospital of Kunming Medical University (grant number: 2020SYZ-Z-036).
) for editing the English text of a draft of this manuscript. This work was supported by research grants by Kunming Science and Technology Bureau (grant number: 2019-02-07-001) and The Affiliated Calmette Hospital of Kunming Medical University (grant number: 2020SYZ-Z-036).
Author contributions
LL and ZH were the chief investigators. YY was responsible for most of the experimental work and contributed to writing the manuscript. ZG, SL, and JS contributed to the cellular experiments. YW, CY, and SF assisted in the animal experiments. YW, LM, and JJ assisted in data collection. All co-authors approved the final version to be published and agreed to be accountable for all aspects of the work.
Conflict of interest
The authors declare that they have no competing interests.
Ethical approval
The study was approved by the Ethics Committee of Calmette Hospital affiliated to Kunming Medical University.