
Abstract
BACKGROUND:
Imaging of cells and cellular organelles has been of great interest among researchers and medical staff because it can provide useful information on cell physiology and pathology. Many researches related to collective cell migration have been established and leader cells seem to be the ones that regulate the migration, however, the identification of leader cells is very time-consuming.
OBJECTIVE:
This study utilized computer vision with deep learning to segment cell shape and to identify leader cells through filopodia.
METHODS:
Healthy Madin–Darby Canine Kidney (MDCK) cells cultured in a Polydimethylsiloxane (PDMS) microchannel device allowed collective cell migration as well as the formation of leader cells. The cells were stained, and cell images were captured to train the computer using UNet++ together with their corresponding masks created using Photoshop for automated cell segmentation. Lastly, cell shape and filopodia were filtered out using Filopodyan and FiloQuant were detected.
RESULTS:
The segmentation of cell shape and the identification of filopodia were successful and produced accurate results in less than one second per image.
CONCLUSIONS:
The proposed approach of image analysis would be a great help in the field of cell science, engineering, and diagnosis.
Introduction
Cancer has long been claimed to be one of the leading causes of death in the world. To develop medicines or treatments, various technologies have been utilized. Compared to the past, current medical technologies have reached a point where we can observe individual cells or even further smaller scale under various microscopy technologies. With studies of the behavior of cells, many diseases and injuries including cancer that was determined to be impossible to be treated in the past became possible today. Among such studies, one of them is collective cell migration, which is described as the movement of a group of cells with collective behavior towards the environment and among each other. It is the main pattern of locomotion of collective cells that contribute to cancer spreading and wound healing [1]. Due to that reason, many researches have been carried out to characterize the behavior of collective cell migration [2–4]. It is observed that special kinds of cells formed at the leading edges of cells during collective cell migration. They are called leader cells. They act as leaders to the group of cells and are able to regulate the migration [5]. Thus, researchers have carried out experiments revolving around leader cells to investigate if their existence is the main reason for collective cell migration. Solving this enigma allows us to take one step forward to develop the medicines that can control cancer spreading or wound healing via the identification of leader cells, which helps to reduce death.
To study leader cells in collective cell migration, an affirmative issue is the identification of leader cells themselves. Thus, the characteristics that can distinguish leader cells from the other cells called follower cells need to be determined. One of those determinants is the fact that it has been observed that leader cells possess distinctively large amounts of proteins from the Rho family of GTPases such as Rac1 and its downstream to compare to the follower cells [6]. It is found that in protein staining, the signal of those proteins is stronger at the leading edges. Although identifying leader cells by protein staining provide a clear result, the staining process itself is considered invasive and might already have disturbed the behavior of collective cell migration. An alternative approach to identify leader cells can be established by detecting filopodia which are thin, actin-rich plasma-membrane protrusions that frequently extend from leader cells [7].
To date, most imaging technique to characterize cells and cellular organelles on their fluorescent images has been manually performed, however, the manual procedure is complicated and time-consuming. For high-throughput and automatic detection analyses on cell samples, artificial intelligence (AI) has recently been introduced. In this study, a more direct, non-invasive method is thus proposed to detect cell shape and identify leader cells through filopodia, a piece of basic information from leader cell morphology, more efficiently, which is utilizing computer vision with deep learning in a faster, more organized manner. Collective cell migration of Madin–Darby Canine Kidney (MDCK) cells was observed in a Polydimethylsiloxane (PDMS) microchannel device.
Materials and methods
Cell culture
Adult Madin–Darby Canine Kidney (MDCK) cells (NBL-2, ATCC, USA) were cultured with Dulbecco’s Modified Eagle’s Medium (DMEM, Sigma-Aldrich, USA) supplemented with 10% Fetal Bovine Serum (FBS), 1% penicillin, and streptomycin (Life Technologies, USA) at 37 °C and 5% CO2 in an incubator. Passaging is done at a 1 to 6 ratio with 0.25% Trypsin-EDTA solution (Invitrogen, USA).
Microchannel fabrication
To fabricate a PDMS microchannel device to observe collective cell migration, first, a negative photoresist SU-8 3035 (MicroChem, USA) mold on a silicon wafer substrate (Matsuzaki Seisakusyo, Japan) that served as a patterned template for PDMS casting was prepared using the standard photolithography process. A PDMS (Sylgard 184, Dow Corning, USA) with a mixing ratio of 10:1 was poured slowly into the microchannel silicon mold and baked in an oven at 110 °C for 20 min. The PDMS casting was then peeled off from the mold and inlets and outlets of the channels were created. After sterilizing overnight, the PDMS casting was bonded to a 35 mm glass-bottom culture dish by a plasma oxidation treatment. The fabricated PDMS microchannel device is shown in Fig. 1. Fibronectin was being flowed into the microchannels through inlets. Cells were seeded to all the inlets and migrated inside the microchannels.
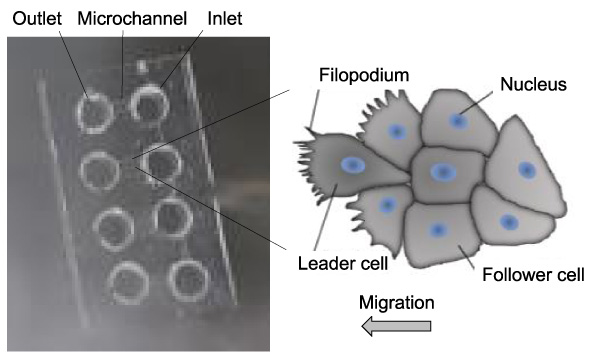
PDMS microchannel device fabricated by the standard photolithography and soft lithography processes and a schema of cells migrating in the microchannels.
Actin filaments and nuclei were stained with Alex Flour 488 Phalloidin (Invitrogen, USA) and Hoechst 33342 (Invitrogen, USA), respectively. Cells were fixed in 4% Paraformaldehyde Phosphate Buffer Solution (Wako Pure Chemical, Japan) for 30 min and were washed by PBS twice, followed by permeabilization with 0.1% of Triton X-100 (Merck Millipore, Germany) diluted in PBS for 15 min. After rinsing with PBS twice, cells were stained with three units (15 μL) of Alex Flour 488 Phalloidin diluted in 0.6 ml of PBS for 1 h, followed by 2 drops of Hoechst 33342 diluted in 2 ml of PBS for another 1 h.
Fluorescent imaging
An inverted microscope (IX81, Olympus, Japan) with an epifluorescence system (U-RFL-T, Olympus, Japan) was used. The fluorescent-stained specimen was placed on the stage of the microscope, excited by light filtered by interference blue filter (U-MNIBA3, Olympus, Japan) and ultraviolet filter (U-MNUA2, Olympus, Japan) for actin filaments and nuclei, respectively, and observed with UPlanSApo 60× oil lens. The cell images were captured using a digital CCD camera (ORCA-R2, Hamamatsu, Japan).
Deep learning and computer vision
To create a dataset for cell segmentation training, every cell image needs to have a corresponding mask. To create the mask, the background was erased without disturbing the cells. The area of the cells was selected carefully and filled with white pixels (pixel value 255) while the background was filled with black pixels (pixel value 0) using photo editing software Photoshop (Adobe, USA).
Cell segmentation training was done by using a deep learning program, UNet++ [8] that was written in Python. For hardware requirements, a computer installed with a CUDA-enabled Nvidia GPU needed to be prepared. For software requirements, Anaconda, a package that included Python and all basic supporting libraries, and PyTorch, a library that was used in computer vision needed to be installed. The code for cell segmentation training was run using Python.
To identify filopodia, a plugin of Fiji, Filopodyan was used. Filopodyan could be used to identify and measure filopodia as long as the parameters and criteria were set. Small particles or noises that were not filopodia were filtered using a batch filter.
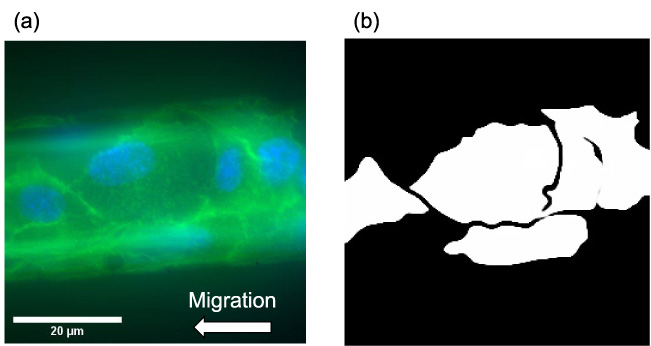
(a) Fluorescence staining of actin filaments (green) and nuclei (blue) of cells migrating in the microchannel and (b) the corresponding black and white mask.
Cell segmentation
A fluorescence image of actin filaments and nuclei of cells migrating in the microchannel is shown in Fig. 2(a) while the corresponding black and white mask used for cell segmentation is shown in Fig. 2(b). One hundred fluorescence images of size 256 × 256 were tested with the model trained by UNet++ of 9.16M parameters. Although the cell nuclei also showed strong edges, the computer can even learn to ignore that through deep learning. As a result, only the borders of cells were well segmented.
By using this training dataset of fluorescently stained MDCK cell images, a migrating MDCK leader cell was well segmented with Intersection over Union (IoU) of 99%, as shown in Fig. 3(a). For comparison, the same MDCK leader cell was also segmented using a human breast cancer (MCF7) cell dataset (BBBC021, Broad Bioimage Benchmark Collection). As shown in Fig. 3(b), the result for the crossed model segmentation only showed IoU of 10% and the filopodia were less observed. This result indicated that it was not adequate to segment cells with a model trained using other types of cells.
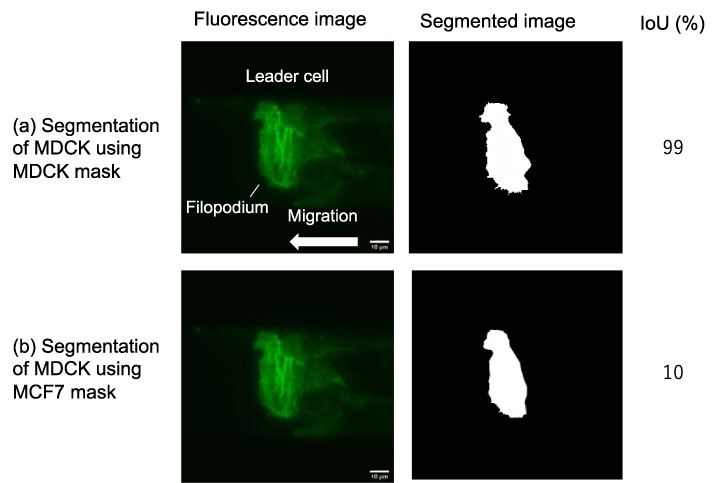
(a) A MDCK leader cell was segmented using an MDCK mask with an IoU of 99%, while (b) the same MDCK leader cell was segmented using an MCF7 mask with IoU of 10%. Intersection over Union (IoU) is an evaluation metric used to measure the accuracy of an object detector on a particular dataset, giving the ratio of the overlapping area of ground truth and predicted area to the total area.
The identification of leader cells by filopodia was performed on the main dataset using MDCK cells as the training model. Firstly, Filopodyan segmented filopodia from the cell body. As shown in Fig. 4(a), there was a huge amount of noise along with filopodia. Next, filters were applied to filter out the noises to identify where the filopodia actually were. The software identified 17 filopodia (Fig. 4(b)). The length of the identified filopodia was 0.96 ± 0.13 μm as summarized in Table 1. The software Filopodyan could identify large numbers of filopodia rapidly.
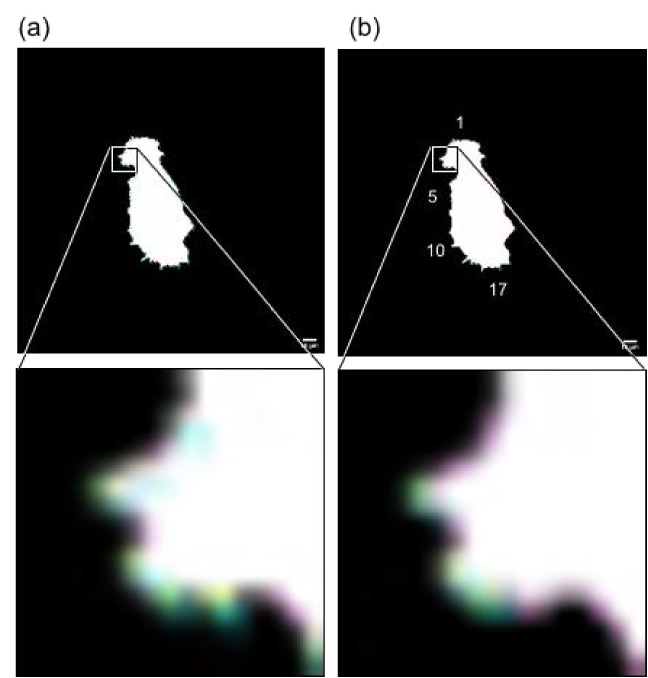
(a) Segmentation of filopodia before noise filtering and (b) identification of filopodia after noise filtering. The zooming in images clearly showed a reduction of the noise from (a) to (b). The yellow color represents the base, the blue the body, and the green the tip of the filopodia.
The length of filopodia of an MDCK leader cell obtained by computer vision
Collective cell migration is a process by which cells relocate from one part of the body to another by taking various motions but happens to a group of cells that retain cell–cell contacts with coordinated movement [1]. It possesses unique behavior by which the cell-environment interaction and cell–cell communication occur in a collective manner and the movement of the group of cells occurs simultaneously [9]. The cell migration can occur either in a cohesive group of cells or cells connected by cell–cell adhesion [10,11]. During the cell migration, cells go through various changes in their cytoskeletal structure [12]. During collective cell migration, it is observed that there is an existence of special kinds of cells, called leader cells regulating the movement. Leader cells acquire distinctive morphology and motility, in particular exhibiting a lot of filopodia at their front edge towards the direction of migration, however, characteristics of leader cells have still remained unclear. Leader cells possess finger-like structures protrusion, filopodia.
In this study, a PDMS microchannel device was fabricated to observe collective cell migration, and filopodia were segmented by using computer vision with deep learning to the need for faster leader cell identification in collective cell migration. Firstly, masks were created using Photoshop, and UNet++ was used to train a model for future segmentation. As shown in Figs 2 and 3(a), UNet++ could produce good segmentation results with IoU of 99% providing the cell images are clear. After the segmentation, Filopodyan was used to identify filopodia.
When the MDCK leader cell was segmented using another type of cell, MCF7 mask, the IoU dramatically decreased from 99% in Fig. 3(a) to 10% in Fig. 3(b), showing much less accuracy of segmentation. This result strongly confirms the validity of the proposed segmentation approach.
As shown in Fig. 4, the segmentation of filopodia could be utilized to identify leader cells. The identification for one hundred images was done in just a few seconds and around 90% of the filopodia were accurately detected after noise filtering. Since the level of noise is different in different conditions, the parameters for the segmentation and filters need to be fine-tuned.
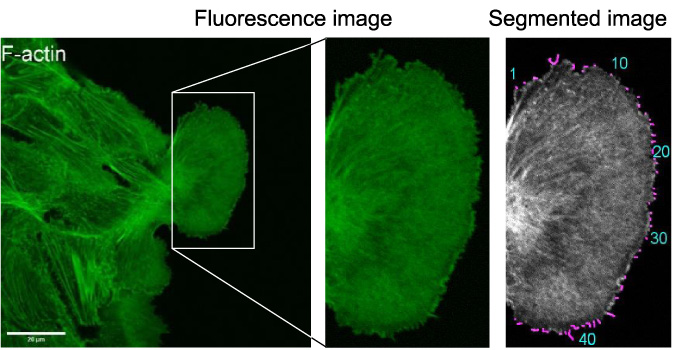
Fluorescence image of actin filaments of MDCK cells and filopodia (colored in magenta) expressed on a leader cell manually segmented using FiloQuant.
To compare the proposed segmentation method using computer vision with a manually-operated segmentation procedure, FiloQuant, a modifiable tool for semi-automated detection and quantification of filopodia for their length and density was employed on a fluorescence image of actin filament structures of MDCK cells in a separate study. Filopodia expressed on a leader cell was successfully segmented as shown in Fig. 5, with their number of 40 and their length of 5.08 ± 0.75 μm as summarized in Table 2. From the comparison, it was confirmed that the proposed segmentation method using computer vision with deep learning could sufficiently produce the successful segmentation accuracy compared to the manually-operated segmentation procedure using FiloQuant, and thus could be useful to identify leader cells through segmentation of filopodia.
The length of filopodia of an MDCK leader cell obtained by a manually-operated segmentation procedure
Our primary automated segmentation method, UNet ++, can be used on all types of cell microscopy, macro-sized MRI, and CT-type medical images to assist clinicians in rapidly diagnosing disease and injury, provided the object’s ground truth images are adequately represented. However, there are is a limitation of this study. Filopodyan and FiloQuant were used in the second stage to identify filopodia. Despite its significant benefits, FiloQuant and Filopodyan do have certain drawbacks. FiloQuant and Filopodyan will be unable to detect individual filopodia when using noisy or low-resolution images. When using noisy images, a noise could wrongly be considered as a single filopodium because the batch of image noises can be close in size to a single filopodium. For that reason, all images must be filtered before taking filopodia detection.
Leader cells in collective cell migration were successfully identified by segmentation of filopodia with high accuracy, IoU of 99%, using computer vision with deep learning program UNet++. The process was very fast at average less than one second per image. The proposed approach of detection of leader cells would be a great help for better understanding collective cell migration in physiology and pathology.
Footnotes
Conflict of interest
None to report.