
Abstract
BACKGROUND:
Advances in bone tissue engineering offer novel options for the regeneration of bone tissue. In the current clinical treatment, the method of accelerating bone tissue regeneration rate by promoting early angiogenesis has been widely accepted.
OBJECTIVE:
This study aimed to develop a long-acting slow-release system using the pro-angiogenic drug tetramethylpyrazine (TMPZ) and pro-osteogenic drug icariin (ICA), which can be administered locally to achieve the sequential release of TMPZ and ICA for better clinically efficiency in the treatment of bone defects.
METHODS:
This study aimed to prepare microspheres with a core-shell structure using two polymers, poly lactic-co-glycolic acid and silk fibroin, by coaxial electrostatic spraying. Based on the therapeutic model for bone defects, the pro-angiogenic drug TMPZ and pro-osteogenic drug ICA were encapsulated in the shell and core layers of the microspheres, respectively. Subsequently, TMPZ and ICA were released sequentially to promote early angiogenesis and late osteogenesis, respectively, at the site of the bone defect. The optimal preparation parameters for preparing the drug-loaded microspheres were identified using the univariate controlled variable method. Additionally, microsphere morphology and core-shell structure, such as physical properties, drug-loading properties, in vitro degradation and drug release patterns, were characterised using scanning electron microscope and laser scanning confocal microscopy.
RESULTS:
The microspheres prepared in this study were well-defined and had a core-shell structure. The hydrophilicity of the drug-loaded microspheres changed compared to the no-load microspheres. Furthermore, in vitro results indicated that the drug-loaded microspheres with high encapsulation and loading efficiencies exhibited good biodegradability and cytocompatibility, slowly releasing the drug for up to three months.
CONCLUSION:
The development of the drug delivery system with a dual-step release mechanism has potential clinical applications and implications in the treatment of bone defects.
Introduction
Advances in bone tissue engineering offer novel options for the regeneration of bone tissue [1]. Bone defects have a long healing cycle, requiring at least three months to develop mature bone tissue [2]. In the bone tissue repair process, angiogenesis precedes bone formation. As the nutrients required for new bone formation and the metabolic products obtained from old bone breakdown require vascular transport, the early formation of blood vessels is essential for later osteogenic differentiation and the homeostasis of the bone tissue’s internal environment [3]. In current clinical treatment, the method of accelerating bone tissue regeneration rate by promoting early angiogenesis has been widely accepted [4,5]. Although the various growth factors currently used in the treatment of bone defects are clinically effective, high cost and susceptibility to inactivation limit their use in clinical practice [6]. Plant-derived compounds are easily available, chemically stable, non-denaturing, inexpensive and simple to extract, with promising clinical applications [7,8]. Ligusticum wallichii is a commonly used clinical herb for activating blood circulation and resolving blood stasis. Tetramethylpyrazine (TMPZ), a colourless needle-like crystal, is the main active ingredient in L. wallichii [9]. It displays significant efficacy in the treatment of ischaemic cardiovascular diseases and promoting angiogenesis by improving local microcirculation [10]. Numerous studies have shown that TMPZ can regulate nitric oxide secretion by mediating nitric oxide synthase activity, thereby acting as a protective agent for local vascular endothelial cells, including repairing endothelial cells and promoting neovascularization [11]. Additionally, it improves blood supply to ischaemic areas by inhibiting endothelin production [12]. Furthermore, it promotes the expression of signalling molecules such as vascular endothelial growth factor, regulates the concentration of intra- and extracellular Ca2+ and prevents vasoconstriction and spasm [13–15]. Epimedium is a commonly used clinical herb for strengthening muscles and bones [16]. cariin (ICA), a class of ketones, is the main pharmacological component of Epimedium, which promotes estrogen receptor and osteoprotegerin expression, accelerates calcium nodule formation in bone tissue and induces alkaline phosphatase secretion [17–19]. Additionally, ICA inhibits the expression of bone resorption-related factors [20].
Long-acting and slow-release agents prepared with TMPZ and ICA have clinical potential in the treatment of certain diseases that require repeated long-term drug delivery. As one of the most used drug release carriers, microspheres have a high encapsulation efficiency (EE) and versatility [21]. Microspheres are polymeric materials that can be degraded in the body, with the resultant products reabsorbed or metabolised out of the body [22]. They are matrix-skeleton particles that are solid or hollow micro/nanospheres or sphere-like particles prepared using various processes [23]. The drug encapsulated in the polymer matrix is slowly released into the body at a certain rate, thereby maintaining plasma concentration [24]. Currently, biodegradable microspheres are vital components of new drug delivery systems. Microspheres with a simple structure have a single mode of drug release, leading to burst release and cytotoxicity [25]. However, owing to the complex pathology of most diseases, such simple microspheres show lower therapeutic efficacy. Therefore, it is crucial to construct sequential release patterns for multiple drugs to fulfil different therapeutic needs. This study aimed to develop a long-acting slow-release system using the pro-angiogenic drug TMPZ and pro-osteogenic drug ICA, which can be administered locally to achieve the sequential release of TMPZ and ICA for better clinically efficiency in the treatment of bone defects.
The main challenge in constructing such a drug delivery system is controlling the release behaviour of each drug encapsulated within it. Different carrier materials can be used for the core-shell layer based on their physicochemical and degradation properties to separately control the release behaviour of each drug [26]. Furthermore, the materials used to prepare the microsphere matrix should be stable and non-toxic to the body, not conflict with the properties of the carrier material and be metabolizable by the body. Poly lactic-co-glycolic acid (PLGA), the shell polymer used in this study, is produced by polymerising lactic acid and hydroxy acetic acid in a certain ratio using a catalyst [27]. It has good biocompatibility and stability, completely degrading into H2O and CO2 in the body. Thus, the Food and Drug Administration approves its use as a drug carrier [28]. Silk fibroin (SF), a large molecular protein derived from natural silk and weighing 30–450 KDa, was used as the nucleated polymer material in this experiment [29]. SF comprises various essential amino acids, boasting a dense structure and high crystallinity. Owing to the porous mesh structure, it promotes drug adsorption and long-term slow release [30]. Additionally, SF has good biocompatibility, adjustable biodegradability, low immunogenicity and stable drug-carrying capacity and thus, can be used as a drug carrier [31]. Moreover, SF has amphoteric electrolyte properties and can carry both water-soluble and non-water-soluble drugs [32].
Unlike other complex microsphere preparation methods, the preparation of microspheres by electrostatic spraying is simple and applicable in various fields [33]. Additionally, the prepared microspheres have a more homogeneous particle size and good monodispersity, which allows for effective drug encapsulation and avoids the drug’s burst release [34]. The electrostatic spray product is influenced by many preparation factors, which can be classified into three main categories: solution, process and environmental parameters [35,36]. Therefore, an ideal core-shell drug-loaded microsphere can be prepared by controlling these parameters [37,38].
In this study, PLGA and SF were dissolved in hexafluoroisopropanol (HFIP) to serve as a shell-layer solution and a core-layer solution, respectively. Subsequently, core-shell microspheres were prepared using SF and PLGA by coaxial electrostatic spraying. Notably, the microspheres were prepared under different preparatory conditions using a univariate controlled variable method. The effect of various preparation parameters on microsphere morphology was observed to determine the optimal preparation parameters. TMPZ and ICA were added to the shell-layer solution and the core-layer solution, respectively, to prepare pro-angiogenic and osteogenic core-shell drug-loaded microspheres under the optimal parameters. The morphology and core-shell structure of the microspheres were characterized by scanning electron microscope (SEM) and laser scanning confocal microscopy (LSCM) to investigate their physical properties, EE, and in vitro degradation and drug release patterns. Finally, cell proliferation-toxicity assays were performed on bone marrow stromal cells (BMSCs) and human umbilical vein endothelial cells (HUVECs) to assess the difference in the cytocompatibility of the no-load and drug-loaded microspheres.
Materials and methods
Materials
PLGA 75:25 copolymer (molecular weight = 40 kDa) was purchased from Jinan Daigang Biotech (Shandong, China). TMPZ and ICA were purchased from Dalian Meilun Biotech (Dalian, China). Phosphate buffer solution (PBS, BOSTER, China) was used for the drug release and degradation experiments. Methanol (CH3OH) was obtained from Tianjin Zhiyuan Chemical Reagent. All chemicals used in this study were analytically pure.
Preparation of core-shell microspheres
PLGA and SF were dissolved in HFIP to form the shell-layer and core-layer solutions, respectively. Subsequently, core-shell microspheres were prepared using SF and PLGA by coaxial electrostatic spraying under varying voltages (10–20 kV), receiving distances (10–20 cm), core-shell pushing ratios (0.1 mL/h:1 mL/h–0.3 mL/h:3 mL/h) and core-shell concentration ratios (1% [w/v]–3% [w/v]). Finally, the microspheres were characterised using a scanning electron microscope (SEM) to investigate the effect of various preparation parameters on microsphere morphology, thereby determining the optimal preparation parameters.
Preparation of drug-loaded core-shell microspheres
ICA and TMPZ were added to the core-layer (100:1 mass ratio of SF to ICA) and shell-layer (100:1 mass ratio of PLGA to TMPZ) solutions, respectively. The optimal preparation parameters were used to prepare the microspheres, which were subsequently characterised using SEM.
Characterization of core-shell microspheres
Microsphere morphology
Aluminium foil with no-load core-shell microspheres was gold sprayed after sample preparation, and the microsphere morphology was characterised using SEM. The particle size values of more than 100 randomly selected microspheres in a random area were measured using Image J software to calculate the average particle size. Finally, the coefficients of variation of the microspheres were calculated using Eq. (1).
To characterise the core-shell structure of the prepared microspheres, alizarin red and calcein were added to the core-layer and shell-layer solutions, respectively, during the preparation of the electrostatic spinning solution. Subsequently, the solutions were stirred well and stored away from light. The optimal parameters obtained above were used for microsphere preparation. The prepared microspheres could excite red and green light under fluorescence in the core and shell layers, respectively. Finally, characterisation was performed using LSCM.
EE and loading efficiency (LE)
EE: The drug content loaded by the microspheres was calculated by measuring the amount of free-state drug on the microsphere surface. A total of 10 mg core-shell drug-loaded microspheres (theoretically containing approximately 79 μg TMPZ and 20 μg ICA) was added to 2 mL PBS. The sample solution was then centrifuged at 15,000 rpm for 10 min in a high-speed centrifuge and the supernatant was filtered through a 0.22 μm membrane. Finally, the absorbance of the filtrate was measured, and EE was calculated using Eq. (2).
Aluminium foil was used to accept the no-load and drug-loaded microspheres. Subsequently, the contact angles of the microspheres with water were measured separately using a contact angle measuring instrument, and the results were analysed.
In vitro degradation behaviour of microspheres
Water absorption rate
A total of 10 mg drug-loaded and no-load microspheres were completely immersed in PBS solution in a centrifuge tube. The microspheres were then placed in a constant-temperature shaker at 37 °C for 1 day. Subsequently, the microspheres were taken out and their surfaces dried using absorbent paper to remove PBS. Finally, the microspheres were weighed, and the water absorption rate of the microspheres was calculated using Eq. (4).
Microspheres in aluminium foil were placed in PBS solution with the appropriate concentration of protease XIV. Then, the solution was placed in a constant-temperature incubator at 37 °C for three months for natural degradation. The samples were removed at weekly intervals and repeatedly rinsed with deionized water, followed by drying and metal spraying. Finally, the morphological changes of the microspheres during the degradation process were observed using SEM.
Mass changes of microspheres during degradation
In vitro degradation rate was determined by measuring the mass loss of the microspheres in PBS. A total of 10 mg microspheres were placed in 5 mL PBS supplemented with an appropriate protease XIV concentration. Subsequently, the solution was incubated in a constant-temperature shaker at 37 °C for 3 months at 60 rad/min to simulate in vitro degradation. Additionally, the pH value of the solution was monitored using test strips. A pH of 7.4 was maintained by changing the PBS solution. Additionally, samples were removed at weekly intervals and repeatedly rinsed thrice with deionized water. The mass of the microspheres was measured after drying in the oven, and the degradation rate was calculated using Eq. (5).
A total of 10 mg drug-loaded microspheres were subjected to ultraviolet sterilization for 4 h and transferred to centrifuge tubes. PBS (50 mL) was added to the tubes which were then placed in a 37 °C constant temperature shaker at 100 rad/min for three months to simulate in vitro drug release. For the first two weeks, 3 mL of the drug release solution was removed at the same time point each day and 3 mL PBS was added to the centrifuge tube to maintain the total volume of the drug release solution. Subsequent withdrawals were made at the same time point each week and stored at 4 °C. Afterwards, the absorbance of the release solution was measured. Additionally, the drug release concentration was calculated using the regression equation, and the drug release percentage was calculated according to Eq. (6).
No-load and drug-loaded microspheres with a concentration of 10 mg/mL were prepared according to ISO 10993-5:2009. The solution was incubated at 37 °C for 72 h and then centrifuged at 1000 r/min for 5 min. Subsequently, the supernatant was removed and stored at 4 °C. The fourth-generation BMSCs were inoculated in 96-well plates (2000 cells per well) and incubated (5% CO2 and 37 °C) for 2 h to ensure the cells adhere to the wall. The original medium was discarded and replaced by the liquid extract of the microspheres. Additionally, the blank medium was used as a blank control (3 wells per group) to incubate the solution (5% CO2 and 37 °C) for 1, 3 and 5 days. Then, 10 μL cell counting kit-8 (CCK-8) reagent was added to the solution and incubated for 2 h. Subsequently, the absorbance of each well was measured at 450 nm using a microplate reader. Finally, cell viability calculations were performed. Moreover, the above experiments were performed on third-generation HUVECs using the same method.
Statistical analyses
Data are presented as mean ± standard deviation and analysed using a one-way analysis of variance and SNK-Q test via the SPSS 20.0 software (SPSS Inc., Chicago, USA). P < 0.05 indicated a statistically significant difference.
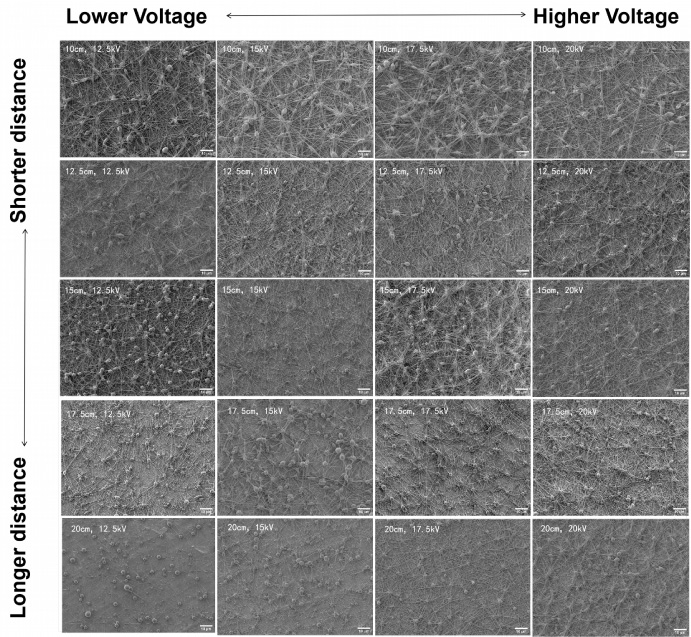
Core-shell microsphere morphology with different receiving distances and applied voltage. The bar is 10 μm.
Characterization of microspheres
Effect of receiving distance and applied voltage on microsphere morphology
The receiving distance and applied voltage determine the evaporation time of the solvent. Figure 1 shows that at the same receiving distance, as the voltage increases, the charged droplets are stretched and elongated, changing the microsphere morphology from spherical to a dumbbell. Additionally, fibrous connections are increased in the microspheres, leading to an even bead-like morphology and a gradual decrease in microsphere numbers. This phenomenon is attributed to the increased charge on the droplet surface. Therefore, the time between emission and reception of the microspheres is shortened, resulting in the incomplete evaporation of the solvent residue. At the same voltage, the microsphere morphology changes from elliptical to spherical as the receiving distance increases, resulting in a gradual reduction in connecting fibres between microspheres. The microspheres prepared at lower voltages have fewer fibrous connections and are more numerous and dispersed than those prepared at higher voltages, possessing a more homogeneous particle size and spherical morphology. This could be because some of the microspheres are not received by the receiving device owing to the low electric field force and high surface tension of the droplets. When prepared at high voltages, the droplets are completely dispersed and emitted by the electric field force, resulting in more fibrous connections between the microspheres. In this case, the droplets are overstretched, displaying a spindle morphology. Additionally, the high voltage causes instability of the jet, thus inducing multiple jets. When the receiving distance is shortened, the microsphere surface becomes wrinkled and rough forming a dumbbell shape, which results in larger fibrous connections between particles. This could be attributed to the incompletely evaporated organic solvent inside the microsphere solution owing to the small distance. When the receiving distance increases, the fibres between the microspheres are stretched enough and the solvent on the microsphere surface can fully evaporate. Hence, oversized microspheres are not received due to gravity and the prepared microspheres have a uniform size and spherical shape. Therefore, the optimal voltage and receiving distance are 12.5 kV and 20 cm, respectively.
Effect of pushing speed on microsphere morphology
The flow rate is an effective parameter to control the particle size of the microspheres. Figure 2 shows that the size of the microspheres prepared at a shell-layer and core-layer flow rate of 1 mL/h and 0.1 mL/h, respectively, is smaller and more homogeneous than those prepared at a shell-layer and core-layer flow rate of 3 mL/h and 0.3 mL/h, respectively. As the pushing speed increases, fibrous connections between the microspheres increase, resulting in an increased microsphere size and more heterogeneous size distribution. In this case, a few microspheres displayed an oval morphology. Therefore, this study hypothesized that when the flow rate of the solution increases, an increasing volume of liquid will accumulate at the tip of the needle per unit time. When other conditions are constant, the increased number of droplets ejected per unit time causes the jet to split into larger droplets, leading to an increase in the microsphere particle size. Therefore, the optimal pushing speed of 1 mL/h for the shell layer and 0.1 mL/h for the core layer was obtained.
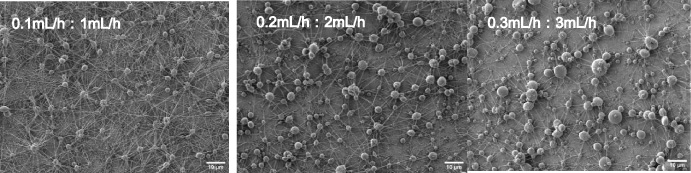
Core-shell microsphere morphology with different shell-layer and core-layer flow rate. The bar is 10 μm.
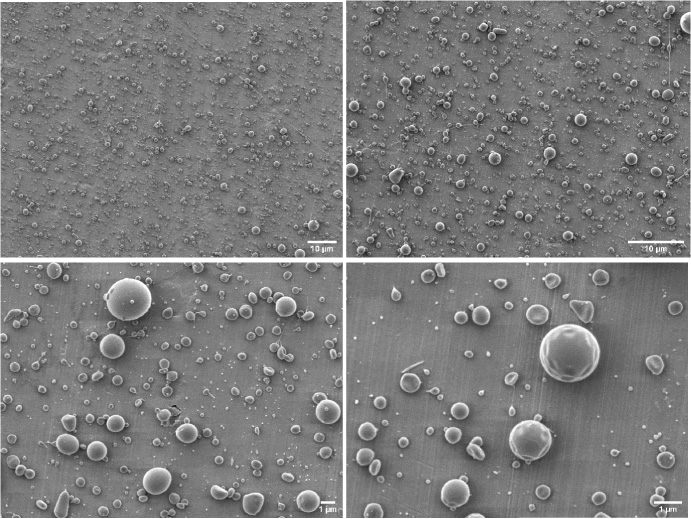
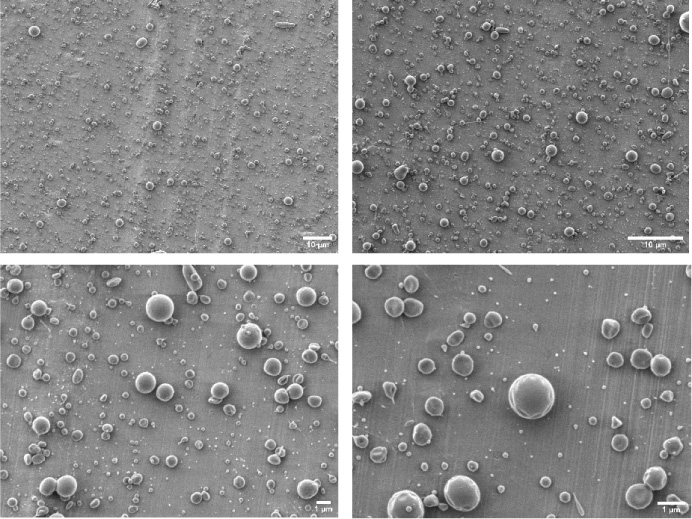
In the preparation of core-shell microspheres by coaxial electrostatic spraying, the core-layer solution is administered in the centre of the shell-layer solution under the guidance of a coaxial needle. As the solvent evaporates and the phase separation at the core-shell interface increases, SF and PLGA are solidified in the core and shell layers, respectively, to form microspheres with a core-shell structure. At a core-layer concentration of 1% (w/v) for the SF solution and shell-layer concentration of 1% (w/v) for the PLGA solution, the microspheres exhibit a pie shape with a convex edge and a concave centre. This morphology could be attributed to the low core-layer solution concentration. Therefore, SF concentration is insufficient to support the normal spherical morphology of the microspheres after solvent evaporation. Upon increasing the shell-layer solution concentration and shell support, the depression on the microsphere surface gradually disappears, resulting in a more spherical morphology. At a certain shell-layer solution concentration, an increase in the core-layer solution concentration causes a change in the microsphere morphology, wherein the centre is no longer concave, and the microspheres become more spherical. However, fibrous connections appear between the microspheres along with droplets. When the core-layer solution concentration is constant, an increase in the shell-layer solution concentration results in a smooth surface and more spherical microspheres. The optimal concentration ratios obtained are 1% (w/v) for the core-layer SF solution and 3% (w/v) for the shell-layer PLGA solution (Fig. 3). However, a small depression and flattening on the microsphere surface were observed on magnification (Fig. 4), which could be attributed to the low polymer concentration. The higher solvent content could be responsible for incomplete solvent evaporation. Therefore, further drying after receiving leads to heterogenous and flattened particle morphology. Thus, the shell-layer solution concentration was increased to 4% (w/v). Under this condition, the microsphere surface was smooth without depressions, revealing a spherical morphology (Fig. 5).
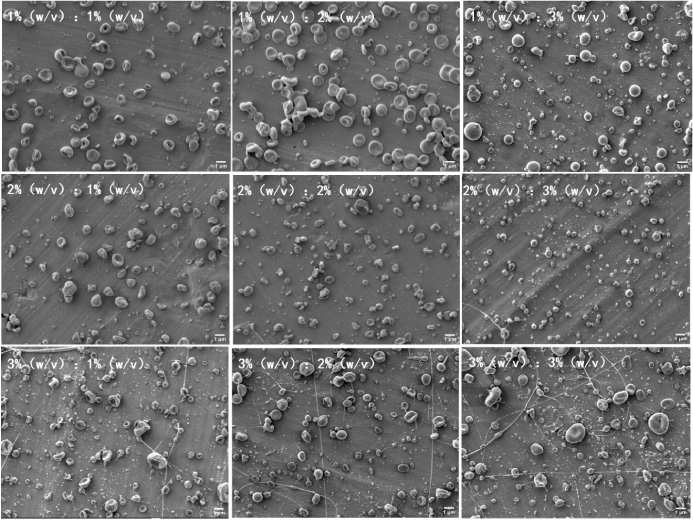
Core-shell microsphere morphology with different concentration ratios of core-shell layer solutions. The bar is 1 μm.
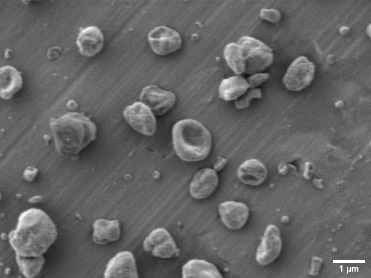
Core-shell microsphere morphology with a core-layer silk fibroin solution concentration of 1% (w/v) and a shell-layer poly lactic-co-glycolic acid solution concentration of 3% (w/v). The bar is 1 μm.
Core-shell microsphere morphology with a core-layer silk fibroin solution concentration of 1% (w/v) and a shell-layer poly lactic-co-glycolic acid solution concentration of 4% (w/v). The bar is 1 μm.
Therefore, the optimal parameters for the preparation of core-shell microspheres using SF and PLGA were as follows: applied voltage, 12.5 kV; receiving distance, 20 cm; core-layer and shell-layer pushing speeds of 0.1 and 1 mL/h, respectively; core-layer SF solution concentration and shell-layer PLGA solution concentration of 1% (w/v) and 4% (w/v), respectively. Additionally, no-load microspheres were prepared under the same conditions, which were dispersed and of uniform particle size, with satisfactory morphology and smooth surface (Fig. 6).
The morphology unloaded core-shell microsphere prepared under optimal preparation parameters.
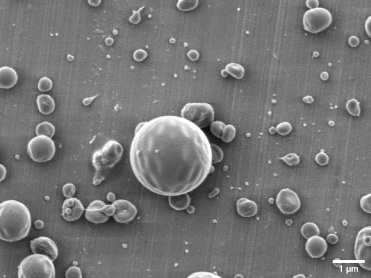
The core-shell microspheres prepared under optimal preparation parameters containing TMPZ and ICA were observed under an SEM (Fig. 7). The prepared microspheres were dispersed and of uniform size, with satisfactory morphology and smooth surface. The mean particle size of the microspheres was 0.703 ± 0.356 μm. Additionally, the coefficient of variation of 0.506 was obtained (Eq. (1)), with a wide particle size distribution range (Fig. 8).
The morphology drug-loaded core-shell microsphere prepared under optimal preparation parameters.
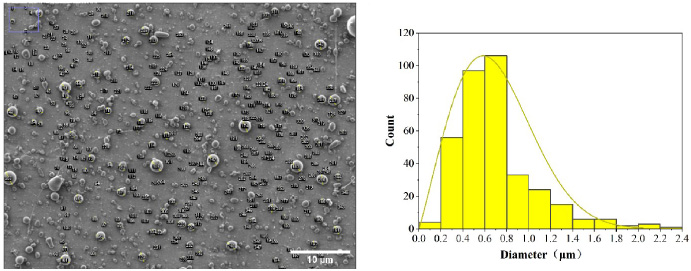
The particle size distribution range of core-shell microsphere prepared under optimal preparation parameters. The bar is 10 μm.
The core-shell microspheres were prepared according to the above optimal preparation parameters, and the core-shell structure of the microspheres was characterised using LSCM (Fig. 9). The red fluorescent core was surrounded by a green fluorescent shell in the same microsphere. Furthermore, the diameter of the red core was slightly smaller than that of the green core. These findings indirectly prove that the microspheres prepared in this study have a core-shell structure.
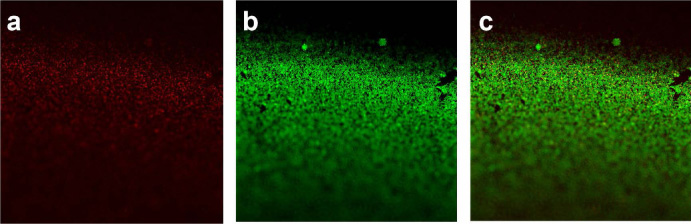
The morphology core-shell microsphere characterised using LSCM. (a) The prepared microspheres could excite red light under fluorescence in the core layers. (b) The prepared microspheres could excite green light under fluorescence in the shell layers. (c) The superposition of (a) and (b).
The EE and LE of TMPZ in the core-shell drug-loaded microspheres were 45.3 ± 3.13% and 0.314 ± 5.62%, respectively, whereas those of ICA were 65.5 ± 2.67% and 0.13 ± 4.47%, respectively. As few core-layer droplets were not encapsulated or incompletely encapsulated by the shell-layer droplets during the preparation process, ICA was present on the surface layer of the core-shell microspheres.
Contact angle test
Figure 10 shows that the contact angles of the no-load and drug-loaded core-shell microspheres were 124.5 ± 1.49 and 78.24 ± 3.94, respectively. The contact angle is an indicator of the affinity of the material to water, with a larger contact angle indicating the material’s high hydrophobicity degree and less affinity to water. The reduced contact angle of the drug-loaded core-shell microspheres compared to the no-load microspheres is attributed to the addition of the hydrophilic drug TMPZ to the hydrophobic PLGA shell layer, which alters the affinity of the microspheres to water. Additionally, the difference in contact angle between the two types of microspheres was statistically significant (P < 0.05).
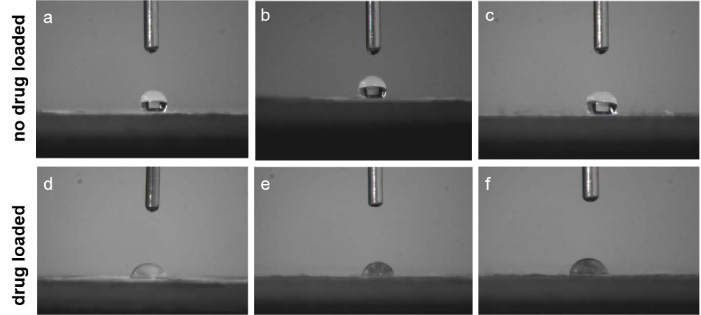
Contact angles of the no-load core-shell microspheres (a–c). Contact angles of the drug-loaded core-shell microspheres (d–f).
Contact angle of the no-load and drug-loaded microspheres (n = 3, x ± s)
Water absorption rate of microspheres
Table 2 shows that the water absorption rates of the no-load and drug-loaded microspheres were 87.30 ± 5.51% and 112.87 ± 6.82%, respectively. The higher water absorption rate of the drug-loaded microspheres than the no-load microspheres could be attributed to the added drug, which modified the microsphere hydrophilicity and resulted in an increase in water absorption rate. Compared to the no-load core-shell microspheres, the solution penetrated more easily from the surface of the drug-loaded microspheres into the matrix, allowing the exchange of water molecules with the drug and resulting in the outward drug release. Moreover, the difference in water absorption rate between the two types of microspheres was statistically significant (P < 0.05).
Water absorption rates of the no-load and drug-loaded microspheres (n = 3, x ± s)
Water absorption rates of the no-load and drug-loaded microspheres (n = 3, x ± s)
Figure 11 shows the morphological changes of the drug-loaded core-shell microspheres during degradation for three months. In the first week, the shell-layer PLGA absorbed water and swelled, resulting in increased volume, smooth surface and a lysed morphology, with the PLGA in the lysed state forming flakes. Between the second and fourth week, the PLGA in the lysed state formed smaller flakes due to degradation. Meanwhile, the microspheres were still spherically shaped, but the surface changed from smooth to rough and uneven. From the fifth to the eighth week, although the microspheres exhibited an intact spherical morphology, small holes appeared on the surface of a few microspheres. As the number of holes increased, the diameter increased with time. However, the area of flaked PLGA continued to decrease, indicating that the PLGA continued to degrade. The SEM images in the ninth week showed that the shell layer underwent swelling, resulting in the coexistence of smooth and molten flaked PLGA and a loose and hollow SF core layer. This indirectly further validates the core-shell structure of the microspheres. In the tenth week, cracks appeared on the shell layer surface. At this point, the number of pores increased and tended to expand. However, the overall morphology remained intact. Further degradation caused the internal pores to expand and fuse, resulting in the connection between pores. From the eleventh week onwards, the porous surface of the loose SF core layer continued to expand and fuse. At this point, the internal porous structure was still present. However, with time, the loose and porous SF core layer gradually collapsed and degraded into small pieces until completely disappearing.
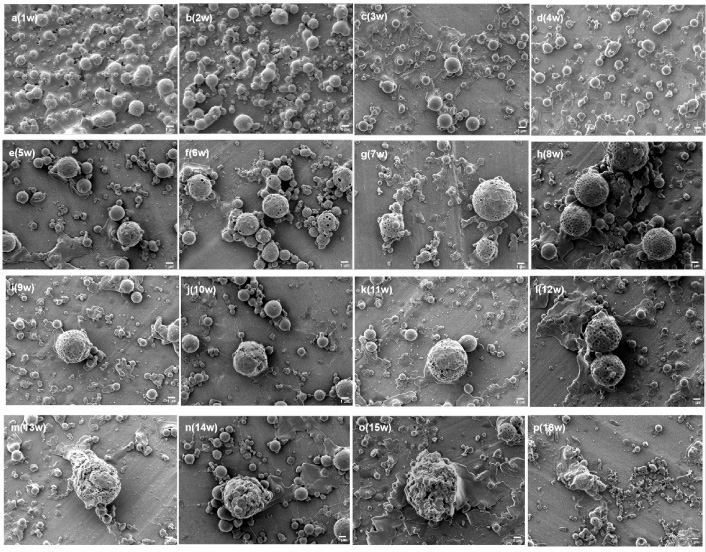
The morphological changes of the drug-loaded core-shell microspheres during degradation between the first and fourth week (a–d). The morphological changes of the drug-loaded core-shell microspheres during degradation between the fifth and eighth week (e–h). The morphological changes of the drug-loaded core-shell microspheres during degradation between the ninth and twelfth week (i–l). The morphological changes of the drug-loaded core-shell microspheres during degradation between the thirteenth and sixteenth week (m–p). The bar is 1 μm.
The in vitro degradation curves of the drug-loaded microspheres in PBS solution are shown in Fig. 12. The overall mass of the microspheres showed a gradual decrease. The degradation process can be divided into three stages. The first stage (1–3 weeks) includes PLGA degradation, whereas the second stage (3–10 weeks) includes both PLGA and SF degradation. At the beginning of the degradation phase, the degradation of shell-layer PLGA led to the gradual exposure of the core-layer SF, which subsequently undergoes hydrolysis. From this stage onwards, PLGA and SF degradation proceeded simultaneously. After a period of degradation, the polymer hydrolysed to produce a low-molecular polymer, which diffused in solution and changed the solute weight. The original spherical PLGA was gradually dissolved in PBS, resulting in an increase in its surface area that was in contact with the external environment, which was more conducive to material degradation. In the third stage (10–12 weeks), a small amount of incompletely degraded PLGA remained. However, the degradation in this stage was mainly of SF, and the gradual PLGA degradation allowed the SF cores in the microspheres to be fully exposed. Thereby, the loose and porous SF was rapidly degraded by the action of proteases. The SF degradation rate in vitro has been reported to be much faster than that in vivo. Here, the in vitro degradation rate of the microspheres reached 82% in the 12th week. However, the in vivo degradation rate was faster than that in in vitro due to the actions of various hydrolytic enzymes.
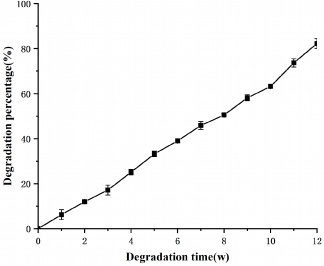
The in vitro degradation curves of the drug-loaded microspheres in PBS solution.
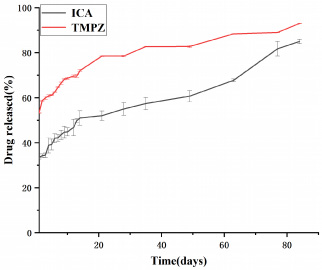
The in vitro drug release curves of the drug-loaded microspheres in PBS solution.
Microspheres have three main release mechanisms: surface release, diffusive release and lysis release. Additionally, drug release can be further classified into burst release, rapid release and plateau release. Figure 13 suggest that the core-shell microspheres loaded with TMPZ and ICA underwent rapid release during the initial 14 days. Subsequently, they underwent a sustained release based on the properties of each layer. During the initial stage, both drugs underwent significant release. On the first day, the drug release from TMPZ reached 52%, which was mainly related to the rapid release of the drug located on and near the microsphere surface. However, the burst release amount of ICA was comparatively smaller (approximately 33% of the total drug amount), which could be attributed to the release of small ICA amounts that were incompletely encapsulated by the shell layer. However, most ICA located in the core layer could not be released. On days 14–49, TMPZ in the shell layer underwent a rapid release phase, wherein the pores on the surface not only increased the surface area but also provided a release channel for drug diffusion. The increased number of pores and the enlarged contact area between the lysed PLGA and aqueous solution led to the rapid release of large amounts of TMPZ. Meanwhile, ICA located in the nuclear layer could also reach the surface layer through the pore channels. Additionally, the exposed SF underwent hydrolysis, leading to the release of small amounts of ICA. Thereafter, the microspheres underwent plateau release. As the microsphere matrix PLGA and SF underwent further hydrolysis and degradation, the internally loaded drug was gradually released. Following 60 days, the SF nuclear layer was fully exposed owing to complete PLGA degradation. As the core layer of SF was more porous than that of PLGA and had greater contact with the aqueous solution, its drug release rate was faster than that of the shell layer. By the third month, the drug release rate of TMPZ from the shell layer reached nearly 90% while that of ICA from the core layer reached 80%. Therefore, these results demonstrate that the core-shell microspheres prepared using SF and PLGA can perform sequential drug release with significant efficiency.
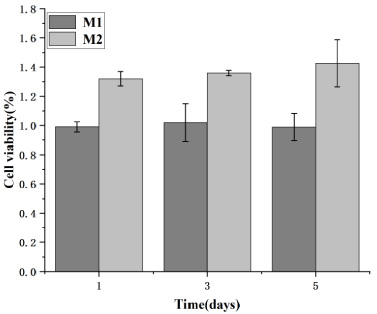
Cell survival rate of BMSCs.
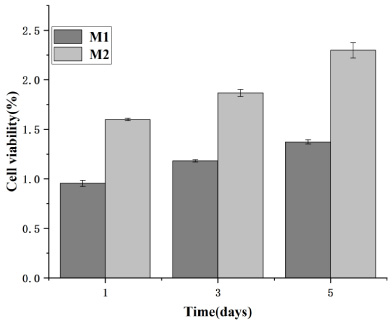
Cell survival rate of HUVECs.
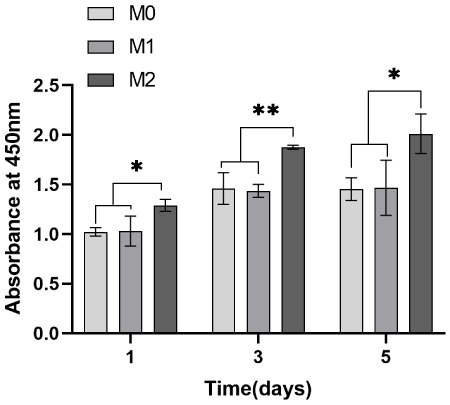
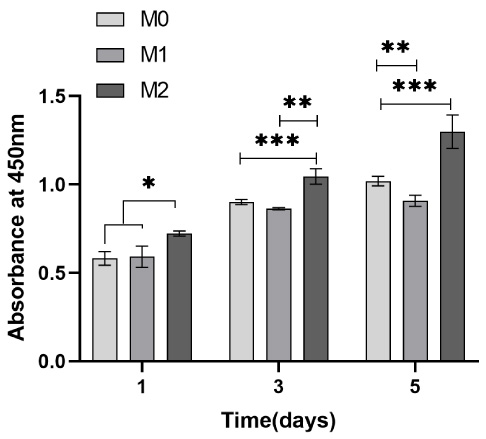
A CCK-8 assay was performed to assess microsphere cytocompatibility by studying the cell viability and proliferation of BMSCs and HUVECs in the microsphere extract liquid. The cell viability of BMSCs and HUVECs on days one, three and five were calculated. Subsequently, a graph was plotted with time and cell survival as the horizontal and vertical coordinates, respectively, where M0 represents the blank control; M1, the no-load microsphere; and M2, the drug-loaded microsphere. Cell survival rates greater than 1 in both Figs 14 and 15 indicate that BMSCs and HUVECs cultured with the extracted liquid exhibited a growth trend. Therefore, neither no-load nor drug-loaded microspheres inhibited cell growth. Moreover, the drug-loaded microspheres better promoted the growth of HUVECs compared to the BMSCs. This could be attributed to the TMPZ in the shell layer of the drug-loaded microspheres, which could promote the growth of HUVECs, whereas a small portion of the unencapsulated ICA promoted the growth of BMSCs. Figures 16 and 17 indicate that in the 5-day culture, the proliferation rate of cells in the drug-loaded microsphere group was higher than that in the no-load microsphere group, with a significantly higher effect on HUVECs than on BMSCs (P < 0.05). Moreover, no significant difference in cell proliferation between the no-load microsphere and control groups was observed, indicating that the microspheres were not cytotoxic and did not inhibit cell proliferation (P > 0.05). Therefore, the no-load and drug-loaded core-shell microspheres have good cytocompatibility.
Proliferation of bone marrow stromal cells (BMSCs) in the no-load and drug-loaded microspheres was studied using Cell Counting Kit-8 assays. BMSCs cultured in drug-loaded microsphere extract liquid exhibited significant proliferation compared to those cultured in blank medium and no-load microsphere extract liquid.
Proliferation of human umbilical vein endothelial cells (HUVECs) in the no-load and drug-loaded microspheres was studied using Cell Counting Kit-8 assays. HUVECs cultured in drug-loaded microsphere extract liquid exhibited significant proliferation compared to those cultured in blank medium and no-load microsphere extract liquid.
The degradation of polymeric materials in living organisms is a complex, multi-factor, synergistic biochemical process. Prior to degradation, the microsphere polymer matrix undergoes water absorption causing swelling, hydrolysis and lysis. However, these reactions do not occur separately but often occur simultaneously. The breaking of molecular chains via hydrolysis is the essence of polymer degradation. The degradation of polymer chains into lower molecular-weight polymers and monomers results in a reduction in polymer mass. The in vitro degradation of PLGA is characterised at a macroscopic level by water absorption causing swelling, weakened strength, gradual structural destruction and mass reduction. At the microscopic level, the ester bonds in the polymer backbone are degraded by hydrolysis, resulting in the formation of many lower-molecular weight polymers. In this process, the degree of polymer cross-linking is reduced, and the continued hydrolytic breakage of the side chains leads to decreased molecular weight. When reduced to a certain level, the polymer is dissolved in water until it is completely degraded. The small average particle size (0.703 ± 0.356 μm) of the core-shell drug-loaded microspheres allows for a large surface area and high water absorption rate ([112.87 ± 8.35]%). The high water absorption rate indicates that water molecules can easily penetrate through the shell layer surface into the interior and even the core layer. The subsequent water absorption and swelling loosen the polymer structure and thus facilitate drug exchange. After early burst release and curing of the microspheres, some of the drugs are located or semi-embedded on the surface of the microsphere. The water absorption and swelling of the microspheres loosen the polymer structure when in contact with the slow-release solution, resulting in the exchange of the drug with the external solution and its dissolution in the slow-release solution within a short time frame. Additionally, the microsphere displays a long-term slow-release pattern when the burst release is complete. The SEM images show that the microspheres swell after absorbing water at this stage, increasing in size and having a smooth surface and lysed morphology. Moreover, PLGA begins to undergo dissolution and exhibits a flaked morphology. As the degradation proceeds, the breakage of the hydrolysis chain gradually creates tiny pores on the microsphere surface (PLGA). With time, the number of pores and their diameter increases, leading to the formation of a flake. Meanwhile, the rapid dissolution of PLGA loosens the microsphere structure, accelerating the degradation rate inside the microspheres. Figure 13 shows that a large amount of TMPZ is released at this stage. The degradation of the shell layer triggers the appearance of channels through which the aqueous solution can penetrate the nuclear layer, allowing for drug release through the pores. With further PLGA degradation, all the encapsulated TMPZ is gradually released. The degradation of the shell layer exposes the nuclear layer SF, whose loose and porous structure allows for a larger surface area and greater contact area with the solution, thereby facilitating drug diffusion. The SF is hydrolysed to peptides, dissolved by proteases and the loose porous nuclear layer is gradually destroyed. Over time, the SF core layer gradually collapses and degrades completely, resulting in the gradual release of the encapsulated ICA.
Conclusions
This study successfully prepared core-shell drug-loaded microspheres via coaxial electrostatic spraying. The microspheres were morphological well-defined, with high EE and LE, good biocompatibility and long-term slow-release capability. This study provides novel directions for the development of drug delivery systems. However, a few limitations do exist. Due to the wide range of particle size distribution and lack of data on the in vivo release rate or degradation rate of the microspheres, the drug content in the microspheres requires further investigation. Furthermore, drug-loaded microspheres with a core-shell structure could be optimized in the future to facilitate the treatment of bone defects.
Conflict of interest
None to report.