
Abstract
BACKGROUND:
The postoperative varus/valgus stability assessment in stress X-rays has been established as an evaluation index. However, it is performed by the two-dimensional (2D) method rather than the three-dimensional (3D) method.
OBJECTIVE:
This study aimed to identify the precision and reproducibility of measuring varus/valgus stress X-rays three-dimensionally and to examine varus/valgus stability under anesthesia in imageless robotic assisted total knee arthroplasty (rTKA).
METHODS:
This prospective study analyzed 52 consecutive rTKAs (five males, 67 ± 5.3 years; 47 females, 74 ± 5.9 years). Postoperative varus/valgus stress X-rays in knee extension under anesthesia at manual maximum stress were three-dimensionally assessed by 2D–3D image matching technique using the 3D bone and component models. Varus/valgus angle between components (VV angle) in no stress, valgus stress, varus stress, medial joint opening (MJO), and lateral joint opening (LJO) were evaluated, clarifying this method’s precision and reproducibility and valgus/varus stability.
RESULTS:
All parameters’ precision and reproducibility had <1° mean differences and high intra- and inter-class correlation coefficients. Bland–Altman plots showed no fixed and proportional bias. Non-stress VV angle, valgus VV angle, varus VV angle, MJO, and LJO were 3.6 ± 1.2°, 1.0 ± 1.4°, 7.1 ± 1.9°, 1.5 ± 1.0 mm, and 2.8 ± 2.7 mm, respectively.
CONCLUSION:
This prospective study demonstrated that (1) the three-dimensional measurement method provided sufficient precision and reproducibility, and (2) the rTKAs could achieve good postoperative varus/valgus stability with a small standard deviation.
Keywords
Introduction
Robotic-assisted total knee arthroplasty (rTKA) is widespread [1,2]. Theoretically, good clinical results in rTKAs can be obtained by achieving correct prosthesis positioning and alignment, matched to each patient’s anatomy and soft tissue properties, and leading to acceptable joint stability. However, few systems in rTKAs assess the laxity of the prosthetic joint in a standardized fashion by measuring the knee kinematics during application of set forces and moments [2]. Intraoperative manual evaluation of varus/valgus balance in an rTKA depends on the surgeon’s skill without a standardized manner [2]. There are presently limited reports on whether an excellent postoperative varus/valgus balance has been achieved.
The postoperative varus/valgus stability assessment in stress X-rays has been established as an evaluation index. However, it is performed by the two-dimensional (2D) method rather than the three-dimensional (3D) method [3,4]. The rTKA has advanced surgical techniques, but the mainstay of evaluation is the 2D assessment by X-rays; therefore, further advances in evaluation methods have been demanded. The 3D evaluation has been reported to be more accurate than the 2D in many parameters [5–8]. This is because using a coordinate system makes the reference stable and is less affected by the position of the subjects and films [5–8].
Our group has long performed the actual 3D static alignment measurements and knee motion analysis by applying the 3D–2D image registration technique [5–7,9–17]. The study aimed to identify the precision and reproducibility of measuring varus/valgus stress X-rays three-dimensionally and to examine varus/valgus stability under anesthesia in rTKAs.
The hypotheses are that (1) a 3D evaluation method in varus/valgus stress X-rays via 3D–2D image registration technique shows good precision and reproducibility, and (2) rTKAs can achieve good postoperative varus/valgus laxity balance.
Materials and methods
The ethical review board of Niigata University approved this prospective observational study (IRB number: 2020-0448). This study is the consecutive series of rTKAs for over 60 years-old subjects with advanced varus knee OA classified as grades 3–4 following the Kellgren–Lawrence (K–L) classification [18]. The cases with a loss of necessary data were excluded. Of 55 knees (50 patients) between January 2021 and March 2023, 52 knees (47 patients) were enrolled. Four males (five knees) and 43 females (47 knees) with average ages of 67 ± 5.3 and 74 ± 5.9 years, respectively, were analyzed (Table 1).
Demographic data
Demographic data
KOOS = knee injury and osteoarthritis outcome score; FTA = femorotibial angle; ADL = activities of daily living; QOL = quality of life.
Navio® and CORI® (Smith & Nephew, Memphis, TN, USA) surgical systems with a handheld, imageless, and semi-active robotic system were used. This technology for real-time planning and personalized surgery features image-free smart mapping to build 3D models of the joint in surgery without the need for CT/MRI scans [Fig. 1]. The Navio system comprises a robotically controlled handheld burr and a point probe, integrated with a passive infrared camera tracking system and a surgeon-controlled graphical user interface [19]. The CORI system is the successor of the Navio system. The CORI system has been developed to operate within a smaller footprint than earlier generations of robotic systems. This has been combined with a focus on increased workflow efficiency by improving surgical navigation speed through higher-speed camera technology. In both systems, the surgical procedures are similar. The systems offer image-free mapping of bone geometry, intraoperative planning and gap assessment, and confirmation of alignment and knee balance. This study used a component of bi-cruciate substituting (BCS)-TKA (Journey II BCS®; Smith & Nephew, Memphis, TN, USA).

Navio and CORI. (a) 3D model built with image-free smart mapping. (b) Gap assessment before implant planning. (c) Implant planning according to soft tissue balance. (d) Gap assessment after implant placement.
The 3D preoperative planning software (JIGEN®; LEXI, Inc., Tokyo, Japan) was applied for preoperative planning to the femoral and tibial components’ size and default setting position. Notably, the component size and the condylar twist angle between a posterior femoral condyle and a surgical epicondylar axis (SEA) [14] were as crucial as the preoperative planning. The default femoral component position was 0° to a mechanical axis (MA) in coronal alignment, 3° flexion to a MA in sagittal alignment, and 0° to a SEA in rotational alignment. The default tibial component position was 0° to a MA in coronal alignment, 3° posterior inclination to a MA in sagittal alignment, and 0° to an Akagi line [20] or range of motion technique in rotational alignment. Finally, considering the soft tissue balance, the component positions and total lower limb alignment were fine-tuned intraoperatively. The intraoperative fine-tuning is performed in the femur, not in the tibia. Fine-tuning ranges of the femoral component positions were 0–3° varus alignment to a MA (coronal), 0–6° flexion alignment to a MA (sagittal) and 0 ± 3° to an SEA (rotational). The tibial component positions were fixed [0° to a MA (coronal), 3° to a MA (sagittal)]. Tibial rotational alignment was, as mentioned above, determined by 0° to an Akagi line or range of motion technique. As a result, the whole lower limb alignment was determined in the range of 0–3° varus alignment to a MA in coronal alignment. The actual intraoperative procedures were as follows: a medial parapatellar approach was used, all osteophytes except for posterior femoral condyles were resected as feasible, and anterior and posterior cruciate ligaments were resected. Subsequently, intraoperative 3D images were created, the bony reference points were determined, the default component positions were temporarily set, the soft tissue balance was defined by applying manual maximum stress by surgeons, the component positions were fine-tuned considering soft tissue balance, and the bones cut using a handheld end-cutting burr. Finally, the components were set using cement.
Postoperative evaluation was performed by applying varus/valgus stress X-rays in knee extension under anesthesia at manual maximum stress after surgery completion. First, 3D models of the femur and tibia were reconstructed from CT images using 3D visualization and modeling software (ZedView®; LEXI Inc., Tokyo, Japan). The postoperative component positions to bone were calculated from postoperative CT using a 3D–3D image matching technique (JIGEN®; LEXI, Inc., Tokyo, Japan). Subsequently, the relationship (angle and distance) between the 2D stress X-rays and the 3D complex in component and bone models obtained from the 3D–3D image matching technique were calculated three-dimensionally by 3D–2D image matching technique (Zed Motion®; LEXI, Inc., Tokyo, Japan) [Figs 2, 3]. The anatomical and component coordinate systems were established according to the previous studies [5,6]. The component positions relative to the bones were automatically calculated in the spatial relationship between the anatomic coordinate systems and the component coordinate systems.
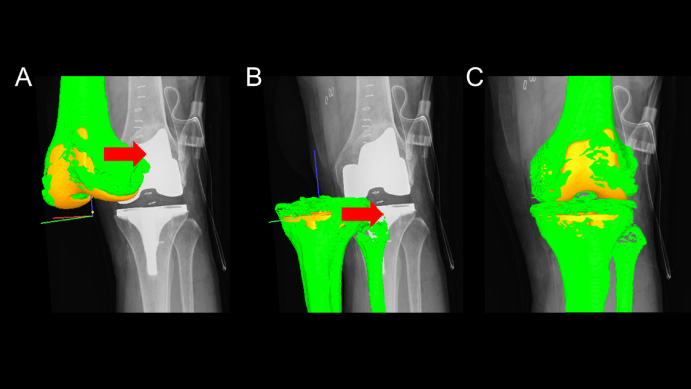
3D–2D image matching of the 3D complex in component and bone models. The contours of 3D complex in postoperative component positions (yellow) and preoperative bone models (green) were manually detected in X-rays in knee extension under anesthesia regarding femur and tibia separately (A and B) and composited into single image (C).
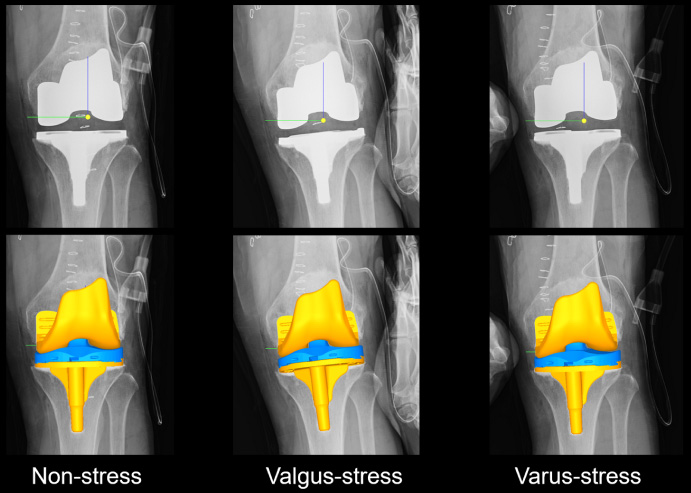
Analysis of relative position between components of femur and tibia. The 3D–2D image matching technique was applied to each X-rays in knee extension under anesthesia at manual maximum varus/valgus stress and non-stress after surgery. Upper pictures were stress x-rays, and lower pictures were result of components position after 3D–2D image matching in non-stress, valgus-stress and varus-stress. The femoral component position was calculated in the coordinate system of the tibial component.
As the evaluation parameters [Figs 4, 5], the joint separation distance between the medial and lateral most distal points of the femoral component and upper surface of the polyethylene insert, which means the thickest part of the medial and lateral parts of the inserts, was defined as the medial joint opening (MJO) and lateral joint opening (LJO), respectively [Fig. 4]. Varus/valgus angle between components (VV angle) was defined as the angle between the line connecting the medial and lateral most distal points of the femoral components and the X-axis of the tibial implant coordinate system when projected onto the tibial implant coordinate system’s coronal plane. The varus (+) and valgus (−) angles indicated the laxity values [Fig. 5]. As approximately 3° of the valgus angle is built in this component’s distal surface, the VV angle minus 3° of the varus angle is considered the substantial laxity angle or the joint gap. However, for easy understanding, the 3° angle is not subtracted this time, and the actual measured varus/valgus angle between components is displayed as the non-stressed VV angle (non-stress VV angle), VV angle in valgus stress (valgus VV angle), and VV angle in varus stress (varus VV angle).
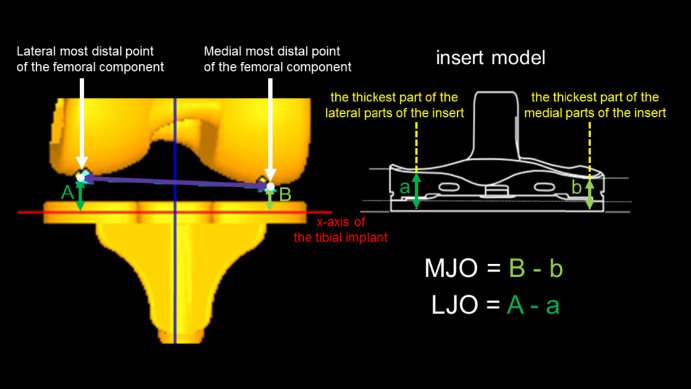
The joint separation distance: the medial joint opening (MJO) and lateral joint opening (LJO). The distance of most distal point of the femoral component from the x-axis of the tibial implant was calculated and subsequently find the difference from the thickness of thickest part of the insert in medial and lateral side.
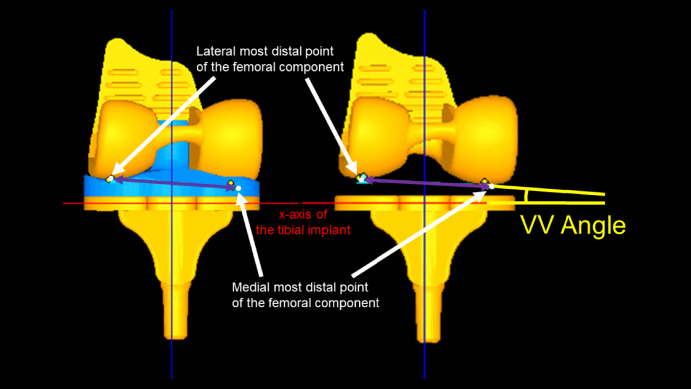
Varus/valgus angle between components: VV angle. The line connecting the medial and lateral most distal points of the femoral component was projected onto the tibial implant coordination system. Varus/valgus angle between components was measured in the tibial implant coordination system.
The Shapiro-Wilk test was used to examine the normality of the data. Correlations were analyzed using Pearson’s product-moment correlation coefficient for the data with a normal distribution or Spearman’s rank correlation coefficient for those without a normal distribution.
For precision and reproducibility, 25 subjects were randomly selected and measured by two researchers, #1 and #2, on different days. Mean, maximum, and 95% CI of the differences in two times measurement for the non-stress VV angle, valgus VV angle, varus VV angle, MJO, and LJO were calculated, respectively. The intra-observer reproducibility was evaluated via the intra-class correlation coefficient by researcher #1. Both researchers measured the inter-observer reproducibility through the inter-class correlation coefficient. In addition, as the absolute reliability, Bland–Altman plots were used to analyze the data manually.
Statistical significance was set at p < 0.05. SPSS software (version 27; SPSS Inc., Chicago, IL, USA) was used.
Results
The demographic data are shown in Table 1. The preoperative and postoperative femorotibial angles (FTA) were 184° and 177°, respectively.
In the precision and reproducibility (Table 2), the mean and maximum differences between the two calculations by the one researcher (intra-precision) were 0.2° and 0.5° in the non-stress VV angle, 0.4° and 3.4° in the valgus VV angle, 0.2° and 0.6° in the varus VV angle, 0.3 mm and 1.1 mm in MJO, and 0.3 mm and 1.1 mm in LJO, respectively. The mean and maximum differences between the two calculations by the two researchers (inter-precision) were 0.2° and 0.7° in the non-stress VV angle, 0.3° and 3.1° in the valgus VV angle, 0.2° and 0.7° in the varus VV angle, 0.3 mm and 0.9 mm in MJO, and 0.3 mm and 1.5 mm in LJO, respectively. The intra-class correlation coefficient by researcher #1 was 0.990 (p < 0.001) in the non-stress VV angle, 0.883 (p < 0.001) in the valgus VV angle, and 0.995 (p < 0.001) in the varus VV angle, 0.946 (p < 0.001) in MJO, and 0.987 (p < 0.001) in LJO respectively. The inter-class correlation coefficient by researchers #1 and #2 was 0.989 (p < 0.001) in the non-stress VV angle, 0.900 (p < 0.001) in the valgus VV angle, and 0.994 (p < 0.001) in the varus VV angle, 0.958 (p < 0.001) in MJO, and 0.974 (p < 0.001) in LJO, respectively. Bland–Altman plots in the inter-test reliability showed no fixed bias in 95% CI (non-stress VV angle, −0.2°–0.0°; valgus VV angle, −0.2°–0.4°; varus VV angle: 0.0°–0.2°, MJO: −0.3 mm–0.0 mm, LJO: −0.2 mm–0.2 mm) and no proportional bias (non-stress VV angle, CC = 0.268, p = 0.194; valgus VV angle, CC = 0.022, p = 0.916; varus VV angle: CC = −0.330, p = 0.107; MJO: CC = 0.008, p = 0.971; LJO: CC = 0.240, p = 0.248).
Non-stress VV angle, valgus VV angle, varus VV angle, MJO, and LJO were 3.6 ± 1.2°, 1.0 ± 1.4°, 7.1 ± 1.9°, 1.5 ± 1.0 mm, and 2.8 ± 2.7 mm respectively (Table 3). There were weak or moderate correlations between the preoperative FTA and each non-stress VV angle (CC = 0.389, p = 0.004), varus VV angle (CC = 0.396, p = 0.004), and LJO (CC = 0.435, p = 0.001) (Table 4).
Precision and reproducibility
Precision and reproducibility
VV angle = varus/valgus angle; valgus VV angle = VV angle in valgus stress: varus VV angle = VV angle in varus stress; MJO = medial joint opening in valgus stress; LJO = lateral joint opening in varus stress.
Evaluation parameters
VV angle = varus/valgus angle; valgus VV angle = VV angle in valgus stress: varus VV angle = VV angle in varus stress; MJO = medial joint opening in valgus stress; LJO = lateral joint opening in varus stress.
Correlation coefficient to preoperative femorotibial angle
VV angle = varus/valgus angle; valgus VV angle = VV angle in valgus stress: varus VV angle = VV angle in varus stress; MJO = medial joint opening in valgus stress; LJO = lateral joint opening in varus stress; ∗ = p < 0.05.
This prospective study’s most important findings were that (1) this three-dimensional measurement method provided sufficient precision and reproducibility, and (2) the rTKAs could achieve good postoperative varus/valgus stability with a small standard deviation.
Stress X-rays in a 2D space have been commonly used to evaluate varus/valgus stability. However, accurate evaluation is, in theory, difficult with X-rays due to the effects of rotation and knee flexion angle. Especially with stress imaging, an inter-observer error is assumingly greater. Ueyama et al. [8] reported that the agreement between 2D and 3D measurements in identifying outliers in a TKA was poor, even on fluoroscopy-guided radiography, and 2D measurements have an inherent risk of misidentifying alignment outliers. Tanifuji et al. [7] showed that 2D evaluation might mask or underestimate the postoperative implant malposition, and 3D evaluation using the coordinates system is necessary to evaluate the component position accurately. In the 3D evaluation based on a coordinate system, the impact of the influence of the posture for subjects and films on the result is minimum, and a more accurate evaluation is probable [7]. However, 3D evaluation under stress is impossible in practice with common modalities like CT. We create a new 3D assessment method of varus/valgus stability after TKA by evaluating dynamic 2D stress X-rays using a 3D–2D image registration technique in this study. This study developed a 3D assessment with excellent precision and reproducibility, demonstrating its validity as a new evaluation method.
The current study exhibited good varus/valgus stability with relatively small variation, whereas they showed weak or moderate correlations with the preoperative varus deformity. It has been reported that the lateral soft tissue is loosened, and the medial soft tissue does not contract as the varus deformity progresses in varus knee OA [21]. However, no consensus exists regarding handling this ligament imbalance caused by loose lateral soft tissue. Suppose the postoperative alignment is set to neutral in a preoperative varus deformity. In that case, the medial release of a knee joint after an osteotomy is necessary to achieve proper gap balance intraoperatively. However, in recent years, the medial loose for varus knee OA caused by medial release has been reported to result in reduced postoperative function and patient satisfaction [22]. The extensive medial release to adjust to the pathologically loose lateral soft tissue would result in using a thicker insert that can cause elevation of the joint line. The looser medial soft tissue creates postoperative instability [22]. It is now standard practice in our manner to minimize medial release or not to perform it. Therefore, the intraoperative osteotomy angle for proper gap balance and alignment is critical. As reported in the functional alignment technique [1], an rTKA enables intraoperative fine-tuning of osteotomy angles and accurate osteotomies, making it possible to obtain proper gap and alignment according to each patient’s conditions. Okazaki et al. [23] examined knee laxity in normal subjects and exhibited that, in extension, the mean angle was 4.9° in varus stress and 2.4° in valgus stress. In flexion, the mean angle was 4.8° in varus stress and 1.7° in valgus stress. Varus laxity was significantly greater than valgus laxity in extension and flexion in normal knees. Tsukiyama et al. [24] demonstrated that, for TKA patients, neither varus joint laxity during knee flexion nor valgus joint laxity during knee extension was associated with a poor postoperative clinical outcome, and varus joint laxity and the standard activity score in the extension had a moderate positive correlation. As the intraoperative joint gap is directly related to postoperative alignment, the joint gap and alignment are two sides of the same coin. This prospective study aimed for a neutral to a mild varus alignment, 1∼2 mm in the medial gap, and <5 mm in the lateral gap in knee extension and could achieve these goals in most cases with the weak or moderate correlations between the lateral gap and the preoperative alignment.
This study had several limitations. First, the presence of cases with varus laxity >5 mm existed. This was unavoidable to fine-tune the osteotomy angle within acceptable postoperative alignment (3°) and patellofemoral alignment (external rotation under the angle between the posterior femoral condyle and clinical epicondylar axis). Second, because an rTKA requires intraoperative planning before femoral posterior condyle osteotomy, the planning must consider the impact of the posterior femoral condyle and posterior osteophyte on the joint gap, which depends on the surgeon’s experienced skill. Third, this study is prospective; however, the sample size is relatively small. Fourth, the study focused on measuring varus/valgus stress X-rays and the intraoperative joint gap, so there was no sufficient postoperative duration and clinical scores. Further studies can help resolve these issues.
Conclusions
The postoperative assessment of the varus/valgus stability in rTKAs by the 3D–2D image registration technique demonstrated good stability with a small standard deviation. The validity showed the measurement’s sufficient precision and reproducibility.
Footnotes
Acknowledgements
The authors would like to thank the entire staff of Niigata Rehabilitation Hospital for their technical support and cooperation.
Conflict of interest
None to report.