
Abstract
BACKGROUND:
This study explores the dynamics of a mathematical model, utilizing ordinary differential equations (ODE), to depict the interplay between cancer cells and effector cells under chemotherapy. The stability of the equilibrium points in the model is analysed using the Jacobian matrix and eigenvalues. Additionally, bifurcation analysis is conducted to determine the optimal values for the control parameters.
OBJECTIVE:
To evaluate the performance of the model and control strategies, benchmarking simulations are performed using the PlatEMO platform.
METHODS:
The Pure Multi-objective Optimal Control Problem (PMOCP) and the Hybrid Multi-objective Optimal Control Problem (HMOCP) are two different forms of optimal control problems that are solved using revolutionary metaheuristic optimisation algorithms. The utilization of the Hypervolume (HV) performance indicator allows for the comparison of various metaheuristic optimization algorithms in their efficacy for solving the PMOCP and HMOCP.
RESULTS:
Results indicate that the MOPSO algorithm excels in solving the HMOCP, with M-MOPSO outperforming for PMOCP in HV analysis.
CONCLUSION:
Despite not directly addressing immediate clinical concerns, these findings indicates that the stability shifts at critical thresholds may impact treatment efficacy.
Keywords
Introduction
Cancer patients often undergo chemotherapy, which employs medications to eradicate cancer cells. Chemotherapy, however, can also damage healthy cells, resulting in unfavourable side effects that can make treatment challenging to endure. As a result, researchers are always seeking methods to minimize the quantity of chemotherapy required while still treating cancer. Developing mathematical models that can forecast how cancer cells and immune cells will react to chemotherapy is one method for improving cancer treatment. To effectively treat cancer, these models can then be used to optimise treatment plans and reduce the amount of chemotherapy required [1–3].
In our prior publication, we presented the successful optimization of chemotherapy drug concentration through the utilization of a multi-objective optimization algorithm based on Swarm Intelligence
In this work, we extend the analysis to find the impact of the control parameter from an earlier modal that was demonstrated in our prior publication. The earlier study examined the dynamics of cancer cell and effector cell populations under chemotherapy treatment using a set of three ordinary differential equations
As the extension of the analysis, the numerical result of the PMOCP and HMOCP is being benchmarked using an evolutionary multi-objective optimisation platform
The subsequent sections of this article are organized as follows: Section 2 presents a comprehensive overview of the control parameter variables examined in this study. Section 3 introduces the model utilized. In Section 4, the methodology employed is elucidated. Section 5 encompasses the results and discussion. Section 6 outlines the conclusions derived from this work, while the references section includes a bibliography.
Control parameter variables
There are various methods for treating cancer, including surgery, radiation, chemotherapy, hormone therapy, and immunotherapy, as well as some combinations of these methods. However, chemotherapy plays a vital role as the treatment method when cancer reaches the metastasis stage. Numerous cancer forms are still difficult to treat, despite substantial breakthroughs in cancer treatment. The challenges in achieving a complete cure or long-term control of cancer are caused by several factors, including the tumour cells’ resistance to therapy, their tendency for recurrence, the limitations of treatment toxicity, inadequate dose administration, and incorrect treatment scheduling [5].
Therefore, the primary emphasis is placed on utilizing an efficient mathematical model to study the dynamic interplay of tumour cells and immune cells in the context of chemotherapy treatment. This mathematical model offers an invaluable foundation for understanding the dynamic behaviour and core mechanisms of this complicated interaction. The accuracy and relevance of the model can be enhanced through the calibration using experimental or clinical data. This calibration process involves the estimation of control parameter variables [6]. Assessing the impact of the control parameter variables enhances the efficacy of chemotherapy. This allows more efficient cancer treatment possible for patients.
The maximum recruitment rate of effector cells by tumour cells (g)
The interplay of tumour cells and the immune system leads to modifications of tumour micromovement. This modification results in acidity caused by changes in nutrient metabolism. Also, this interaction involves a delicate balance between immunosuppressive cells and the tumour itself [7]. The maximum recruitment rate of effector cells by tumour cells (g) is highly variable and dependent on several factors, such as the type of effector cells, the type of tumour, and the environment in which the tumour is situated [8]. Typically, tumour cells can recruit effector cells at a rate of up to 10 to 20% of the total effector cell population [9]. However, this rate can vary depending on the type of effector cell used and the type of tumour targeted. For instance, tumour cells can recruit natural killer
A constant source of effector cells (𝛼1)
The immunological defence against cancer depends heavily on effector cells, including CTLs cells and NK cells. These cells oversee, identifying and removing malignant cells [7]. A constant source of effector cells (𝛼1) is generally provided by the body’s immune system, which can generate effector cells. Examples of these cells are NK cells, CTLs, and macrophages which generated in response to a tumour [11]. The constant influx of effector cells from a variety of sources, such as circulating mononuclear cells in the blood, cells with enhanced pluripotency and tumour-infiltrating lymphocytes are the immune response against cancer cells [12]. This continuous supply of effector cells signifies the strength and effectiveness of a steady and ongoing influx, supporting an optimal immune response to combat tumour cells [13]. Therefore, analysing the impact of the constant source of effector cells enables us to identify the best values for this parameter that support an adequate and effective immune response against cancer.
The model
The model employed in this study encompasses crucial elements related to tumour growth dynamics and immune response dynamics. It is built upon three ordinary differential equations that allow for the tracking of tumour cells, effector cells, and the Circulating Lymphocytes population. Furthermore, the model incorporates the interaction between these cell types and chemotherapy. It considers how chemotherapy impacts the growth and death rates of both the tumour and effector cell populations. By including this interaction, the model facilitates a comprehensive analysis of the impact of chemotherapy on these cell groups’ behaviour in the model. This addition allows for a detailed examination of the influence of chemotherapy on the behaviour and interplay of these cell populations, contributing to a deeper understanding of the dynamics associated with cancer treatment.
The model’s tumour growth component depicts how tumour cells grow and decay over time. It accounts for variables such as the tumour’s pace of growth, its carrying capacity, the percentage of tumour cells that are destroyed by effector cells, and the influence of medication on the development of new tumour cells. The immune response element of the model emphasises the relationship between the immune system and cancer. It considers factors such as the constant source of effector cells and the maximum recruitment rate of effector cells in response to the presence of tumour cells. Additionally, the model accounts for the regression of effector cells through mass action dynamics induced by tumour cells and the fraction of effector cells affected by chemotherapy.
The model provides valuable insights into the influence of chemotherapy on the immune system and its impact on patient well-being by incorporating the dynamics of Circulating Lymphocytes. The model includes parameters such as the constant source of Circulating Lymphocytes and the death rate of Circulating Lymphocytes, allowing for a comprehensive assessment of the treatment’s efficacy and any potential adverse effects on the patient’s overall health. By considering the dynamics of Circulating Lymphocytes, the model offers a means to monitor the patient’s immune response and evaluate the treatment’s effects on their general state of health.
As elaborated in the previous study [4], the mathematical model used in this study integrates all mentioned terms forming following ordinary differential equations. The mathematical model can be represented by the following set of ordinary differential equations:
The qualitative mathematical model shown in Eqs (1) through (3) uses estimated parameter values from the literature rather than actual experimental findings and is not specific to any one type of malignant tumour [2]. This study’s main objective is to investigate the Optimal Control Problem
Efficient chemotherapy treatment strategies hinge on the meticulous identification and comprehensive understanding of the stability of equilibrium points within the system. The significance of stable equilibrium points lies in their indication of the system’s robust ability to recover after minor disturbances, while the presence of unstable equilibrium points can lead to severe consequences, such as patient mortality [14]. Therefore, a meticulous analysis of the stability of equilibrium points is paramount in the design of effective chemotherapy treatments and the refinement of cancer therapy approaches. These equilibrium states denote conditions of stability, wherein the concentrations of tumour cells, immune cells, and drug remain constant over time. The importance of stability extends to shaping the long-term behaviour of the system and influencing the efficacy of chemotherapy in restraining tumour growth [15]. Thus, a profound understanding of equilibrium point stability becomes a cornerstone for the development of effective chemotherapy treatments and the continual improvement of cancer therapy strategies.
When the stability state undergoes a transition from a condition of stability to one of instability, it serves as a critical indicator that the equilibrium point is no longer equipped to effectively regulate the proliferation of tumour cells, potentially triggering a deviation from the desired stable state [16]. The clinical implications of this transition are profound, as it can lead to the failure of chemotherapy treatment, fostering further progression of the disease. The meticulous analysis of stability unveils the pivotal role played by the equilibrium point representing a tumour-free state. The stability of this specific equilibrium point is indispensable; its transition to instability signifies a critical turning point where chemotherapy treatment loses its effectiveness in controlling tumour growth. This underscores the urgency for alternative treatment approaches to be explored and implemented. Consequently, a nuanced understanding of the stability of equilibrium points in cancer models emerges as a vital aspect for the comprehensive evaluation of the effectiveness and success of diverse treatment strategies [17].
In the specific context of this study, the term ‘stability point’ pertains to the intricate equilibrium states within the mathematical model. The utilization of mathematical models holds paramount importance, serving as a critical tool for the comprehensive evaluation of chemotherapy effectiveness in treating tumours. Furthermore, these models play a pivotal role in the in-depth analysis of equilibrium state stability and symmetry. The incorporation of sensitivity analysis becomes indispensable in this regard, as it facilitates the identification of critical model parameters that exert a more pronounced impact on the dynamics of the model compared to others [18].
Theoretical outcomes derived from this research not only offer predictions for the formulation of innovative treatment plans but also contribute valuable insights into the underlying mechanisms of tumour growth and the development of drug resistance. It is noteworthy that, while the immediate focus of this research may not directly align with clinical issues, the gained insights provide a foundation for guiding the development of novel treatment strategies. This broader perspective becomes crucial in shaping future approaches to tackling clinical challenges associated with tumour growth and drug resistance.
To comprehend the dynamics of the model represented by Eq. (1)–(3), it is important to identify the equilibrium points since they provide insight into the system’s steady-state behaviour. The steady-state also known as the equilibrium point is the derivative of the variable when no changes occur over time. At
The Jacobian matrix for Eq. (1)–(3) is given by
The unstable nature of the tumour-free equilibrium implies that the tumour can evade immune monitoring until every single tumour cell is eliminated. Achieving a realistic cure, therefore, requires not only reducing the tumour burden but also modifying the system parameters themselves [12]. In this setting, chemotherapy treatment has a major impact by altering the ODE models variables, such as permanently modifying the maximum recruitment rate of effector cells by tumour cells (g) or the constant source of effector cells (𝛼1). These changes should effectively control or eliminate the tumor growth.
This study aimed to utilize the mathematical model described by Eqs (1)--(3) to reduce tumour growth by employing minimal chemotherapy drugs, while simultaneously maintaining a healthy level of the effector cell population. This MOCP is classified into two categories: PMOCP and HMOCP. In the case of HMOCP, the MOCP is solved using Hybrid Method (HM). Conversely, for the PMOCP, the Pure MOCP Method (PMM) is employed. These methods, HM and PMM, are designed to handle constraints in different ways. The HM utilizes the Indirect method, incorporating the Augmented Hamiltonian (AH) approach to effectively handle constraints. On the other hand, the Penalty method is utilized for the PMOCP, with detailed information available in [1].
The numerical outcomes obtained from the HM and PMM were further processed using the open-source platform called PlatEMO. This platform is specifically designed for addressing complex optimization problems, offering a diverse range of metaheuristic algorithms, such as evolutionary, swarm intelligence, multi-objective optimization, and surrogate-assisted optimization algorithms [23]. This study utilized PlatEMO to explore and utilize a wide range of metaheuristic optimizers, including Swarm Intelligence algorithms and Evolutionary Algorithms. PlatEMO served as a valuable platform for leveraging these optimization algorithms and their capabilities to tackle complex optimization problems efficiently and effectively. The SI and EA algorithms such as Multi-Objective Particle Swarm Optimizer (MOPSO), Modified Multi-Objective Particle Swarm Optimizer (M-MOPSO), Multi-Objective Evolutionary Algorithm based on decomposition (MOEAD), and Multi-Objective Differential Evolution (MODE) were incorporated. Furthermore, PlatEMO was also utilized to benchmark the numerical outcomes obtained from these SI and EA algorithms. The benchmarking process involved comparing the results with various Multi-Objective Genetic Algorithms, including Non-Dominated Sorting Genetic Algorithm II (NSGAII), Strength Pareto Evolutionary Algorithm 2 (SPEA2), Pareto Envelope-Based Selection Algorithm II (PSEA-II), as well as Many-Objective Genetic Algorithms such as Non-Dominated Sorting Genetic Algorithm III (NSGAIII), and Multi-Objective Differential Algorithms like Generalized Differential Evolution 3 (GDE3) and MOEAD Based on Differential Evolution (MOEAD DE) [24].
In this study, the Pareto front and Hypervolume (HV) Indicator were utilized to assess the performance and effectiveness of the different algorithms in solving MOCP. These metrics were generated using PlatEMO. Given that MOCP involves a collection of non-inferior optimal solutions that demonstrate the balance between competing objectives, the Pareto front is used to represent the set of non-dominated solutions [25]. On the other hand, the HV Indicator serves as a measure for evaluating and comparing the quality of the objective space dominated by the Pareto front [26]. It quantifies how effectively the solutions generated by the multi-objective optimizer span the objective space. By assessing the HV Indicator, the study aimed to gauge the extent to which the solutions obtained effectively span and cover the objective space, thereby reflecting the overall quality and the efficacy of the multi-objective optimization [27]. The flowchart presented in Fig. 1 visually illustrates the process employed in this study.
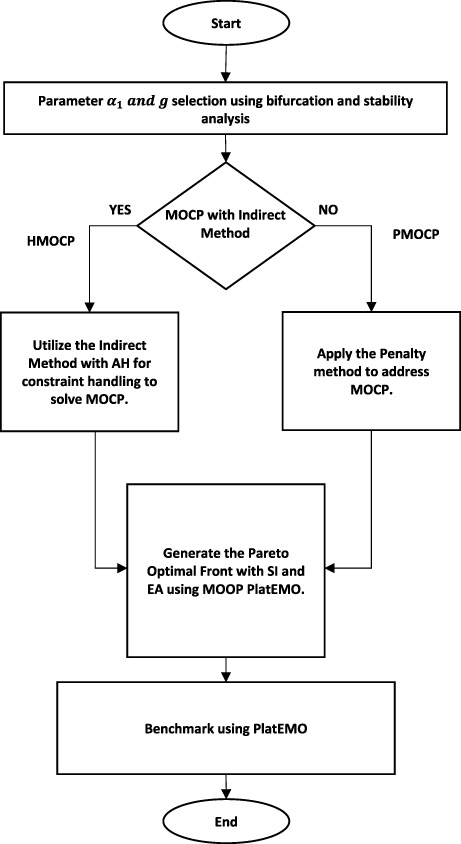
The methodology employed in this work.
The examination of the mathematical model outlined in Section 3 at its equilibrium state facilitates a deeper understanding of its behaviour. Within the model’s equilibrium state, two distinct categories can be identified: equilibrium points and limit cycles. To comprehend the dynamics and characteristics of the model, it is vital to analyse the stability of these equilibrium points and investigate the influence of control parameters. By conducting this analysis, valuable insights can be gained regarding the system’s behaviour and the impact of various factors on its stability and behaviour. Stability analysis entails computing the eigenvalues of the Jacobian matrix obtained through linearization [28]. If every eigenvalue has a real component with a negative sign, the stationary point is stable. However, the stationary point is unstable, and if any of the eigenvalues have a positive real portion.
In this study, a comprehensive stability analysis was performed on a new set of equilibrium points by systematically increasing the maximum recruitment rate of effector cells by tumour cells (g) and a constant source of effector cells (𝛼1). The stability of these equilibrium points was determined by evaluating their eigenvalues. Additionally, the technique of bifurcation analysis was employed to investigate the qualitative behaviour of the ODE model as the control parameters were varied. The resulting bifurcation analysis outcomes are illustrated in Fig. 2, providing valuable insights into the system’s behaviour and the effects of parameter variations.
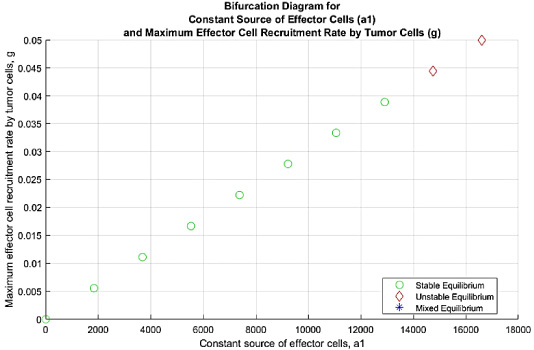
Bifurcation diagram showing the effect of varying the maximum recruitment rate of effector cells by tumour cells (g) and a constant source of effector cells (𝛼1).
As the control parameter value of g and 𝛼1 increased while maintaining setting the value of the chemotherapy drug at a minimal level (M = 0), it was observed that the eigenvalues of the model became unstable after reaching a bifurcation point at g = 3.88 ×10⁻² and 𝛼1 = 1.29 ×10⁴. This suggests that beyond this value, the equilibrium state of the model becomes unstable, which can potentially impact the efficacy of chemotherapy in reducing tumour cell growth.
Therefore, in this study, the control parameter g and 𝛼1 were specifically set to g = 3.88 ×10⁻² and 𝛼1 = 1.29 ×10⁴ to examine their effectiveness in reducing tumour cell growth using HM and HMM. The numerical outcomes of HM and PMM were further assessed using a range of SI algorithms, EA and benchmarked with Genetic Algorithms
The simulation for benchmarking in this study was conducted using PlatEMO 4.0, an open-source platform builds on MATLAB. PlatEMO 4.0 provides wide range of metaheuristic optimization algorithms in the form of source codes (.m files) and datasets (.mat files) [23]. To perform the benchmarking test in a fair environment, the user-defined MOCP formulations, namely PMOCP and HMOCP, were coded to fit the PlatEMO platform. While PlatEMO already offers various cutting-edge metaheuristic optimization algorithms [29], the MODE algorithm was not originally defined. However, due to the flexible architecture of the PlatEMO platform, a user-defined algorithm can be added to it. The PlatEMO provides a professional graphical user interface (GUI) to configure required settings and perform simulation tests.
The general settings, as listed in [30], were adjusted as described in Table 1. For a quantitative comparison of the numerical solutions obtained by the metaheuristic optimizers in this study, the HV indicator was selected. Widely recognized in the literature, the HV indicator relies exclusively on Pareto dominance to assess the quality of solution sets [31]. Given its suitability for this purpose, the HV indicator serves as an appropriate choice to evaluate how well metaheuristic optimizers approximate the Pareto front.
The PlatEMO general setting
HV values of metaheuristic optimizer
Table 2 presents the Hypervolume indicator values for various metaheuristic optimization algorithms, including SI, EA, and Genetic Algorithms. The table includes the mean and standard deviation of the HV indicator along with the results of the Wilcoxon rank sum test (WRST). The symbols ‘ ≈’, ‘+’, and ‘−’ in the WRST column indicate whether the result is numerically similar, remarkably superior, or noticeably weaker compared to the control column [31].
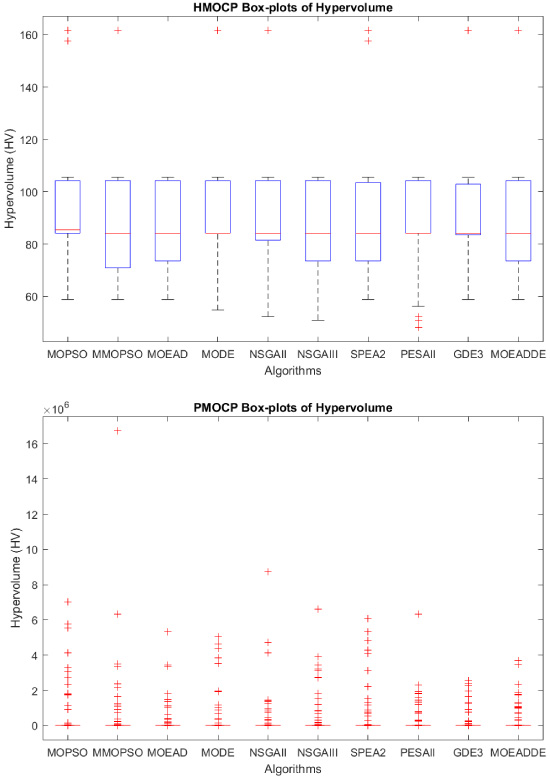
Boxplot of the Hypervolume for HMOCP and PMOCP.
The results indicate that the MOPSO algorithm, used for HMOCP, outperforms the M-MOPSO, MOEAD, MODE, NSGAII, NSGAIII, SPEA2, PESAII, GDE3, and MOEADDE algorithms in relation to the HV indicator. Conversely, the M-MOPSO algorithm, employed for PMOCP, outperforms the other metaheuristic optimization algorithms listed in Table 2.
The boxplots shown in Fig. 3 depict the spread HV performance indicator and it provides clear evidence that, overall, the PMM approach outperforms the HM approach. The HV values obtained from 200 runs for each algorithm are depicted, allowing for a visual comparison of their performance. The boxplots depict the median, which is represented by the line within the box, the top and bottom edges to illustrate the interquartile range, and any potential outliers to showcase the distribution of the HV values [32]. The PMM appears to have a wider quartile range, which points to its greater ability to produce results that are nearer the genuine Pareto front. The outcome indicates that M-MOPSO for the PMM approach is more successful in establishing a better trade-off between conflicting objectives in this study.
This study extends the analysis of a mathematical framework that describes the interplay between tumour cells, effector cells, and circulating lymphocytes. The model, presented in Section 3, encompasses these cell populations without specifying any particular type. Through stability analysis, it was observed that the model remains stable at the tumour-free steady state under the influence of the chemotherapy drug. However, the equilibrium point becomes unstable when the drug threshold is set to its minimum value.
To further investigate the stability of the model’s equilibrium state, a bifurcation analysis was conducted on the control parameters: the maximum recruitment rate of effector cells by tumour cells (g) and the constant source of effector cells (𝛼1). Using the findings from the stability analysis, a fresh set of control parameter values was selected to solve the HMOCP and PMOCP problems in this study. These parameters were utilized in simulations performed using the PlatEMO platform, which offers a diverse range of cutting-edge metaheuristic optimization algorithms for benchmarking purposes.
In this study, ten algorithms were benchmarked: MOPSO, M-MOPSO, MOEAD, MODE, NSGAII, NSGAIII, SPEA2, PESAII, GDE3, and MOEADDE. A quantitative comparison of these algorithms’ performance was conducted using the hypervolume performance indicator. The benchmarking results demonstrated that M-MOPSO, when applied to the PMM approach, outperformed HM when employing the same algorithm. Both HM and PMM underwent 200 runs under fair conditions using the PlatEMO platform, ensuring that all metaheuristic optimization algorithms discussed in this study had an equal computational budget during the simulations.
In a broader theoretical context, the findings of this study unveil clinical relevance by offering valuable insights into the dynamics of tumour growth under the influence of chemotherapy. The observed transitions in stability of equilibrium points highlight critical thresholds that may significantly impact the efficacy of chemotherapy treatments. It is acknowledged that, while the immediate focus of this research may not seamlessly align with clinical issues, the gained insights provide a theoretical foundation for guiding the development of innovative treatment plans and addressing challenges associated with tumour progression and drug resistance in clinical settings. Advancements in understanding through mathematical modelling and computational analyses contribute to laying the groundwork for future strategies in clinical oncology.
Footnotes
Conflict of interest
The authors declare that they have no conflict of interest.
Funding
This work was supported in part by the University of Malaya International Collaboration Grant, University of Malaya, Malaysia, under Grant ST023-2022; in part by the Centre for Advanced Electrical and Electronic Systems (CAEES), Faculty of Engineering, Built Environment & Information Technology, SEGi University. The authors extend their appreciation to the Deanship of Scientific Research at King Khalid University for funding this work through the Small Group Research Project under grant number RGP.1/330/44.