
Abstract
BACKGROUND:
The short foot (SF) exercise is a strengthening exercise for the intrinsic foot muscles that is difficult to master.
OBJECTIVE:
To examine the effect of three different electromyographic (EMG) biofeedback methods on learning the SF exercise.
METHODS:
Thirty-six healthy subjects were randomly allocated to the control group (CTG), EMG-controlled electrical stimulation group (ESG), visual EMG biofeedback group (VSG), and combination EMG-controlled electrical stimulation with visual EMG biofeedback group (CBG). The CTG practiced the SF exercise for 5 minutes using the conventional method. The other groups each used the EMG biofeedback method and the conventional method. The EMG activity of the abductor hallucis (ABH), the medial longitudinal arch (MLA) angle, and the foot length during the SF exercise were measured before and after 5 minutes of practice.
RESULTS:
The EMG activity of the ABH in the VSG and CBG was significantly higher than that before practice. There were no intergroup differences in MLA morphology.
CONCLUSIONS:
These results suggest that visual EMG biofeedback is an effective method of increasing the EMG activity of the ABH during the SF exercise in a short practice time.
Introduction
Loss of medial longitudinal arch (MLA) height has been described as a significant etiologic factor for several injuries of the lower-extremity such as plantar fasciitis [1] and medial tibial stress syndrome [2, 3]. Many previous studies reported that the posterior tibialis [4, 5], spring ligament, and plantar fascia [6, 7] are principal components that provide the MLA with sufficient stability. However, several authors recently reported that the intrinsic foot muscles also have the capacity to support the MLA.
Subject characteristics by group
Subject characteristics by group
CTG, control group; ESG, EMG-controlled electrical stimulation group; VSG, visual EMG biofeedback group; CBG, combination group.
The abductor hallucis (ABH) is the most medial muscle within the first layer of the intrinsic muscles of the plantar surface of the foot and one of the MLA support muscles. Previous studies reported that weakening of the ABH simulated by a tibial nerve block [8] and fatigue-inducing exercise [9] led to a significant decrease in MLA height as assessed by navicular drop. Moreover, it was reported that reinforcement of the ABH simulated by intramuscular electrical stimulation counteracted MLA compression under a load [10]. These results suggest that strengthening exercises for the intrinsic foot muscles, especially the ABH, may prevent overuse injuries related to MLA height loss.
The short foot (SF) exercise is often prescribed and performed in the sport and rehabilitation field to strengthen the intrinsic foot muscles. This exercise is performed to activate the intrinsic foot muscles by pulling the metatarsal heads toward the heel without curling the toes. A previous study [11] reported that the electromyographic (EMG) activity of the ABH during the SF exercise was 45.2
EMG biofeedback is a method of retraining the muscle by creating new feedback systems as a result of the conversion of EMG signals in the muscle into recognizable signals such as visual and auditory signals. This technique has been used to teach patients how to control the activities of the pelvic floor muscles [14]. Furthermore, a novel method called EMG-controlled electrical stimulation, a combination of EMG biofeedback and electrical stimulation therapy, can stimulate the target muscles in proportion to the EMG activity picked up from the same muscles [15]. Previous studies reported that EMG-controlled electrical stimulation effectively improved the upper-extremity motor functions of patients with chronic stroke [15, 16]. Although there are several EMG biofeedback methods that may help patients learn how to control the activities of the intrinsic foot muscles, no study to date has used EMG biofeedback to facilitate learning of the SF exercise.
This study aimed to examine the effect of the EMG biofeedback methods on the learning of the SF exercise. We hypothesized that: (1) compared with conventional methods where oral feedback and demonstration are provided to guide the correct motion of the SF exercise, the additional use of EMG biofeedback effectively facilitates learning of the SF exercise as assessed by the EMG activity of the ABH as well as the MLA morphology during the SF exercise, and (2) this effect is altered by the methods used during EMG biofeedback.
Subjects
Thirty-six healthy subjects participated in this study. The exclusion criteria included any sign of lower-limb pain, foot and ankle contracture, history of foot and ankle surgery, neurologic disease, cognitive impairment, and pacemaker use. In addition, subjects with previous personal experience with the SF exercise were excluded. The subjects were randomly allocated to the control group (CTG); EMG-controlled electrical stimulation group (ESG); visual EMG biofeedback group (VSG); or combination group (CBG), which used a combination of EMG-controlled electrical stimulation and visual EMG biofeedback. The subjects’ details by group are shown in Table 1. This study was approved by the Ethics Committee of the Prefectural University of Hiroshima, and written informed consent was obtained from all subjects.
Instruments
We used the TeleMyo 2400 EMG instrument (Noraxon, Scottsdale, AZ, USA) to collect the EMG data. The sampling rate was 1000 Hz and disposable Ag-AgCl electrodes (Ambu, BlueSensor, Denmark) were used. The raw signal was filtered using a bandpass digital filter (Lancosh FIR) at 20–400 Hz. The root-mean-square values were calculated with a moving window of 50 ms. The EMG data were analyzed using the MyoResearch Master Edition 1.07 XP software (Noraxon, Scottsdale, AZ, USA). The VICON system (Oxford Metrics, Oxford, UK), which was used to measure the MLA morphology, comprised 12 MX-T20S cameras running at 100 Hz. An IVES+ GD-611 instrument (OG Wellness, Okayama, Japan) provided the EMG biofeedback. This device has three surface electrodes and the same surface electrodes detect the EMG signals in the target muscles and provide the electrical stimulation. This device delivers biphasic square-wave pulses (50-
The IVES+ GD-611 instrument.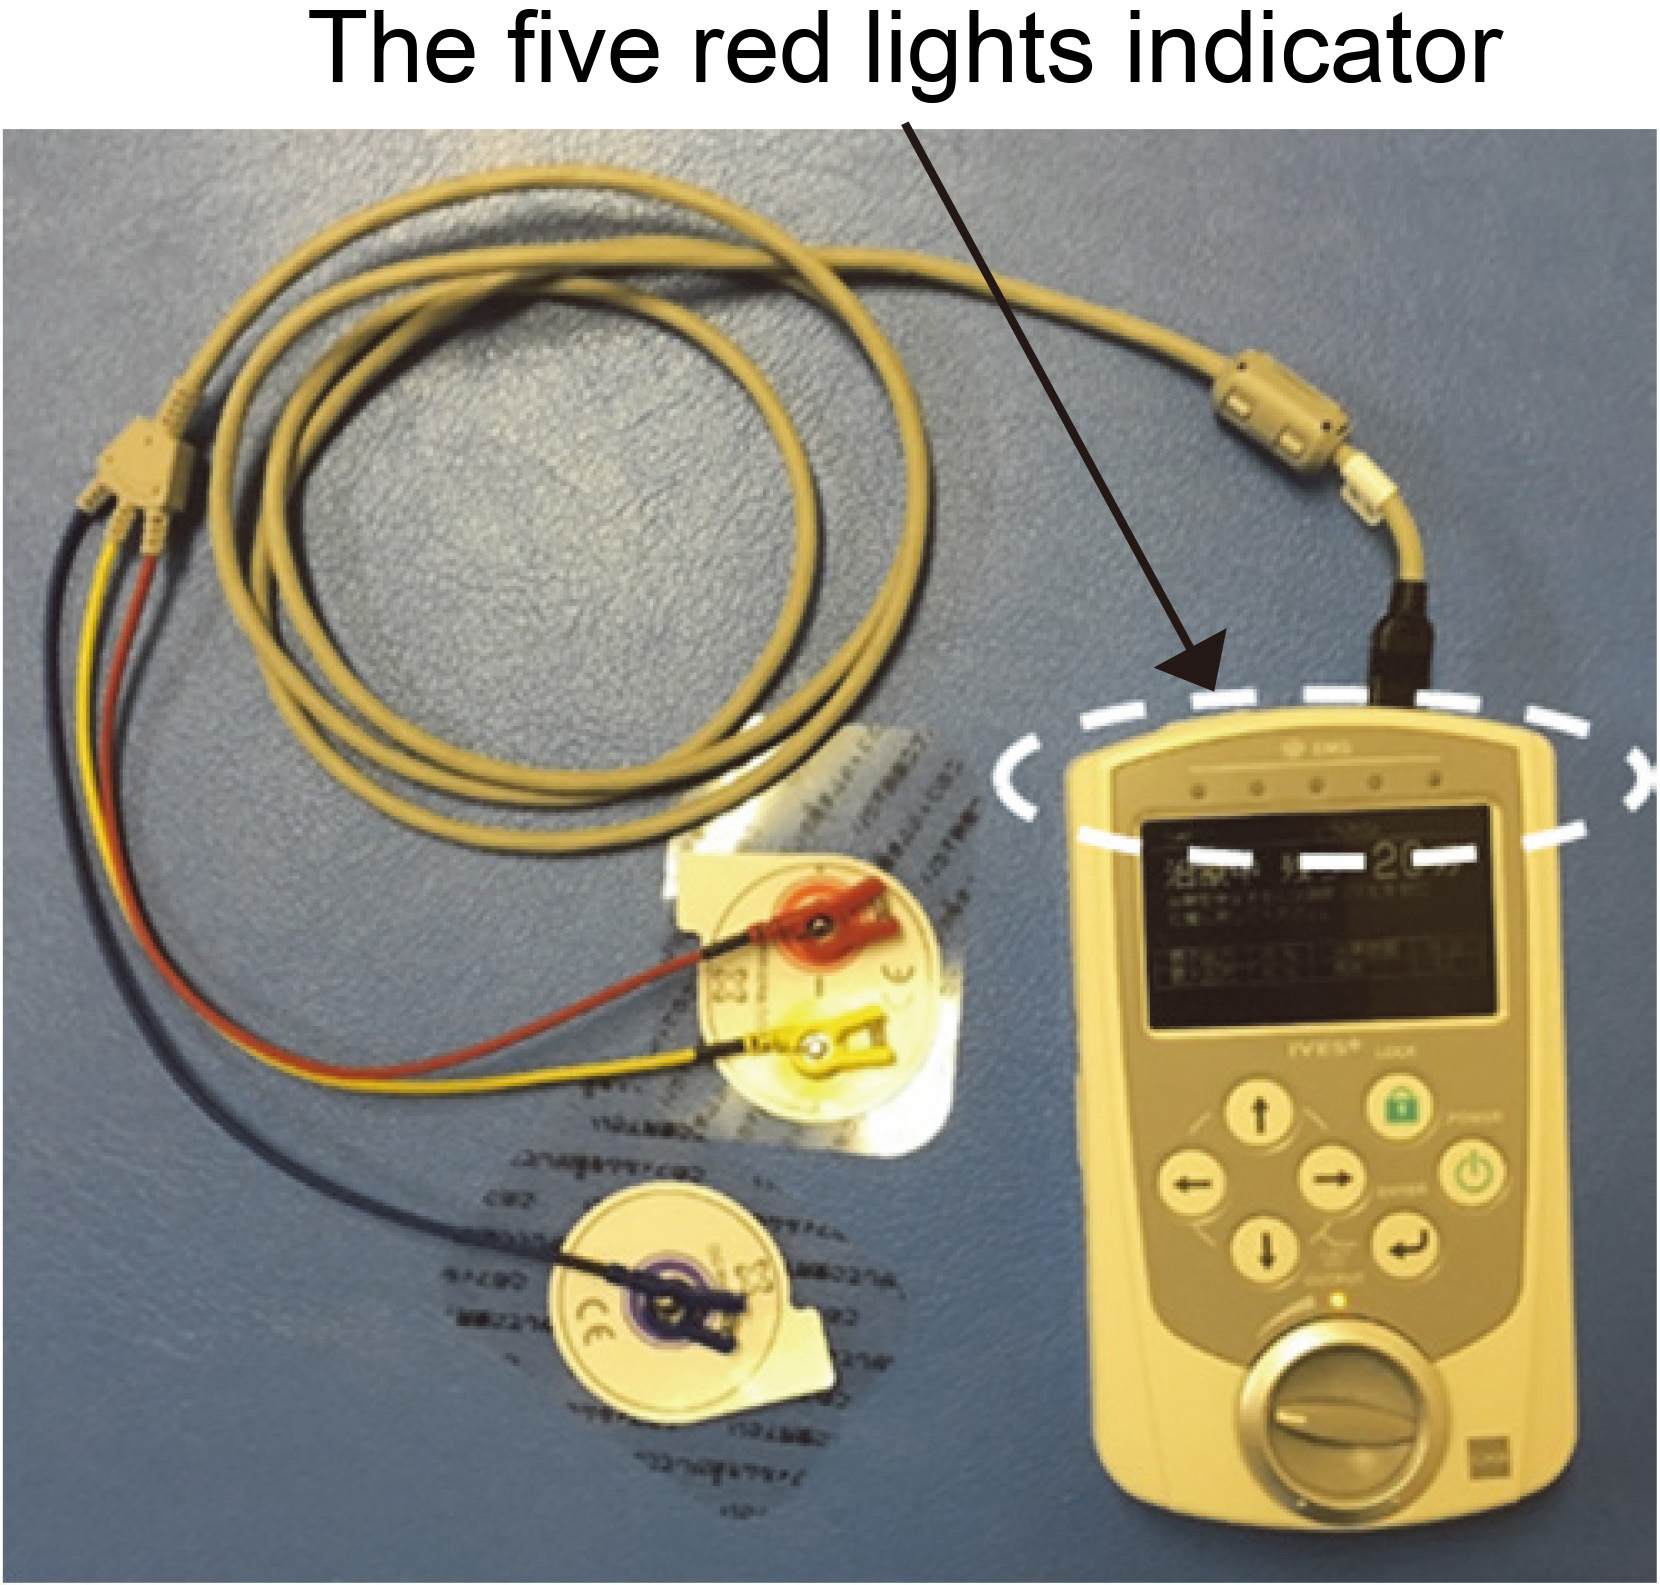
The muscle belly of the ABH on the non-dominant foot was palpated, debrided, with fine sandpaper, and cleaned thoroughly with isopropyl alcohol. Three EMG electrodes were placed on the skin 1–2 cm apart and parallel to the muscle fiber orientation of the ABH. The proximal two electrodes were used to detect the EMG data (Fig. 2a), while the distal one was used only when the EMG-controlled electrical stimulation was provided (Fig. 2b). A ground electrode was placed on the lateral malleolus. For normalization of the EMG data, the maximum voluntary isometric contraction (MVIC) of the ABH was measured in the manual muscle-testing position.
Methods used to detect electromyographic (EMG) data (a) and provide EMG-controlled electrical stimulation (b). (a) Electromyographic (EMG) activity of the abductor hallucis was detected from the proximal two electrodes using the TeleMyo 2400 EMG instrument. (b) The EMG-controlled electrical stimulation was provided via all three electrodes using the IVES+ GD-611 instrument. The distance between electrodes was 1–2 cm adjusted for foot size.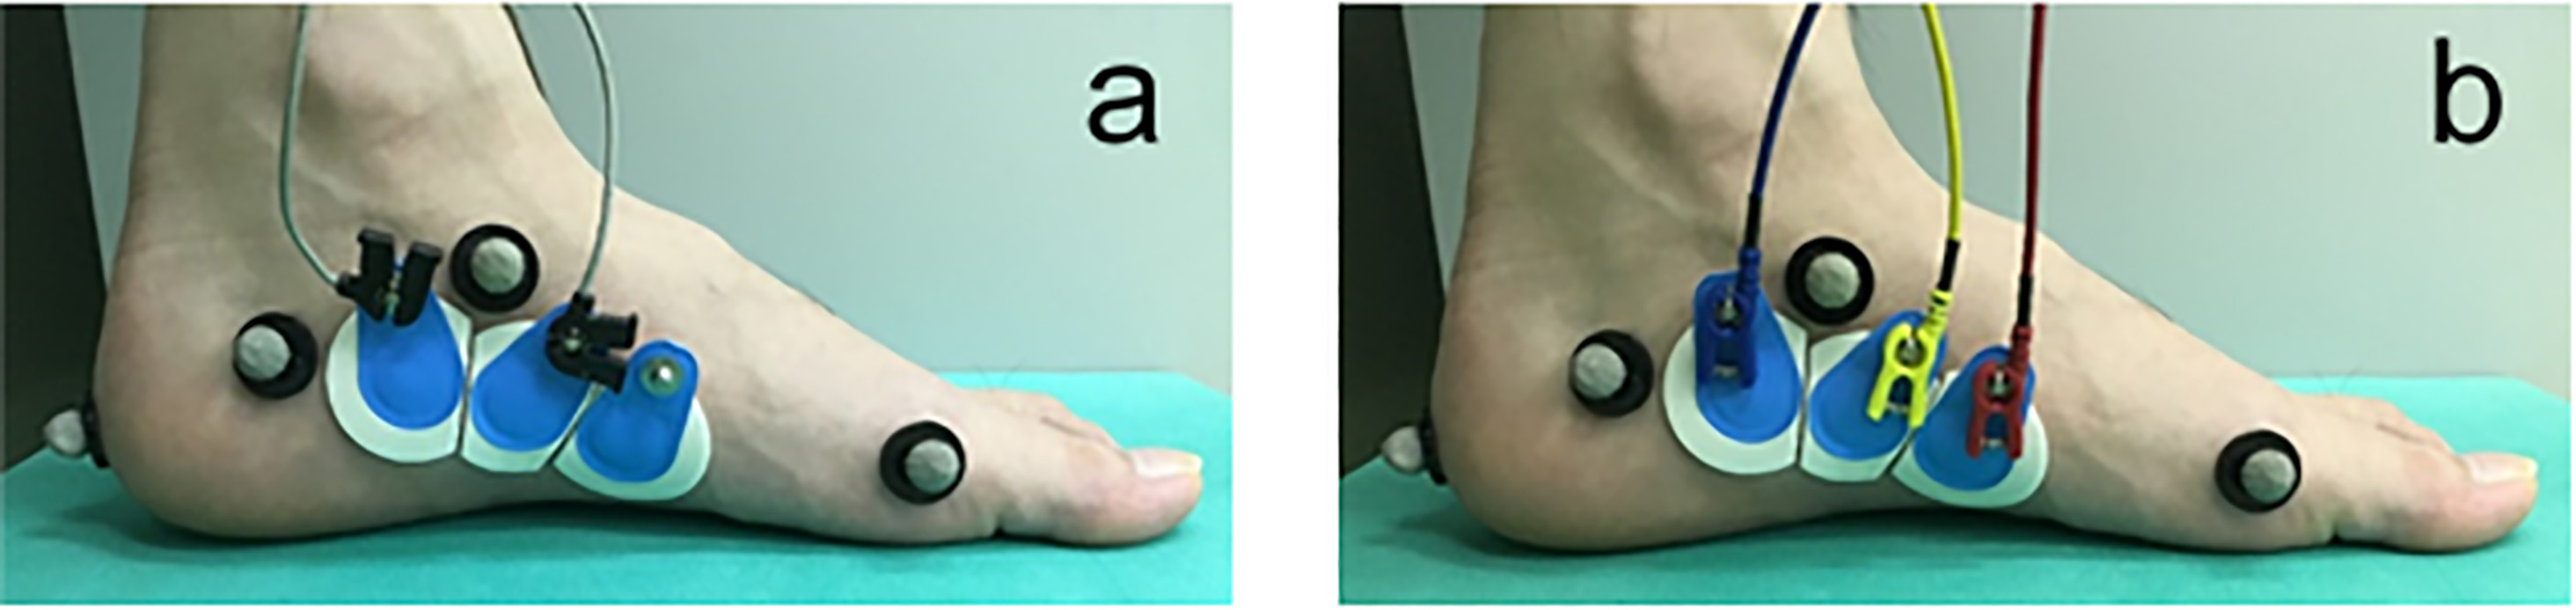
To measure MLA morphology, which included MLA angle and foot length, reflective markers (9.5 mm in diameter) were attached to the skin overlying five anatomic points: navicular tuberosity (NAV), medial aspect of the first metatarsal head (1 MH), lateral aspect of the fifth metatarsal head (5 MH), distal end of the calcaneus (DCA), and medial side of the calcaneus (MCA). In accordance with the previous study [11], the MCA marker was placed 30 (women) or 40 (men) mm from the most posterior part of the calcaneus and 30 (women) or 35 (men) mm from the floor. In this study, the MLA angle was defined as the angle between the 1 MH, NAV, and MCA markers in a perpendicular plane to the plantar plane of the foot bisecting markers on the 1 MH, 5 MH, and DCA. This perpendicular plane incorporated the 1 MH and MCA markers (Fig. 3). Foot length was defined as the distance between the 1 MH and DCA markers (Fig. 3).
The definitions of MLA angle and foot length. MLA angle: The angle between the 1 MH, NAV, and MCA markers in a perpendicular plane to the plantar plane of the foot bisecting markers on the 1 MH, 5 MH, and DCA. This perpendicular plane incorporated the 1 MH and MCA markers. Foot length: Distance between the 1 MH and DCA markers. MLA, medial longitudinal arch; 1 MH, medial aspect of the first metatarsal head; NAV, navicular tuberosity; MCA, medial side of the calcaneus; 5 MH, lateral aspect of the fifth metatarsal head; DCA, distal end of the calcaneus.
Following these preparations, verbal instructions and a demonstration of the SF exercise were given to each subject using a movie. In this study, all SF exercises were performed in the sitting position. The subject was asked to shorten the foot in the anteroposterior direction and actively attempt to bring the head of the first metatarsal toward the heel without toe flexion. The forefoot and heel were kept on the floor during the SF exercise [11, 13]. Subsequently, baseline measurements were performed before the subject practiced the SF exercise. The subject was instructed to perform the SF exercise with maximum effort and hold the contraction for 5 seconds before relaxing. The EMG activity of the ABH and MLA morphology were then measured. This trial was repeated three times, and there was a 60-second interval between trials. In each trial, each parameter of the intervals, excluding the first and last second of the 5-second recording, was averaged. The mean value of the three trials was used in the statistical analysis. Upon completion of the baseline measurements, the subject practiced the SF exercise for 5 minutes. The following methods were used in each group. The 5-minute practice consisted of 30 repetitions of the SF exercise; each repetition was held for 5 seconds. We used this amount of practice because it was equivalent to a training session in a previous intervention study [12]. After 5 minutes of practice, the measurements of the EMG activity of the ABH and the MLA morphology were repeated.
The CTG practiced the SF exercise using the conventional method in which the principal investigator provided oral feedback and demonstration, leading to the correct motion of the SF exercise. These directions were provided to the other groups as well.
ESG practice method
The ESG practiced the SF exercise using the EMG-controlled electrical stimulation in which the muscle activity level of the ABH was conveyed to the subject by the intensity of the electrical stimulation that was in proportion to the EMG activity picked up from the ABH. The maximum stimulation intensity was determined to be the threshold that each subject could endure without feeling pain. The IVES+ GD-611 instrument has five red light indicators that shine gradually from 0 to 5 according to EMG activity intensity of the target muscle. When all five red lights flashed, the maximum electrical stimulation intensity was reached. Before the practice, we adjusted the sensitivity of this indicator to shine all lights when the subject performed the MVIC of the ABH and to shine no light when there was no voluntary isometric contraction. This indicator was concealed from the subjects in this group.
VSG practice method
The VSG practiced the SF exercise using visual EMG biofeedback, where the muscle activity level of the ABH was conveyed to the subject by the indicator with the five red lights. The sensitivity of this indicator was adjusted as with the ESG, but the maximum stimulation intensity was 0, meaning that electrical stimulation was not provided in this group.
CBG practice method
The CBG practiced the SF exercise using the EMG-controlled electrical stimulation and visual EMG biofeedback, in which the subject was provided the EMG-controlled electrical stimulation as with the ESG but the indicator with five red lights was not concealed.
Data analysis and statistics
Mixed-model repeated-measures analyses of variance (ANOVAs) were used to assess statistical significance in the EMG activity of the ABH, MLA angle, and foot length with the within-subject factor being time (pre-practice vs. post-practice) and the between-subject factor being group (CTG, ESG, VSG, and CBG). If there was a significant interaction (time
Results
No remarkable differences were noted in patient characteristics among the four groups (Table 1). The data measured at pre- and post-practice in all groups are shown in Table 2. Table 3 represents the amount of change in each parameter resulting from 5 minutes of practice provided for the SF exercise.
EMG activity of the ABH, MLA angle, and foot length by group at pre- and post-practice
EMG activity of the ABH, MLA angle, and foot length by group at pre- and post-practice
CTG, control group; ESG, EMG-controlled electrical stimulation group; VSG, visual EMG biofeedback group; CBG, combination group; ABH, abductor hallucis; MVIC, maximum voluntary isometric contraction; MLA, medial longitudinal arch.
Change in variables after 5 minutes of practice of the short foot exercise
CTG, control group; ESG, EMG-controlled electrical stimulation group; VSG, visual EMG biofeedback group; CBG, combination group; ABH, abductor hallucis; MVIC, maximum voluntary isometric contraction; MLA, medial longitudinal arch.
Tukey’s honest significant differences post hoc test comparing group differences in change in EMG activity of ABH after 5 minutes of practice of the short foot exercise
CI, confidence interval; CTG, control group; ESG, EMG-controlled electrical stimulation group; VSG, visual EMG biofeedback group; CBG, combination group; ABH, abductor hallucis; MVIC, maximum voluntary isometric contraction.
A significant effect of time on the EMG activity of the ABH (
The MLA morphology
Table 2 shows that, time but not group had a significant effect on foot length (
Discussion
The main finding of this study was that the additional use of visual EMG biofeedback could increase the EMG activity of the ABH during the SF exercise, despite a very short practice time. Although visual EMG biofeedback could not change the MLA morphology because the primary purpose in the SF exercise is to strengthen intrinsic foot muscles, we should pay more attention to the EMG activity of the ABH. In previous studies, much practice time was provided to allow mastery of the SF exercise, ranging from 1 hour [12] to 2 weeks [11, 13]. Although the practice time in this study was obviously shorter than in those, the VSG and CBG had increased EMG activity of the ABH, while in the CTG, in which the subjects practiced the SF exercise using the conventional method, the EMG activity of the ABH did not increase. Moreover, the EMG activity of the ABH in the VSG and CBG at post-practice (44.1
The EMG-controlled electrical stimulation was effective for motor learning of a paretic wrist and finger [15, 16]. However, in this study, ESG did not show increased EMG activity of the ABH. Hara et al. [15] explained the effects of EMG-controlled electrical stimulation based on the sensory-motor integration theory that sensory input from movement of an affected limb directly influences subsequent motor output. Because the foot motion induced by electrical stimulation was smaller than that of the wrist and finger, the proprioceptive feedback may have been inadequate. However, we should not underestimate the effectiveness of EMG-controlled electrical stimulation because only in the CBG, where the EMG-controlled electrical stimulation was added to the visual EMG biofeedback, the increase in EMG activity of ABH reached the statistically significant compared with the CTG.
Interestingly, although the EMG activity of the ABH was increased in the CBG and this change was larger than in the CTG, there were no significant differences noted between the CTG and CBG in MLA morphology change. This finding suggested that using the change of MLA morphology to estimate the change of ABH activity would be misleading. This revealed the limitation of the conventional feedback method for the SF exercise because it depends on MLA morphology. The ABH is the largest intrinsic foot muscle and has the capacity to elevate the MLA. However, MLA morphology is changed not by the ABH and the other intrinsic and extrinsic foot muscles [5, 10]. Therefore, the increase in MLA elevation force accompanied by the increasing ABH activity may have been compensated for by the decreasing activity of other MLA support muscles.
This study had several limitations. First, its evaluation was limited to that of short-term effects. Further studies should be performed to compare long-term effects of the SF exercise using visual EMG biofeedback with that of the conventional SF exercise. Next, although a previous study found that several intrinsic foot muscles were activated to perform the SF exercise [19], we examined only the EMG activity of the ABH. Therefore, the results of our study cannot be applied to all intrinsic foot muscles. Moreover, we could not deny that the EMG activity of the ABH measured using surface electrodes might include the EMG activity of the other muscles. Finally, our exclusion criteria did not consider the level of skill for the SF exercise at the pre-practice stage. However, because we selected subjects who did not have previous experience with the SF exercise and chose their non-dominant foot for this experiment, the EMG activity levels of the ABH at pre-practice were lower than those in previous studies [11, 13] in which the subjects practiced the SF exercise for 2 weeks before measurements were taken. Therefore, we believe that our subjects required practice of the SF exercise regardless of the group assignments.
Conclusion
Visual EMG biofeedback increased the EMG activity of the ABH during the SF exercise with just 5 minutes of practice. This finding suggests that the additional use of visual EMG biofeedback effectively facilitates learning of the SF exercise. Further studies are needed to determine the long-term effects of the SF exercise using visual EMG biofeedback.
Footnotes
Acknowledgments
This work was partially supported by JSPS KAKENHI Grant Numbers JP17K01524 and JP18H06441.
Conflict of interest
None to report.