Determining the association between radiographic spinal instability assessment and lower back lumbar diseases with lower limb symptoms can contribute to evidence-based assessment and treatment in clinical practice and rehabilitation. Therefore, radiological evidence of lumbar spine instability assessment, such as sagittal translation (ST) and segmental angulation (SA), is clinically important.
OBJECTIVE:
To identify factors associated with the assessment of spinal instability in lumbar disc herniation with leg pain and discogenic low back pain using ST and SA.
METHODS:
We examined 112 patients with lumbar disc herniation with leg pain and 116 with discogenic low back pain at our clinic from 2016 to 2021. Data on age, gender, sports activities, and occupation were collected from medical records. Additionally, ST and SA of L4 and L5 during maximum trunk flexion and extension were measured using radiography. Simple and multiple logistic regression analyses were used for statistical analysis.
RESULTS:
Simple logistic regression analysis showed that ST and SA (odds ratio [OR]: 1.11; 95% confidence interval [CI]: 1.03–1.19) were associated with lumbar disc herniation. Multiple logistic regression analysis showed that only ST was associated with lumbar disc herniation (OR: 2.29; 95% CI: 1.78–3.00).
CONCLUSION:
Multiple logistic regression analysis showed that ST was associated with lumbar disc herniation with leg pain and had a stronger association than SA.
Lumbar disc herniation is a condition wherein the disc is compressed between the upper and lower vertebrae and causes the nucleus pulposus of the disc to escape the annulus fibrosus and compress the nerve root or spinal cord, resulting in low back and leg pain [1]. The widespread use of magnetic resonance imaging (MRI) helped to accurately diagnose the degree and location of lumbar disc herniation. However, in lumbar disc herniation, the correlation between MRI findings and patient complaints remains unclear [2, 3, 4]. Meanwhile, lumbar spine instability has been associated with low back pain or lower extremity symptoms [5, 6, 7, 8]. Therefore, assessing lumbar disc herniation with leg pain using MRI can be clinically useful to assess the degree of disc herniation and lumbar spine instability.
The assessment of spinal instability includes sagittal translation (ST) and segmental angulation (SA), where an ST 3 mm and SA 10 are defined as instability, which are not indications for surgery [9]. Iguchi et al. [10] reported that more patients with a lumbar spine disease with instability, including both ST and SA, presented with leg pain than those without instability. However, patients with lumbar disease in this study also had spinal canal stenosis, which was associated with pathological changes in the intervertebral joints or vertebral bodies. Spinal canal stenosis may reduce spinal mobility due to the deformity of the intervertebral joints and osteophytes [11, 12] and narrowing of the intervertebral foramen, resulting in nerve root compression and leg pain [13]. Therefore, comparison between lumbar disc herniation with leg pain, which causes relatively less degeneration of the spinal column, and lumbar disc disease with low back pain is important for identifying the association between lumbar instability and leg pain. Additionally, the results of previous studies used ST and SA to classify instability into four categories, which were then compared. However, these studies did not use an analytical method to clarify whether ST or SA was a predictor of leg pain.
Therefore, this study aimed to identify the predictors of lumbar disc herniation with leg pain using ST and SA and determine the association between lumbar instability and leg pain. We hypothesized that the ST and SA in lumbar disc herniation are higher than those in discogenic low back pain. The clinical significance of this study is that the results contribute to the clarification of the pathogenic mechanisms of lumbar disc herniation with leg pain and evidence-based functional assessment based on imaging findings and treatment strategies for lumbar spinal instability.
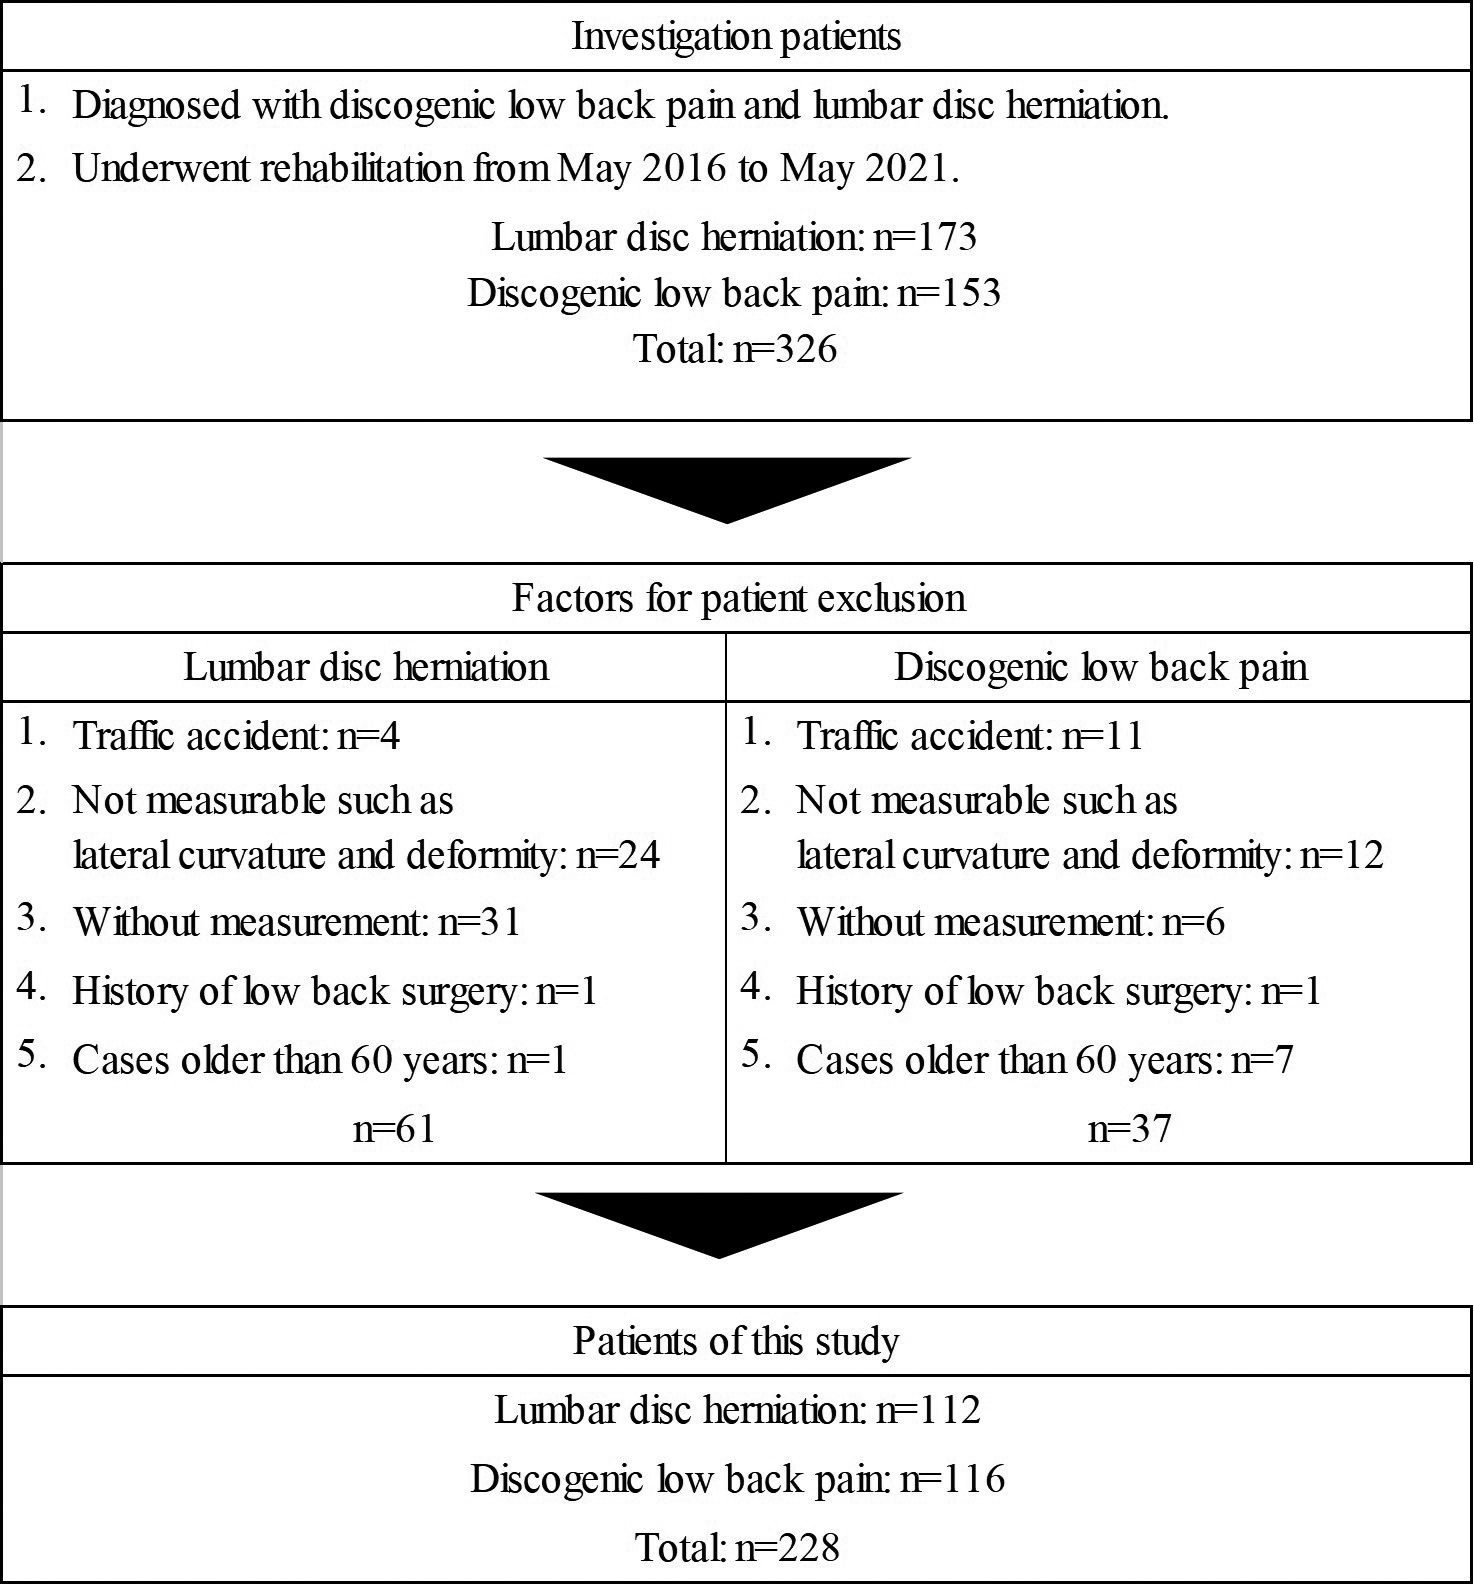
Illustration showing the process of patient selection.
Measurement positions. Sagittal translation and segmental angulation were measured with the patient in the side-lying position with the trunk in the maximum flexed and extended positions. A: maximum trunk flexion was achieved by holding both knees with hands. B: maximum trunk extension was achieved by promoting hip and spinal extension.
Method of measuring sagittal translation. The sagittal translation is calculated as the difference between the two lines perpendicular to the baseline (D-D’) and passing two landmarks at the posterior-inferior edge of L4 (C) and the superior-posterior edge of the L5 vertebra (D) when the trunk is in the maximum flexed (3-1) and extended (3-2) positions. Sagittal translation (mm) .
Methods
This retrospective cohort study was commenced in 2020. There were no real-time constraints on the experiments conducted in this study, which did not affect the research objectives, data measurement and analysis, or publication of the research results.
This study included 173 patients with lumbar disc herniations and 153 with discogenic low back pain diagnosed by physicians between May 2016 and May 2021. Patients with traffic accident injuries, and specific causes of low back pain such as scoliosis or lumbar spondylolisthesis were excluded as they are difficult to measure. Finally, 112 patients with lumbar disc herniation with leg pain and 116 patients with discogenic low back pain were included (Fig. 1). The physician used X-ray findings, such as narrowing of the intervertebral space and the presence of osteophytes, and examined the patient’s physical findings, including pain tests such as the trunk motion pain test, tenderness test, motor function tests, sensory tests, the reflex test, presence of numbness and leg pain, and lasegue sign, to diagnose the condition. Patients with lumbar disc herniation had leg pain, and an additional MRI revealed a herniated disc. Meanwhile, patients with discogenic low back pain had a principal complaint of lumbar back. All patients were diagnosed by an orthopedic surgeon with over 25 years of clinical experience.
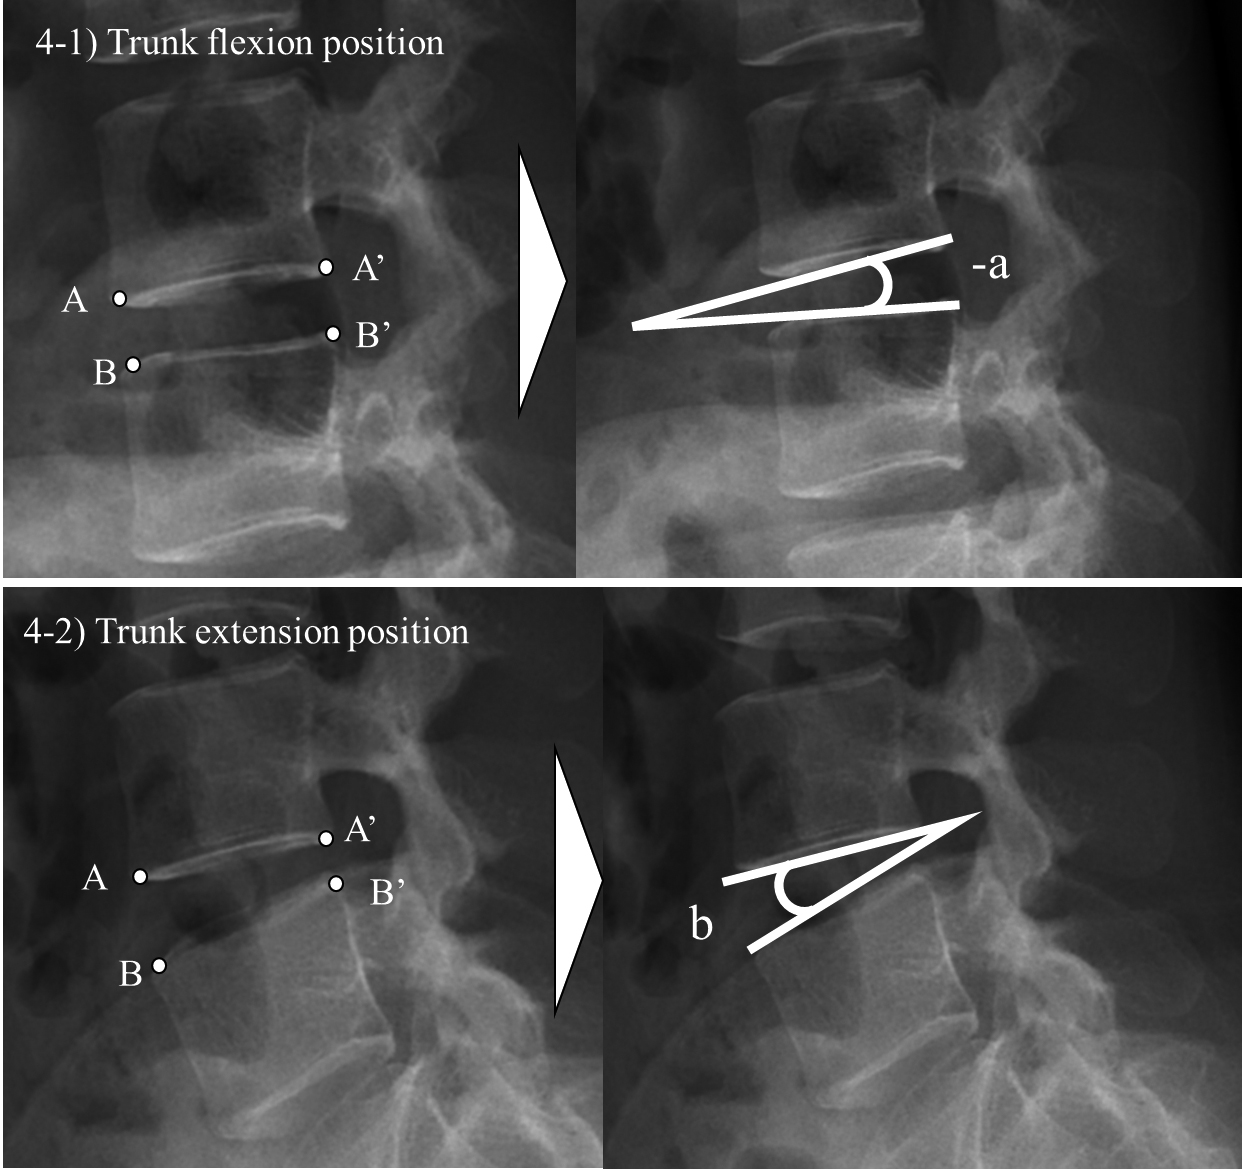
Method of measuring segmental angulation. The segmental angulation is calculated as the difference in the intervertebral angle between the trunk in maximum flexed (4-1) and extended (4-2) positions. The line A-A’ was derived from the inferior-anterior edge of the L4 vertebral body (4-1) and the inferior-posterior edge (A’). The line B-B’ was derived from the superior-anterior edge of the L5 vertebral body (B) and the superior-posterior edge (B’). The angle between A-A’ and B-B’ was derived. Segmental angulation () .
ST and SA were measured using a RADspeed Pro radiography system (Shimadzu Corp., Kyoto, Japan). The X-ray was taken with the patient in the lateral recumbent position to reduce trunk motion pain and ensure patient safety (Fig. 2). ST was measured as the difference between the anterior-posterior translation of the L4 vertebral body while in the maximum flexion and extension of the trunk (Fig. 3) [10]. SA was calculated as the difference between the angle between the lower end of the L4 vertebral body and the upper end of the L5 vertebral body while in the maximum flexion and extension of the trunk (Fig. 4) [10].
The measurement reliability of by the same examiner reported in our previous study [14] is as follows; intraclass correlation coefficient [1, 1] of the first and second measurements for ST and SA was 0.856 (95% confidence interval [CI]: 0.792–0.902) and 0.915 (95% CI: 0.875–0.955), respectively. Patients’ age, gender, sports activities, and occupation (manual labor or other) were collected from medical records.
This study used an online software program for power analysis (G*Power; http://www.psychologie.hhu.de/arbeitsgruppen/allgemeine-psychologie-und-arbeitspsychologie/gpower.html). When comparing lumbar disc herniation with leg pain and discogenic low back pain, the paired-samples -test was used to analyze the ST and SA variance demonstrated effect sizes (0.6) with the alpha set at 0.05; for our study design, 94 patients were necessary to achieve a statistical power of 0.8. Additionally, a two-sample -test to analyze age variance demonstrated effect sizes (0.6) with the alpha set at 0.05; for our study design, 90 patients were necessary to achieve a statistical power of 0.8. Furthermore, the chi-square test to analyze the gender, sports activity, and occupation demonstrated effect sizes (0.6) with the alpha set at 0.05; for our study design, 22 patients were necessary to achieve a statistical power of 0.8.
Simple logistic regression analysis and the stepwise method with Akaike’s information were used to determine the factors associated with low back and leg pain. The dependent variable was the presence or absence of lumbar disc herniation with leg pain, and the independent variables were ST and SA. To compare the age of patients with lumbar disc herniation with leg pain and discogenic low back pain, the Shapiro-Wilk test was used to test the normality of data, and the two-sample -test or Mann-Whitney U test was performed accordingly. Comparisons of gender, sports activity, and occupation of patients with lumbar disc herniation and discogenic low back pain were tested using the chi-square test. We constructed receiver operating characteristic (ROC) curves based on the presence or absence of lumbar disc herniation with leg pain and ST or SA and identified cutoff points to find the optimal combinations of sensitivities and specificities. We determined the optimal cutoff points using the Youden index (J), which is calculated as J maximum {sensitivity specificity 1} [15]. Accuracy was classified according to the size of the area under the ROC curve (area under the curve; AUC): 0.90–1.00, excellent; 0.80–0.89, good; 0.70–0.79, moderate; and 0.70, poor [16]. For the analysis of the correlation of ST and SA, Pearson’s correlation coefficient or Spearman’s rank correlation coefficient was used after examining whether the data followed normal distribution via the Shapiro-Wilk test.
R Commander software version 4.0.2 was used for statistical analysis with a significance level of 5%. This study was approved by the ethics committee of Hitachino Orthopedic Clinic (protocol number: 202001) and adhered to the Declaration of Helsinki. Due to the retrospective nature of the study, no adverse events were found, and informed consent was not required.
Results
Simple logistic regression analysis showed that ST (OR: 2.31; 95% CI: 1.81–3.01) and SA (OR: 1.11; 95% CI: 1.03–1.19) were associated with lumbar disc herniation with leg pain. Furthermore, multiple logistic regression analysis showed that only ST (OR: 2.29; 95% CI, 1.78–3.00) was associated with lumbar disc herniation with leg pain (Table 1).
Multiple logistic regression analysis identifying the factors associated with lumbar disc herniation with leg pain
Comparison of age, gender, sports activity, occupation, sagittal translation, and segmental angulation in patients with lumbar disc herniation and discogenic low back pain
Variables
Lumbar disc herniation
112
Discogenic low back pain
116
-value
Effect size
Age (years)
40.8 12.3
39.5 9.2
0.346
0.066
Gender (case)
0.978
Male
62
64
Female
50
52
Sports (case)
0.942
Yes
41
43
No
71
73
Occupation (case)
0.224
Mannual labor
33
26
Others
79
90
Sagittal translation (mm)
2.4 1.1
1.2 1.2
0.001
0.454
Segmental angulation ()
11.4 3.8
10.0 3.7
0.007
0.178
: 0.01, : 0.001.
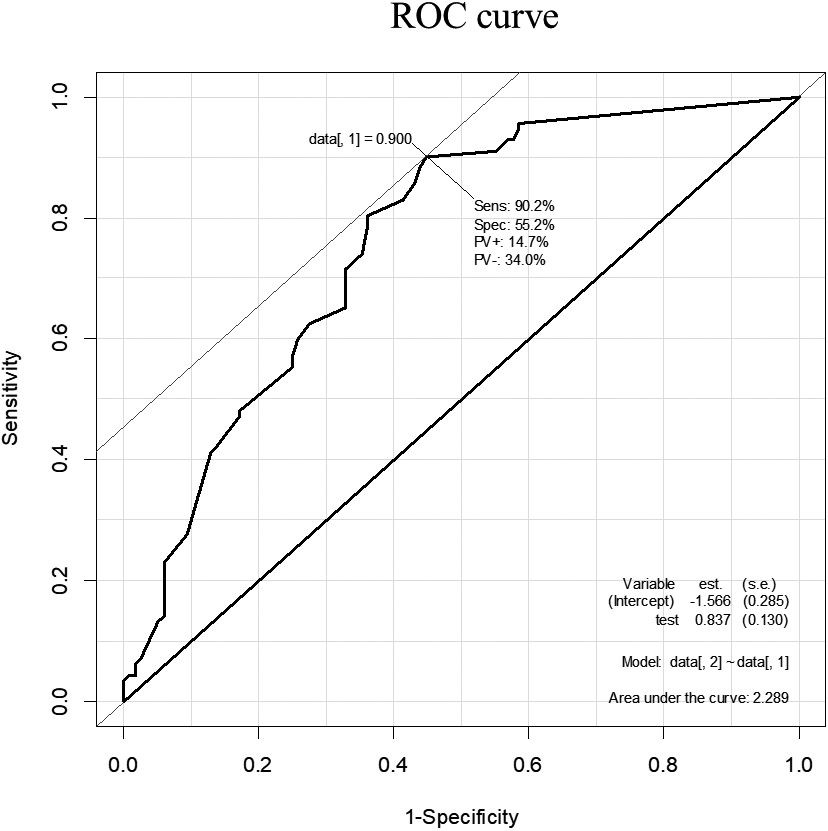
The receiver operating characteristic (ROC) curve for sagittal translation in lumbar disc herniation with leg pain. The area under the curve (AUC) was 0.76; the sensitivity was 71.4%, and specificity was 67.2% when the cutoff point was set at 1.6 mm; 228.
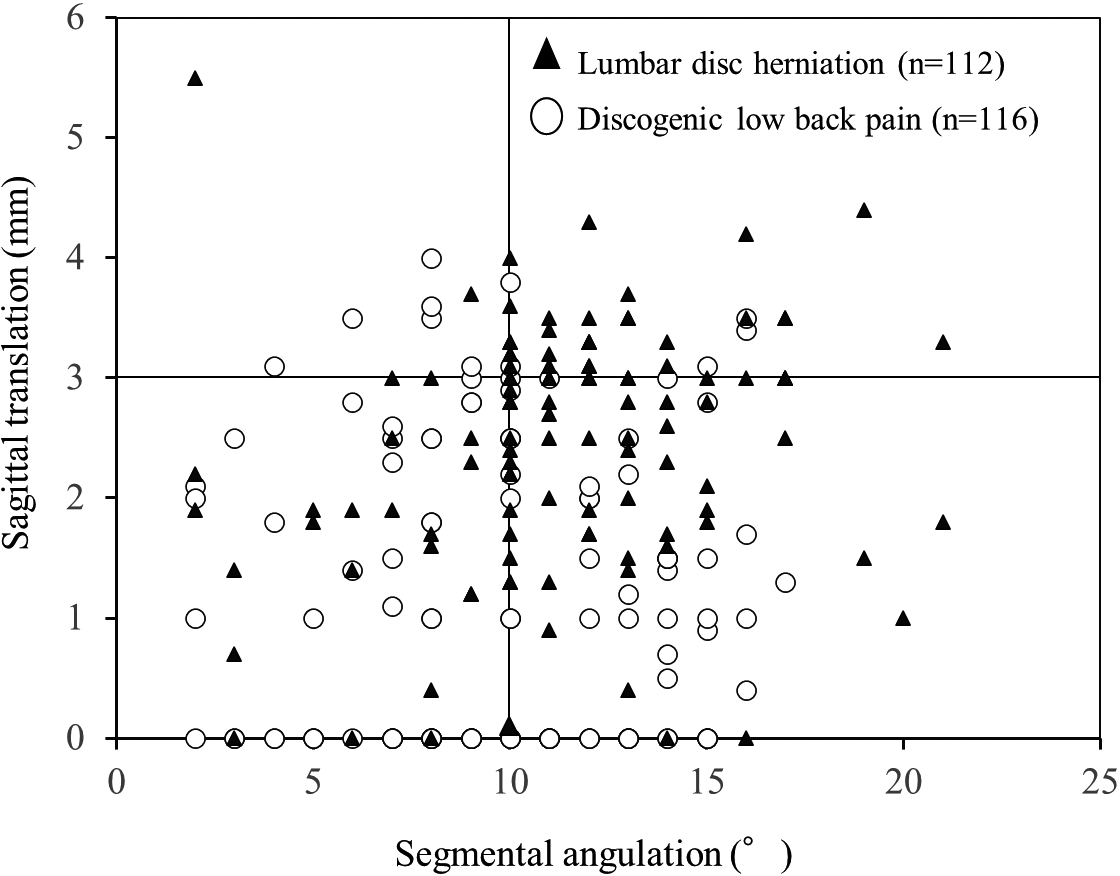
Scatter plot showing the sagittal translation (ST) and segmental angulation (SA). There was no significant relationship between ST and SA ( 0.162, 0.014). 50 patients had 3 mm ST and 10 SA (lumbar disc herniation [LDH] was 42 cases; discogenic low back pain [DLBP] was 8 cases), 11 patients had 3 mm ST and 10 SA (LDH 4; DLBP 7), 103 patients had 3 mm ST and 10 SA (LDH, 46; DLBP, 57), 64 patients had 3 mm and 10 SA (LDH 20; DLBP, 44).
The AUC of ST was 0.76 (95% CI: 0.699–0.823). While using a cutoff of 1.6 mm, the model showed a sensitivity and specificity of 71.4% and 67.2%, respectively (Fig. 5). The AUC of SA for lumbar disc herniation with leg pain was 0.60 (95% CI: 0.530–0.676). With a cutoff of 9.5, the model showed a sensitivity and specificity of 58.0% and 56.9%, respectively.
There was no significant relationship between ST and SA ( 0.162 and 0.014; Fig. 6). In overall patient cases (228), 50 (21.9%) patients had 3 mm ST and 10 SA, and 11 (5%) patients had 3 mm ST and 10 SA, 103 (45.2%) patients had 3 mm ST and 10 SA, 64 (28.1%) patients had 3 mm ST and 10 SA. 112 patients with lumbar disc herniation were classified as 3 mm ST and 10 SA combined in 42 patients (37.5%), 3 mm ST or 10 SA singularly in 4 (3.6%) and 46 (41.0%), respectively, and 3 mm ST and 10 SA were present in 20 (17.9%). 116 patients with discogenic low back pain were classified as 3 mm ST and 10 SA combined in 8 patients (6.9%), 3 mm ST or 10 SA singularly in 7 (6.0%) and 57 (49.1%), respectively, and 3 mm ST and 10 SA were present in 44 (37.9%).
The lumbar disc herniation group showed higher ST (2.4 mm vs 1.2 mm, 0.001) and SA (11.4 vs 10.0, 0.007) than the discogenic low back pain group (Table 2). There were no significant differences in age, gender, sports activity, and occupation between the lumbar disc herniation and discogenic low back pain groups.
Discussion
The association between lumbar spine instability and leg pain remained unclear because previous studies included patients with spinal canal stenosis and spinal degeneration affecting lumbar spine mobility [10, 13]. However, the present study clarifies the association between lumbar instability and low back pain as we included patients with lumbar disc herniation with leg pain, who relatively had no degeneration of the spinal articular structures and unclear relationship between MRI assessment and symptoms [2, 3, 4].
Simple logistic regression analysis revealed that both ST and SA were associated with lumbar disc herniation with leg pain. Iguchi et al. [10] reported that spinal instability with an ST 3 mm and SA 10 was associated with leg pain, which is in line with the results of the present study. Additionally, multiple logistic regression analysis revealed that ST was the only factor associated with leg pain. However, the discrimination (AUC) of lumbar disc herniation with leg pain for ST was 0.76. When the cutoff was 1.6 mm, the model had a sensitivity of 71.4% and a specificity of 67.2%, indicating that the sensitivity and the specificity were moderate and poor, respectively [16]. Therefore, ST and a combination of positive test results [3] in MRI and physical findings should be considered for the accurate assessment of lumbar disc herniation with leg pain. The present study found no correlation between the two lumbar instability assessments, ST and SA. Lumbar instability was classified as 3 mm ST and 10 SA combined in 50 patients (21.9%), 3 mm ST or 10 SA singularly in 11 (4.8%) and 103 (45.2%), respectively, and 3 mm ST and 10 SA were present in 64 (28.1%). These results indicate that more cases show lumbar instability singularly, particularly SA, than combined. Since Iguchi et al. [17] reported that 10 SA is more common in younger people between 16–20 years and ST is more common in older people between 51–55 years, these two assessments may reflect the instability factor of different joint components. Although a number of studies [10, 11, 12, 17] have reported that morphological degeneration of the lumbar spine leads to instability, future studies need to investigated which morphological degeneration, such as disc, facet joints, and ligaments are influenced by ST and SA.
There were no significant differences in the patient background characteristics, such as age, gender, sports, or occupation, between the lumbar disc herniation and discogenic low back pain groups, although there were significant differences in the lumbar spine instability assessments such as ST and SA. In a previous study [14], similar results were reported, which demonstrated no association between lumbar instability and background factors such as sports activity and occupation in patients with discogenic low back pain. Moreover, a few studies reported that lumbar spine instability may be associated with leg pain and lumbar spinal canal stenosis, implying the importance of radiographic or MRI assessment of lumbar spine instability [7, 8, 13, 18, 19]. The average SA of the lumbar disc herniation and discogenic low back pain groups in the present study was more than 10, whereas the average SA reported in a previous study was 5.7 [10]. This may be because previous studies measured SA in the sitting or standing positions [10, 20], while patients in the present study were in the side-lying position. These clinical examination positions to reduce patients’ trunk motion pain may have caused increased angulation due to lack of loading on the intervertebral joins. Furthermore, the average age of the patients in this study was approximately 40 years, which is younger than the age of 47.5 years reported in a previous study [1], and younger patients have relatively few morphological changes in the spine, which may contribute to increased SA [21].
This study has some limitations. Nagel et al. reported that L4/L5 vertebrae experience a greater strain in the spinal flexion position than L3/L4 and L5/S1 [21]. Thus, this study focused on L4/L5 to evaluate instability based on previous studies [21]. However, in the future, it is necessary to evaluate the instability of the high-frequency segment of herniation such as L3/4 and L5/S1. Additionally, the measurement position in the present study was the side-lying position, in which the patient’s low back pain is taken into consideration, whereas the sitting or standing positions were used in previous studies [10, 20]. It is also necessary to standardize the measurement position and compare it with the lumbar instability assessments of previous studies.
Conclusion
The ST and SA were used to determine the factors associated with lumbar disc herniation with leg pain. The results of the multiple logistic regression analysis in this study showed that the ST was associated with lumbar disc herniation with leg pain. However, the sensitivity and specificity of ST to predict lumbar disc herniation with leg pain were 71.4% (moderate) and 67.2% (poor), respectively; thus, other diagnostic modalities such as MRI should also be considered.
Footnotes
Acknowledgments
The authors thank T. Kamo for statistical analysis.
Conflict of interest
The authors declare that they have no conflict of interest.
Funding
The authors report no funding.
References
1.
CunhaCSilvaAJPereiraPVazRGonçalvesRMBarbosaMA. The inflammatory response in the regression of lumbar disc herniation. Arthritis Res Ther.2018; 20(1): 251. doi: 10.1186/s13075-018-1743-4.
2.
BodenSDDavisDODinaTSPatronasNJWieselSW. Abnormal magnetic-resonance scans of the lumbar spine in asymptomatic subjects. A prospective investigation. J Bone Joint Surg Am.1990; 72(3): 403-408.
3.
van der WindtDASimonsERiphagenIIAmmendoliaCVerhagenAPLaslettM, et al. Physical examination for lumbar radiculopathy due to disc herniation in patients with low-back pain. Cochrane Database Syst Rev.2010; (2): CD007431. doi: 10.1002/14651858.CD007431.pub2.
4.
KimJHvan RijnRMvan TulderMWKoesBWde BoerMRGinaiAZ, et al. Diagnostic accuracy of diagnostic imaging for lumbar disc herniation in adults with low back pain or sciatica is unknown; a systematic review. Chiropr Man Therap.2018; 26: 37. doi: 10.1186/s12998-018-0207-x.
5.
FribergO. Lumbar instability: A dynamic approach by traction-compression radiography. Spine (Phila Pa 1976).1987; 12(2): 119-129. doi: 10.1097/00007632-198703000-00007.
6.
SatoHKikuchiS. The natural history of radiographic instability of the lumbar spine. Spine (Phila Pa 1976).1993; 18(14): 2075-2079. doi: 10.1097/00007632-199310001-00026.
7.
MutoMGiurazzaFGuarnieriGIzzoRDianoA. Neuroimaging of spinal instability. Magn Reson Imaging Clin N Am.2016; 24(3): 485-494. doi: 10.1016/j.mric.2016.04.003.
Symposium: The role of spine fusion for low-back pain. International Society for the Study of the Lumbar Spine, New Orleans, Louisiana, May 27, 1980. Spine (Phila Pa 1976). 1981; 6(3): 277-314.
10.
IguchiTKanemuraAKasaharaKSatoKKuriharaAYoshiyaS, et al. Lumbar instability and clinical symptoms: Which is the more critical factor for symptoms: Sagittal translation or segment angulation? J Spinal Disord Tech.2004; 17(4): 284-290. doi: 10.1097/01.bsd.0000102473.95064.9d.
11.
Kirkaldy-WillisWHFarfanHF. Instability of the lumbar spine. Clin Orthop Relat Res.1982; (165): 110-123.
12.
Kirkaldy-WillisWH. Presidential symposium on instability of the lumbar spine. Spine.1985; 10(3): 254.
13.
LaiMKLCheungPWHSamartzisDKarppinenJCheungKMCCheungJPY. Clinical implications of lumbar developmental spinal stenosis on back pain, radicular leg pain, and disability. Bone Joint J.2021; 103-B(1): 131-140. doi: 10.1302/0301-620X.103B1.BJJ-2020-1186.R2.
14.
TakahashiMIwamotoKKuzuyamaMInamiHMatsumotoYUedaS, et al. Incidence of spinal instability among patients with discogenic low back pain with different backgrounds. J Phys Ther Sci.2021; 33(8): 601-605. doi: 10.1589/jpts.33.601.
YatsuyaHLiYHirakawaYOtaAMatsunagaMHaregotHE, et al. A point system for predicting 10-year risk of developing type 2 diabetes mellitus in japanese men: Aichi workers’ cohort study. J Epidemiol.2018; 28(8): 347-352.
17.
IguchiTKanemuraAKasaharaKKuriharaADoitaMYoshiyaS. Age distribution of three radiologic factors for lumbar instability: Probable aging process of the instability with disc degeneration. Spine (Phila Pa 1976).2003; 28(23): 2628-2633. doi: 10.1097/01.BRS.0000097162.80495.66.
18.
IzzoRGuarnieriGGuglielmiGMutoM. Biomechanics of the spine. Part II: spinal instability. Eur J Radiol.2013; 82(1): 127-138. doi: 10.1016/j.ejrad.2012.07.023.
19.
IguchiTKuriharaANakayamaJSatoKKurosakaMYamasakiK. Minimum 10-year outcome of decompressive laminectomy for degenerative lumbar spinal stenosis. Spine (Phila Pa 1976).2000; 25(14): 1754-1759. doi: 10.1097/00007632-200007150-00003.
20.
KnutssonF. The instability associated with disk degeneration in the lumbar spine. Acta Radiol.1944; 25(5-6): 593-609. doi: 10.3109/00016924409136488.
21.
NagelTMZitnayJLBarocasVHNuckleyDJ. Quantification of continuous in vivo flexion-extension kinematics and intervertebral strains. Eur Spine J.2014; 23(4): 754-761.