
Abstract
Delaware’s Indian River Inlet Bridge opened to traffic in May of 2012. The cable-stayed bridge has a main span of 289 m and back spans of 121 m. It was constructed using a combination of cast-in-place and pre-cast reinforced concrete. In an effort to enhance the long-term maintenance and management of this significant infrastructure, a comprehensive structural health monitoring (SHM) system was installed on the bridge. To the authors knowledge, this is the first long-span, cable-supported bridge in the U.S. to have a permanent long-term structural health monitoring system installed during initial construction. The fiber-optic SHM system that was installed has 144 sensors distributed throughout the structure. These sensors measure strain, acceleration, tilt, bearing displacement, temperature, wind speed and direction, and chloride ingress at key locations on the bridge. The SHM system provides valuable quantitative data which can be utilized by the bridge owner in their management and maintenance the bridge for years to come. This paper will review the design of the bridge and provide an overview of the SHM system, including the types and layout of the sensors, and the fiber-optic network.
Keywords
Introduction
The Indian River Inlet is an inner coastal waterway in Sussex County, Delaware that provides a direct connection between the Atlantic Ocean and Delaware’s inland bays. The inlet experiences twice daily tides that result in very high flow rates in and out of the inland bay. The first bridge crossing the inlet was constructed in 1934. It was a timber trestle that was quickly destroyed by storms. A second bridge, a concrete and steel swing bridge, was then built. That bridge collapsed due to ice flows in 1948. A third bridge, also a swing bridge, was built in 1952. That bridge was closed a decade later due to severe storm damage. Engineers appeared to have found a longer-term solution when, in 1965, a three-span steel girder bridge was constructed. A twin span was added in 1976 to handle the increasing tourism traffic to the Delaware beach resorts. The 1965 and 1976 bridges were built with their main supporting piers in the tidal inlet. The manmade inlet jetties, in combination with the twice daily tides, created a channel with very high flow rates that threatened to undermine the main supporting piers of the 1965/76 bridges [1]. Over the years, two deep scour pits developed very close to the piers. Bathymetry surveys, as well as in-service monitoring of the pits, were conducted to monitor the location and depth of the pits. While the superstructure of the 1965/76 bridges had no major problems, the bridge was designated as structurally deficient because of the scour problem and threat to the piers. An aerial view of the inlet and the 1965/76 bridges is shown in Fig. 1. Figure 2 presents an aerial view of the inlet with a contour plot of the bathymetry of the inlet in 2004. This plot shows the location of the two piers and the two scour pits. In the mid-2000’s, a decision was made to replace the existing bridges with a new structure that would span the inlet.
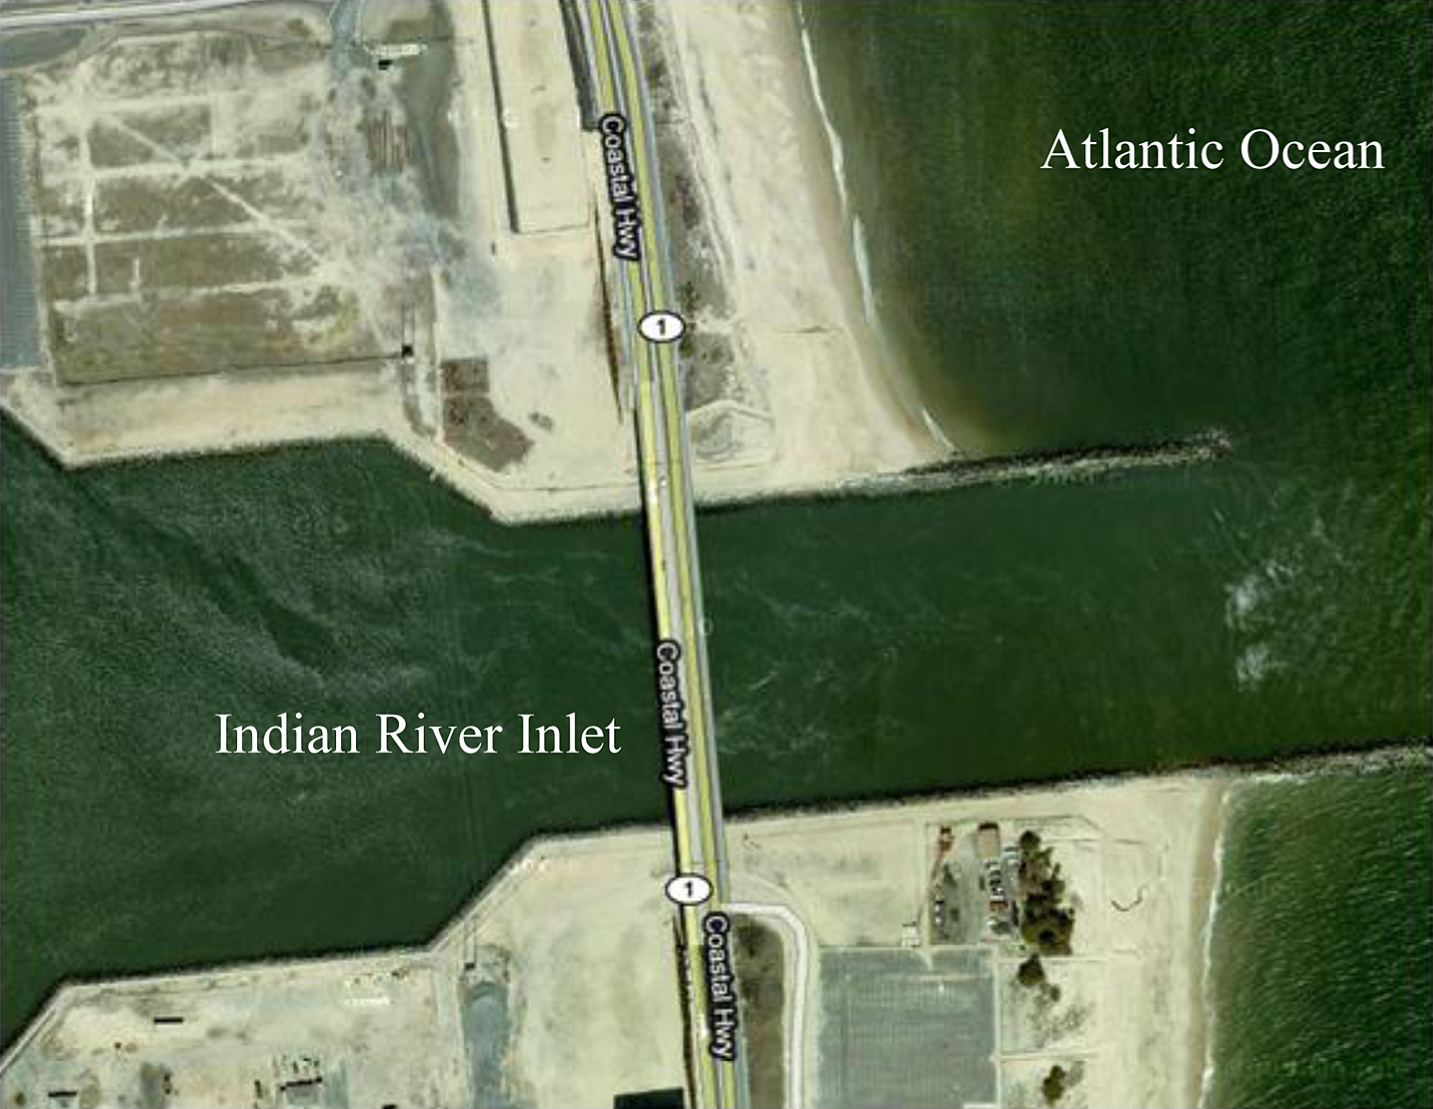
Aerial view of inlet and the ‘65/’76 bridge.
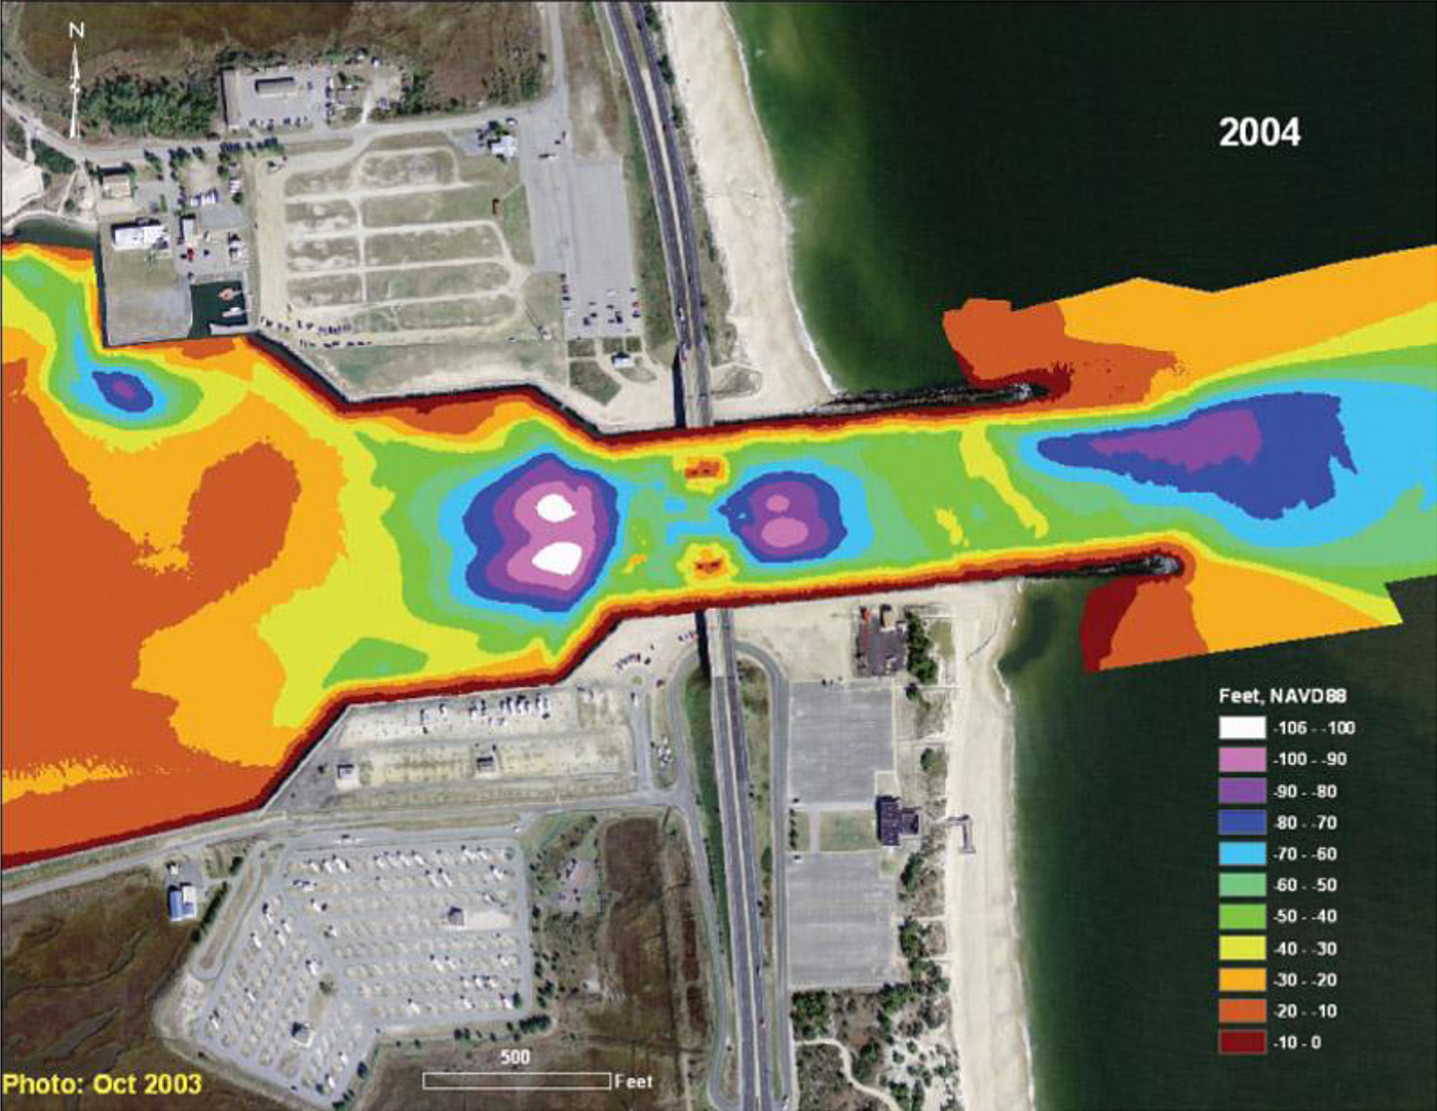
Aerial view of inlet with 2004 bathymetry survey overlaid; shows scour pits near the piers of the ‘65/’76 bridge (
The owner, the Delaware Department of Transportation (DelDOT), requested bids for a design-build project for the new bridge in 2006. The contract was awarded to the design-build team of Skanska/AECOM, with an estimated cost of $150 million. The resulting bridge, shown in Fig. 3, is a cable-stayed design with a total length of 533 m. Construction of the bridge commenced in 2009. The bridge was opened to limited traffic in the winter of 2012 and was fully opened to traffic in May of 2012.

Photograph of the Indian River Inlet Bridge.
In the conceptual phase of the project, researchers from the University of Delaware’s Center for Innovative Bridge Engineering (CIBrE) proposed that a permanent Structural Health Monitoring (SHM) system be installed on the bridge. Envisioned as a signature structure in the state, and one that would cost millions of dollars, CIBrE researchers felt it would be useful to monitor the performance of the bridge over its life, gathering data and using that data to make more informed decisions about bridge maintenance and repair decisions. DelDOT supported the idea, as did the U.S. Federal Highway Administration, which provided 80% of the funding for the bridge construction. As a result, a comprehensive SHM system was designed and installed on the bridge during construction. To the best of the authors knowledge, this is the first, long-span, cable-supported bridge in the U.S. to have a permanent comprehensive SHM system installed on it during construction.
The SHM system has been operating since the bridge first opened in 2012. It includes a wide variety of sensors that provide data on the response of the bridge to both static and dynamic loads. It runs unattended 24/7 and can be accessed remotely via a secure internet connection. Data is streamed to the owner’s Traffic Management Center (TMC) where the system is monitored along with the other sensor systems in the state’s transportation network.
What follows includes is a description of the bridge, a detailed description of the SHM system and its operation, and a discussion of data analysis and reporting. The companion paper discusses the lessons learned from the installation, early operation of the SHM system, maintenance of the SHM system, owner point view, and a summary of the experience to date with the SHM system [3].
Together these companion papers provide an archival record of this unique and foundational structural health monitoring implementation on a long-span bridge in the US. While structural health monitoring of long-span bridges has tremendous potential, it could be argued that the applications to date have not been sufficiently documented. Furthermore, comprehensive guidelines for SHM systems for bridges have yet to be developed. It is hoped that these paper will help future owners and engineers as they design and implement future SHM systems. We will use these foundational papers as the basis for future papers in which the results of ongoing analysis of the SHM data, being conducted collaboratively with the bridge owner, will be presented. We also anticipate that the data from this installation will be useful for conducting fundamental research into the behavior of long-span bridges.
The new Charles W. Cullen Bridge at the Indian River Inlet, also referred to as the Indian River Inlet Bridge (IRIB), is a 533 m long cable-stayed bridge with a 289 m main span and two 121 m back spans. The bridge is 32 m wide with two lanes of traffic and a shoulder in each direction. A 3.6 m wide pedestrian walkway is located on the east side of the bridge, shifting the centerline of the roadway toward the west edge girder (Fig. 4). The bridge is fixed at the north pylon and is free to expand at the south pylon and the abutments. An extensive description of the bridge design and construction can be found in [2].
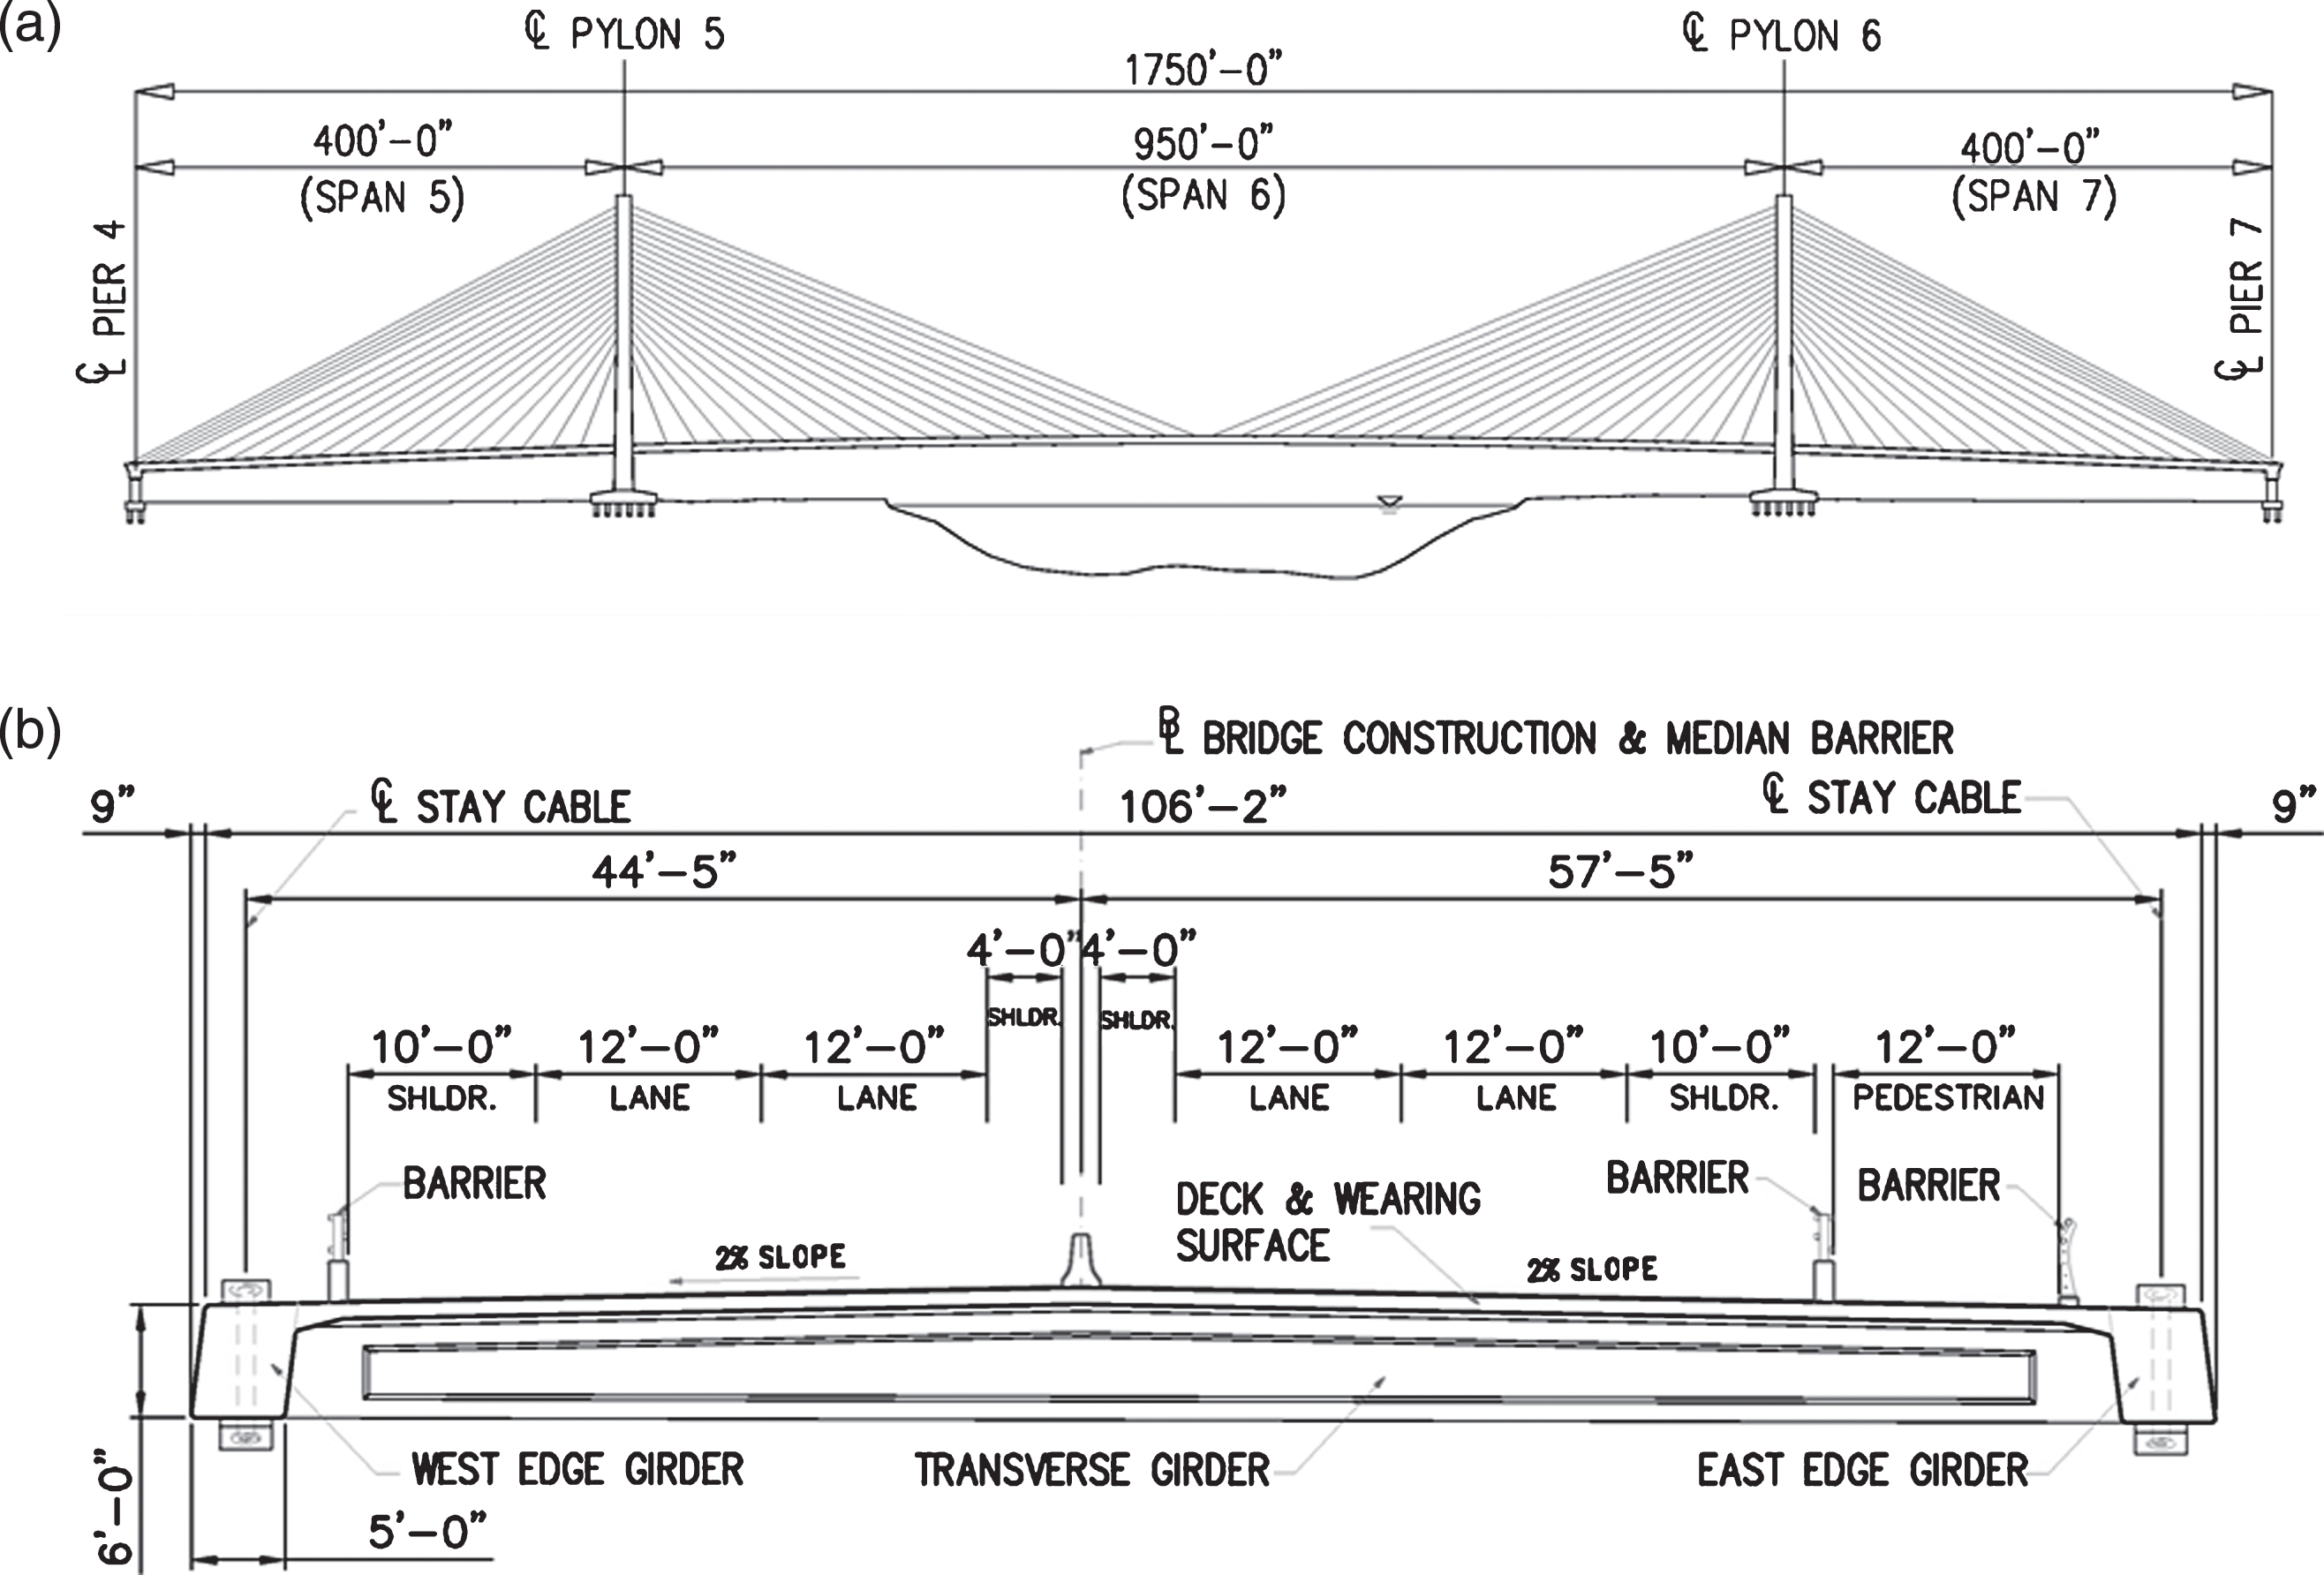
(a) Schematic elevation of the Indian River Inlet Bridge. (b) Deck cross-section of the IRIB.
The bridge was designed using a combination of precast and cast-in-place reinforced concrete. A steel superstructure was precluded by the owner because of the bridge’s close proximity to the Atlantic Ocean and the heavy presence of chlorides. Another key element of the design is that the main supporting pylons are located outside of the inlet, and the horizontal clearance between the pylons is 274 m, thereby allowing for possible future widening of the inlet channel.
The deck consists of two edge girders, transverse floor beams spaced at 3.6 m on center, and a cast-in-place deck. The continuous cast-in-place edge girders are roughly rectangular in shape with dimensions of 1.8 m deep and 1.5 m wide. A 21.6 cm thick cast-in-place deck includes 4.13 cm of latex modified concrete as a wearing surface. The portions of the deck over land, approximately 66% of the bridge, were constructed on falsework, which was faster and more economical. For these portions of the bridge, the floorbeams were precast, pretensioned I sections that taper in depth from their center to their ends. The regions over water were constructed in sections using a form traveler having a length of 7.3 meters. In this region, the edge girders, transverse floorbeams, and deck were all cast together enabling the superstructure to act monolithically. Post-tensioning was used in the deck, edge girders, and the connection of the precast floorbeams to the edge girders.
Pylons
The bridge has two twin pylons that each reach a height of 75.6 m above the ground. The pylons have a hollow box cross-section that is uniform below the deck level and above deck level tapers to the top of the pylon. A grade beam connects the twin pylons at their base – designers were able to eliminate the conventional cross-strut typically seen in bridges of this type through the use of an aerodynamically efficient cross-section and by minimizing the eccentricity of the stay plane with respect to the centroid of the cross-section. The pylons are cast-in-place and utilized slip-form construction. The pylons are supported on a 3-meter thick spread footing that is supported by 42 to 49 one-meter square prestressed concrete piles.
Stay cables
There are a total of 152 stays, 38 per pylon. Nineteen stays emanate from each side of the pylons and are anchored to the edge girder on 7.3-meter centers. The stay cables consist of seven wire strands in bundles of 19 to 61. The strands are waxed and encapsulated in high-density polyethylene sheathing. The stays are enclosed in a helical high density polythene pipe with a raised helical strake to minimize the potential for wind-rain induced vibrations.
Description of the structural health monitoring (SHM) system
In the very early stages of planning for the new IRIB, the University of Delaware CIBrE proposed installing a permanent structural health monitoring system on the bridge. The bridge was designed for a 100-year service life at a cost of $150 million. Due to the cost and significance of the structure, the owner (DelDOT) was highly motivated to have reliable, quantitative information regarding the condition of the bridge and how it responds to the environment and live loads. Such quantitative information, combined with typical visual inspection data, could help to ensure that the bridge would be efficiently maintained over its life. The owner, as well as the federal authorities, recognized the value of such a system and approved the plan to develop and install a SHM system.
CIBrE researchers designed and oversaw the installation of the comprehensive SHM system on the bridge throughout the design/build process; in this regard the SHM was also subject to the design/build process. The SHM system was designed to provide quantitative information regarding key performance measures of the bridge and was spatially distributed over the entire structure. The parameters monitored include strain, acceleration, tilt, displacement, chlorides, temperature, and wind speed and direction. In balancing the robustness and economics of the system, the total number of sensors on the bridge was limited to just under 150. The system was designed to capture very slow changes in behavior due to thermal effects, environmental factors, and long-term deterioration: this type of data is referred to as “monitor” data. The “monitor” data is collected continuously both at low and high frequency. The system was also designed to capture rapid changes that can be caused by heavy vehicles, high winds, or other extreme events: this type of data is referred to as “event” data.
Initially two options were considered for the SHM system – a conventional analog sensor system and a more innovative fiber-optic based sensor system. In the end, the fiber-optic based system was selected because of the many advantages it has over a conventional system. These advantages include being immune to electrical noise, having noncorrosive components, the ability to have multiple sensors on a single fiber thereby reducing the total amount of cable in the system, and the need for less conduit when embedding the fiber in concrete. Because it is a relatively new technology, and few projects of this size and scope have been attempted, there were a few challenges faced during construction. Some of these will be discussed in the companion paper.
The basic principal of the Fiber Bragg Grating (FBG) technology will now be described [4, 5]. A FBG of a certain wavelength is etched into the fiber. When a light pulse is sent down the fiber it is reflected at the FBG. The reflected light has a wavelength equal to that of the unstrained FBG. When the fiber at the FBG experiences an axial strain the wavelength of the reflected light from the grating changes. The change in the measured wavelength can be directly correlated to the induced strain. FBG’s are also sensitive to temperature change; independent gratings are packaged with most sensors to measure relative temperature change that are included in the calculation of the measurement to account for thermal effects. With absolutely no moving parts or basic components that can corrode, FBG sensors are robust sensors that can last for many years. The fiber-optic supplier for the project was Cleveland Electric Laboratories (CEL) and Chandler Monitoring Systems (CMS). The system was installed as a joint effort between UD-CIBrE and CEL/CMS.
The SHM system is made up of three main components, (1) sensors, (2) cabling and conduit, and (3) a data acquisition and control system. Each of these components will be described.
Sensors
The SHM system includes 7 different types of sensors, with a total of 144 individual sensors installed on the bridge. The different sensors are designed to measure the structural response of the bridge under various environmental loads and live load conditions. They include: 70 strain sensors, located in the edge girders, pylons, and deck 44 accelerometers, mounted to the deck, pylons, and stay cables 9 tiltmeters mounted along the east edge girder 3 displacement sensors, one at each of the bridge expansion bearings (the two abutments and the south east pylon) 2 anemometers that measure wind speed and direction, one at deck level and one at the top of one pylon 16 chloride sensors in the deck in 10 locations
All of the sensors are optical sensors, with the exception of the anemometers and 10 of the chloride sensors, which are conventional analog devices.
To aid in describing the SHM system and sensor layout, a three-dimensional Cartesian coordinate system was defined for the bridge. The X direction is along the length of the bridge, with positive pointing north. The Y direction is perpendicular to X, in the plane of the road, with positive pointing west. The Z direction is perpendicular to X and Y, with positive pointing upwards. A schematic of the overall layout of the SHM system and sensors is shown in Fig. 5 and an 3D illustration of the bridge with sensor locations is shown in Fig. 6.
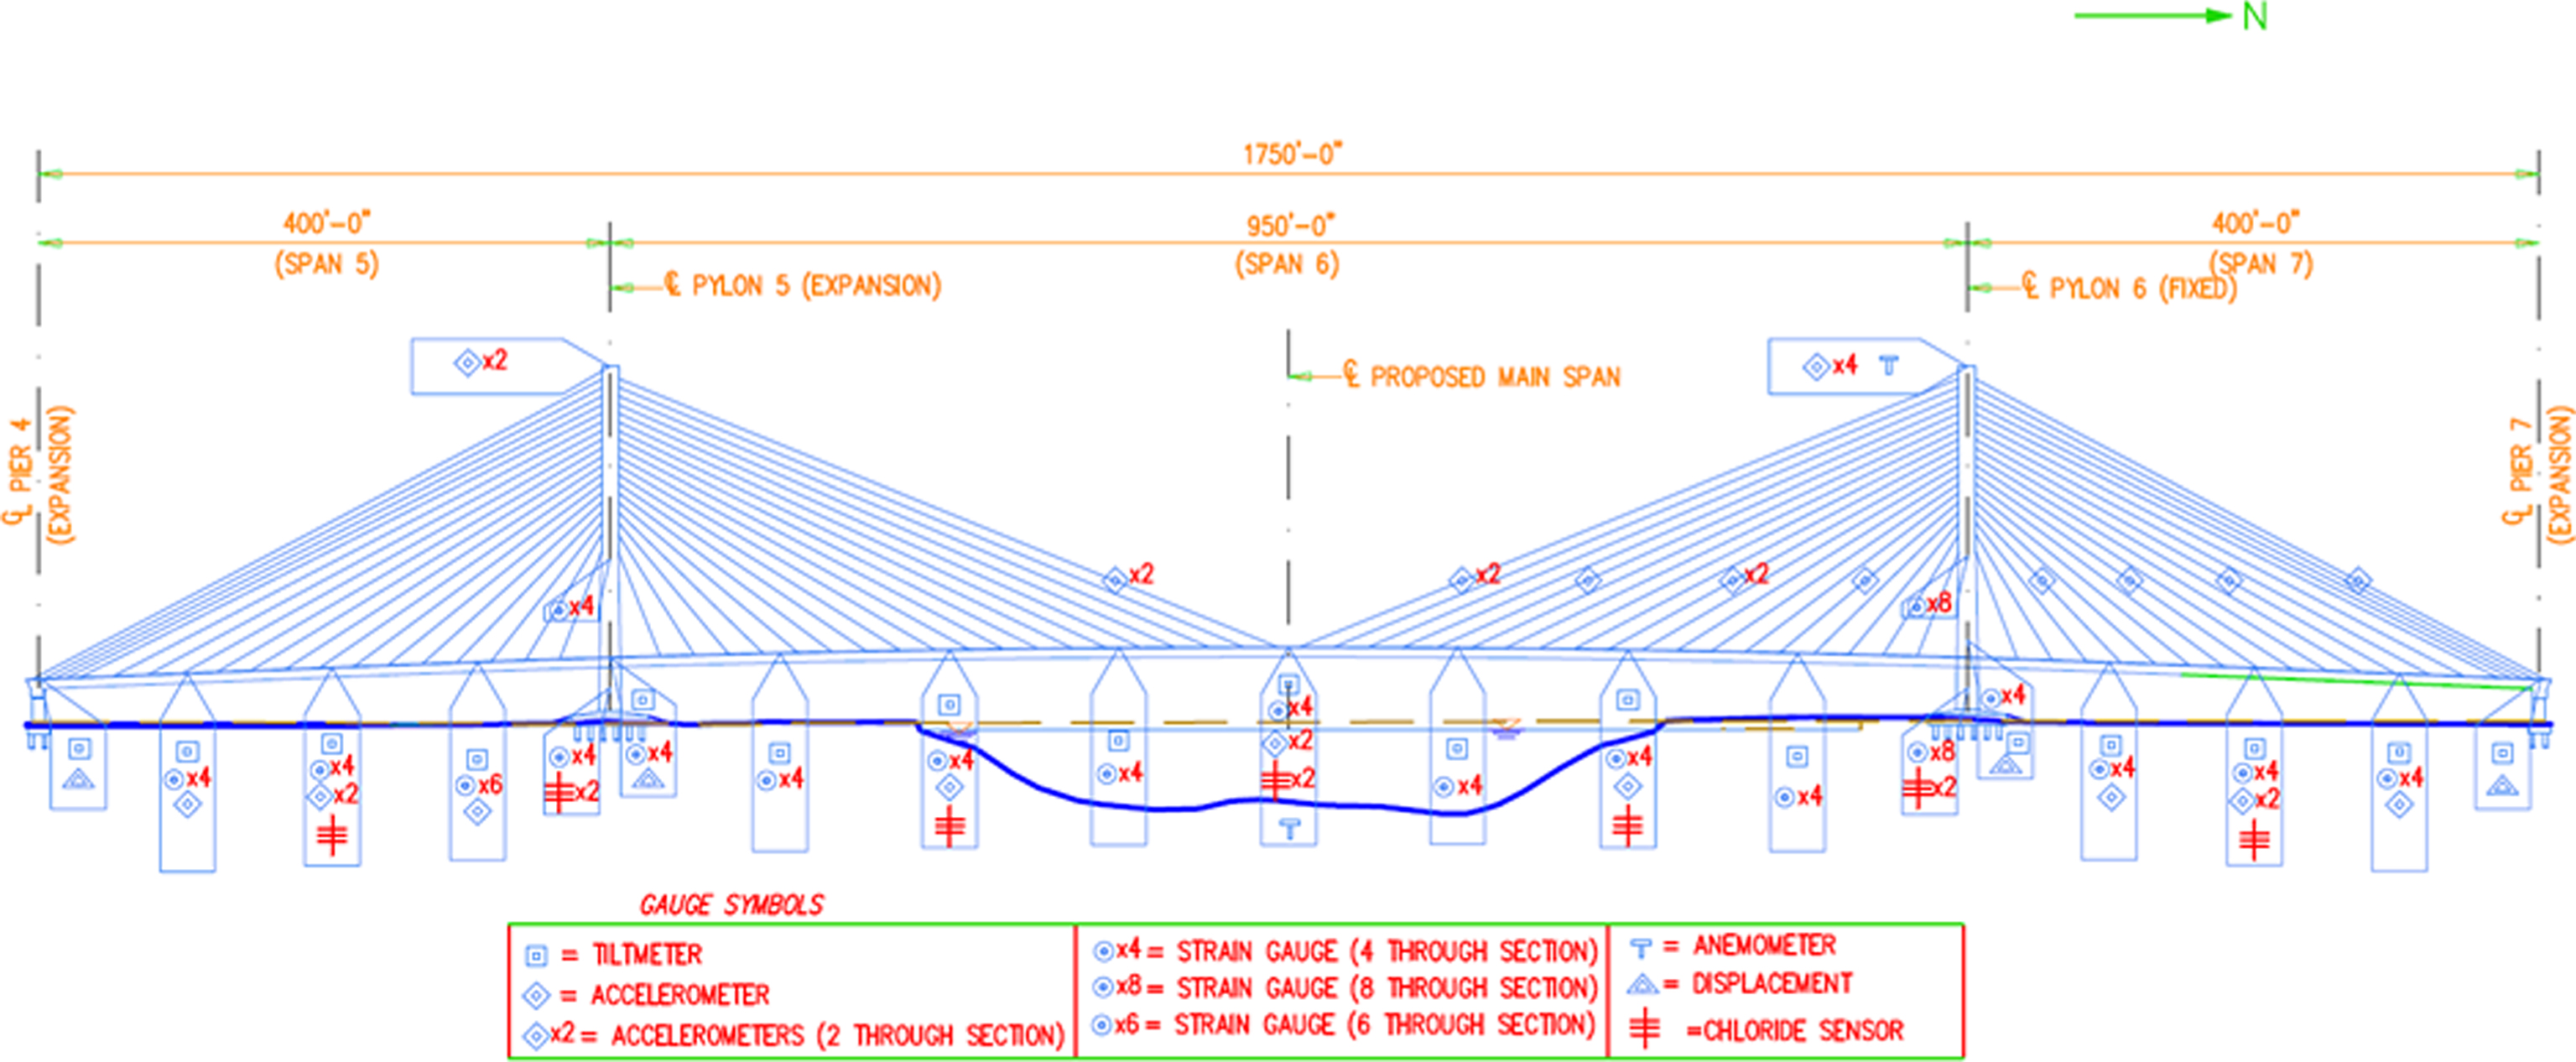
Layout of sensors in the SHM system.
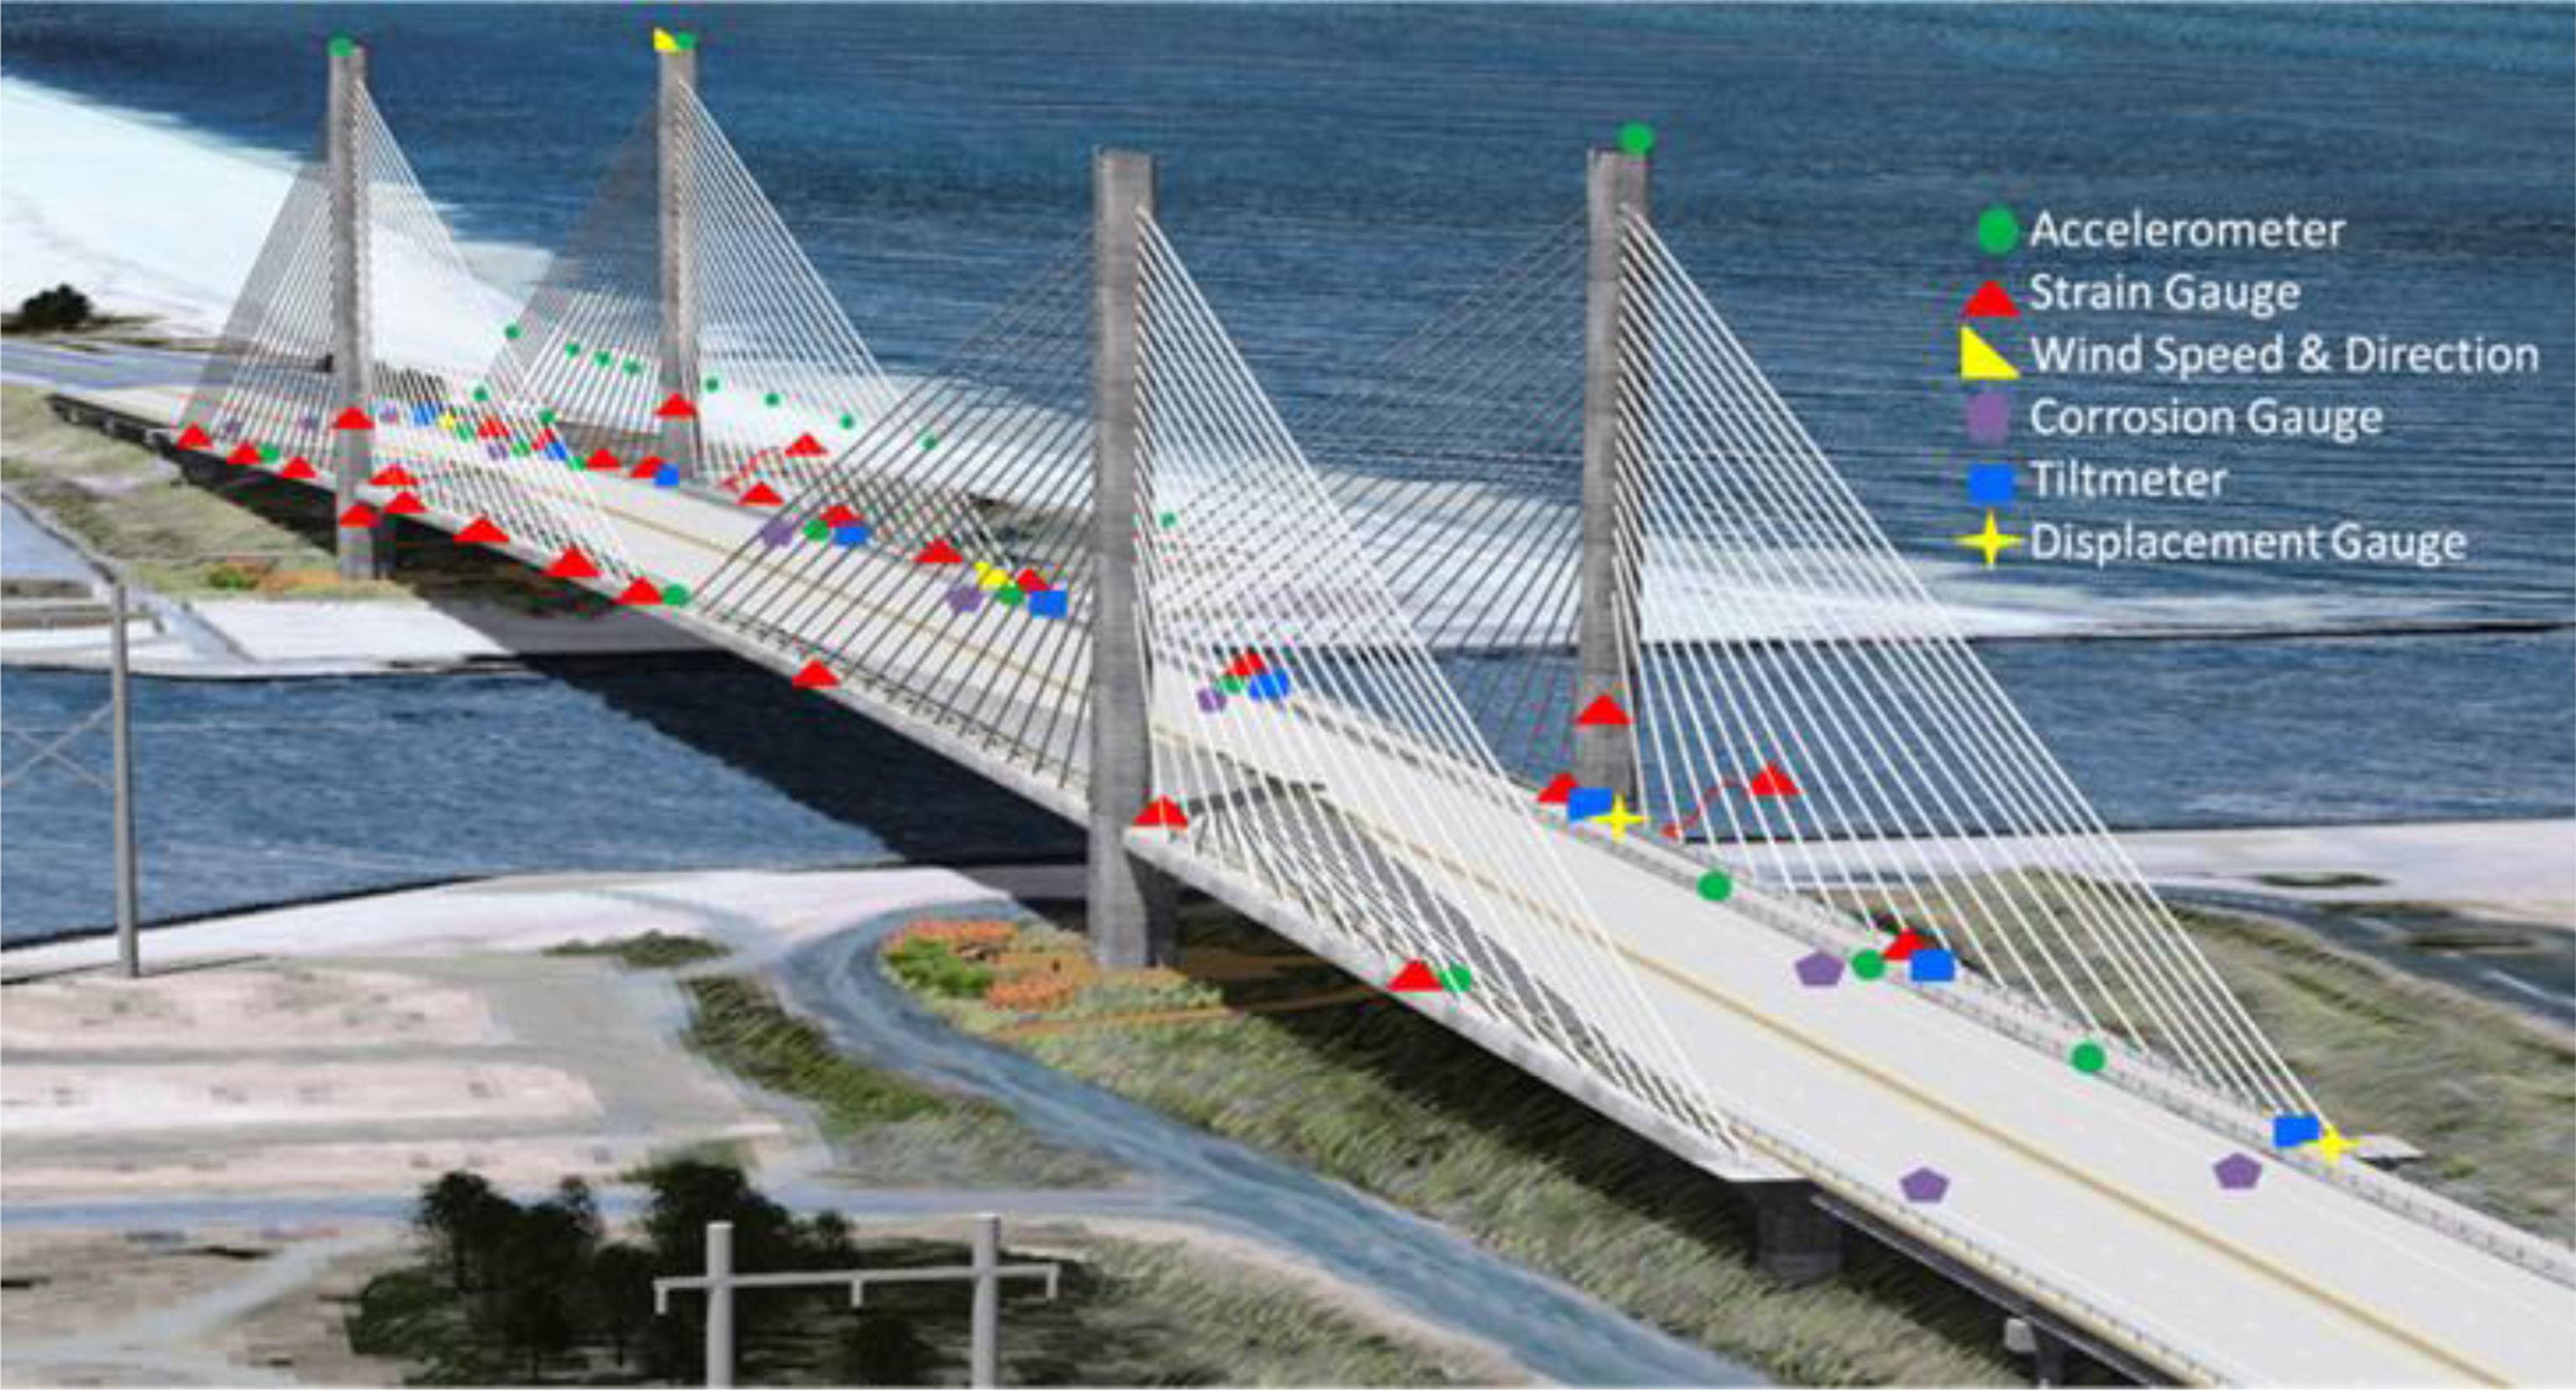
Layout of sensors in the SHM system.
Strains are measured at 70 locations throughout the bridge, including in the edge girders, pylons, and deck. All of the strain measurements are made using Micron Optics os3600 strain sensors (Fig. 7). These sensors include an integral temperature sensor that provides relative temperature change at the sensor location which is needed for accurate strain measurement.
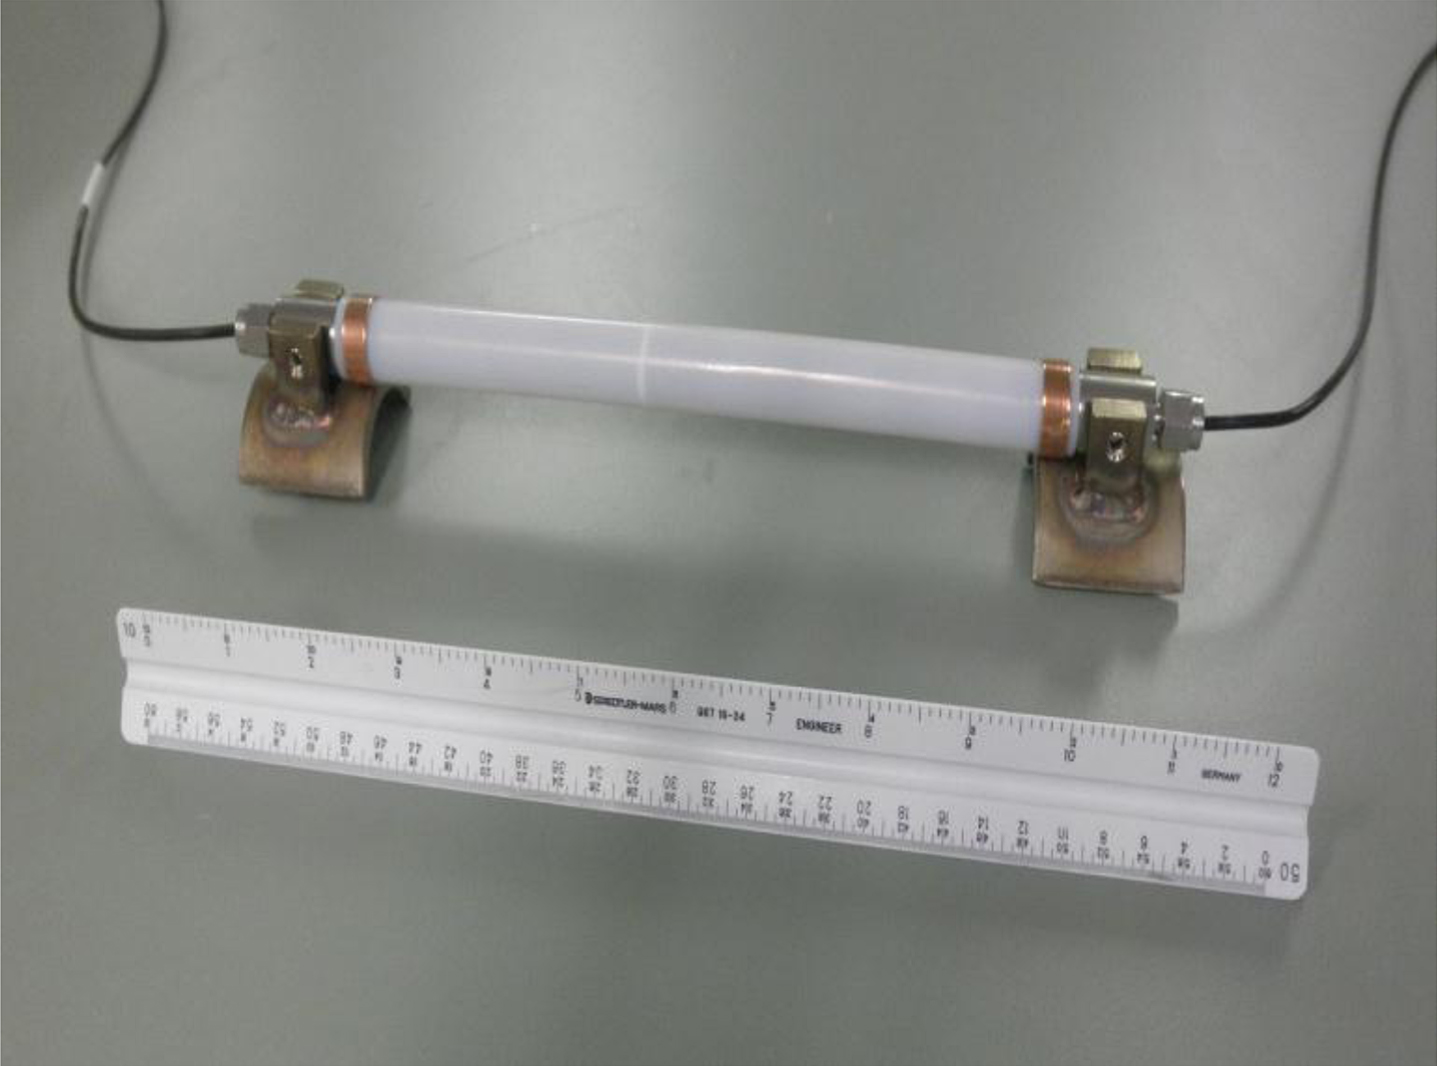
Strain sensor and sensor mounts.
The sensors have a gage length of 25 cm, a range of +/– 2500μɛ, and a sensitivity of 1.2 pm/μɛ. Using a Micro Optics SM130 Interrogator having a wavelength stability of 2 pm, this yields a resolution of 1.67μɛ. Strain is computed based on the change in the wave length and adjusted for the temperature. Equation 1 shows how strain is calculated in the SHM system.
Δλ= Wavelength shift, nm λ∘= Nominal wavelength, nm F
G
= Gage factor, factory value S
Temp
= Temperature sensitivity, pm/°C CTE
Temp
= Coefficient of thermal expansion for the temperature FBG mount, μm/m- °C
Equation 2 shows how the relative temperature of the substrate is calculated.
Where, ΔT
subst
= Change in temperature of the substrate, °C
Strains are measured in the pylons at 24 different locations. The pylon sensors are placed in groups of 4 at different elevations, measuring the vertical (Z direction) strain in each wall of the pylon. In pylon 5 east the strains are measured at the B1 level (elevation 5.5 m) and at the lift T4 level (elevation 35.2 m). In pylons 6 east and 6 west the strains are measured at the lift T1 level (elevation ∼15.9 m) and at the lift T4 level (elevation 35.2 m).
Strains are measured in the edge girders at 44 different locations. These 44 locations correspond to 11 different longitudinal positions along the bridge. The longitudinal positions correspond to approximately 1/8 points on the main span and back spans. At each position, the strain is measured in both the top and bottom of both the east and west edge girders (i.e., 4 unique strain measurements at each longitudinal position). In all cases the strain in the edge girder is measured in the longitudinal (X) direction. At any given edge girder location, the strain is measured in the top and the bottom of the edge girder at approximately 157 mm from the top and bottom face of the girder. The strains are measured at the approximate transverse centerline of the cross section (see Fig. 8).
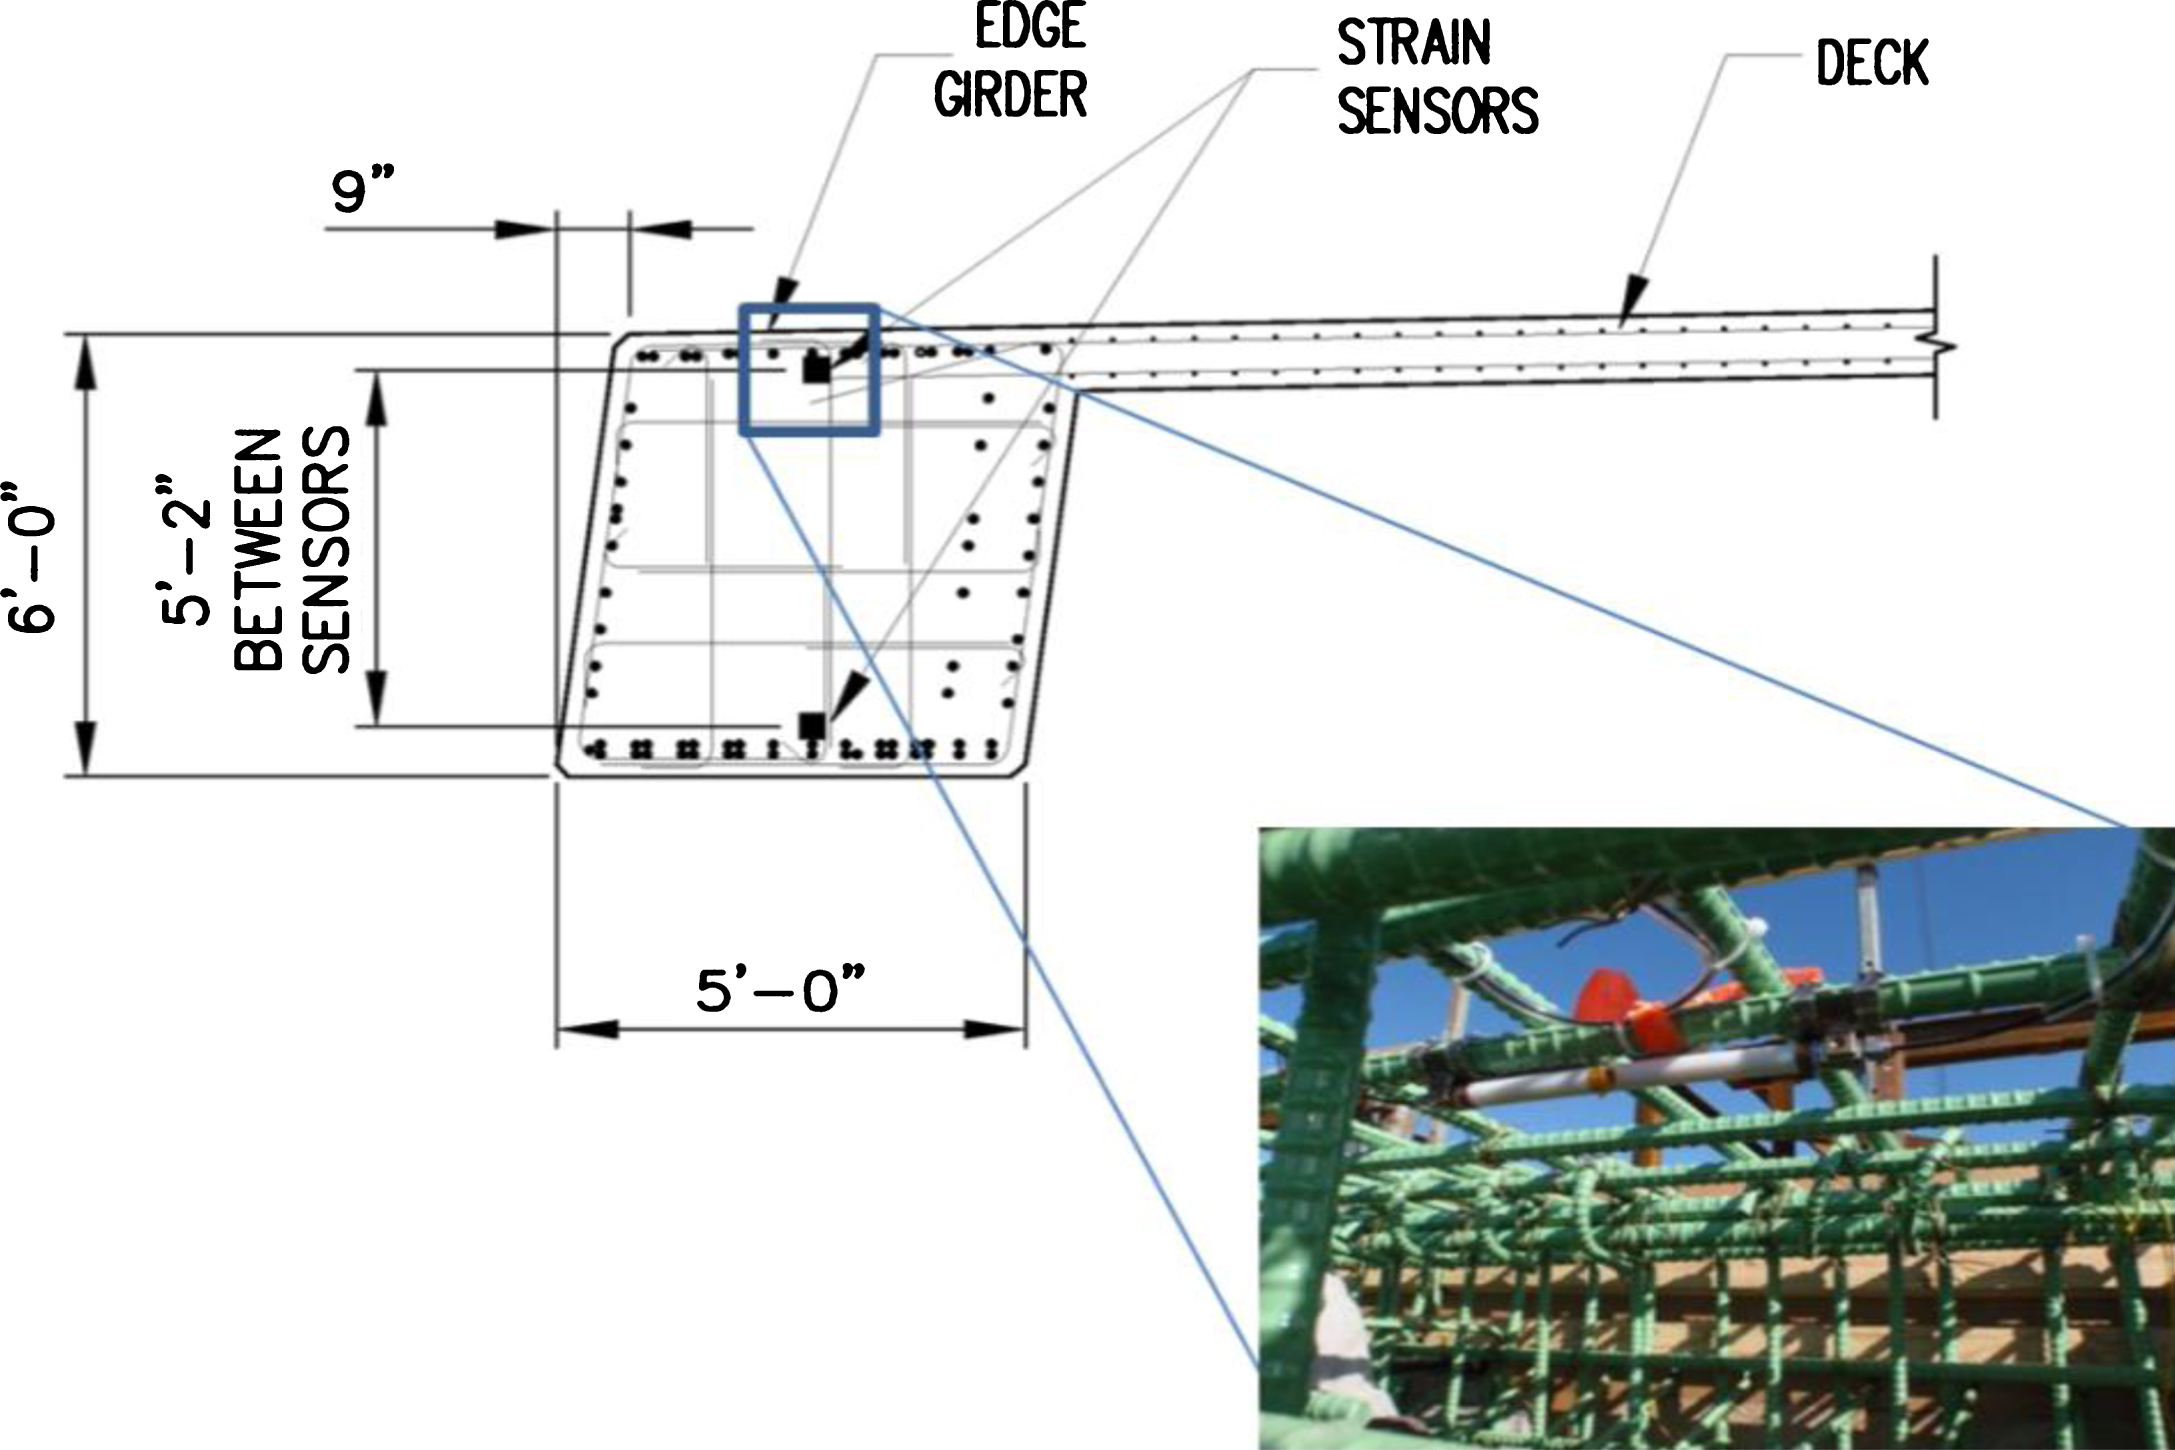
Strain sensor and sensor mounts on edge girder.
Strains are measured at 2 locations in the deck. In both cases the strain is measured in the Y direction (transverse to the travel direction). These sensors are located 152 mm up from the bottom face of the deck and are anchored to the side of the upper mat of rebar.
Stains measurements are used to estimate stresses and member forces in the edge girders, pylons, and the deck. These in turn are used for a variety of purposed including evaluating performance due to heavy trucks, evaluating load distribution, determining load ratings, evaluating thermal effects and monitoring long-term creep and shrinkage, as well as potential structural degradation.
Accelerations are measured at 27 different locations on the bridge using a combination of uniaxial and biaxial Micron Optics model os7100 accelerometers. The accelerometers have a shock tolerance of 100 g, and when using a Micro Optics SM130 Interrogator having a wavelength stability of 2 pm, they have a resolution of 0.025 g. There are a total of 44 unique acceleration measurements.
Accelerations are measured at the top of three of the pylons (pylons 5 east, 6 east, and 6 west). In each of these locations, a biaxial sensor is located to measure motion in the X and Y directions. An additional sensor is located at the top of pylon 6 east, on the west side of the platform, measuring motion in the X direction (this one sensor when used in combination with the other X direction measurement at the top of this pylon is used to infer torsional movement of the pylon) Thus, there are a total of 7 unique pylon acceleration measurements.
Accelerations are measured at 12 different locations on the deck: 9 locations on the east side of the deck and 3 locations on the west side of the deck. At each of these locations the acceleration is measured in the Z (vertical) direction; at 3 locations it is also measured in the Y (transverse) direction. Thus, there is a combination of 9 uniaxial accelerometers and 3 biaxial accelerometers that measure deck accelerations, for a total of 15 unique deck acceleration measurements. The sensor locations correspond to the quarter points and mid-span of the main span and the back spans.
Accelerations are also measured on 11 different stay cables; 9 on the east side and 2 on the west side. At each of these locations a biaxial accelerometer measures acceleration (1) in the plane of the stays and perpendicular to the stay (positive is away from the ground), and (2) perpendicular to the plane of the stays in the positive Y direction. All of the sensors are located approximately 10.7 m above the deck. Thus, there are a total of 22 unique stay acceleration measurements.
Accelerations are used to determine the dynamic characteristics of the bridge, i.e., natural frequencies, mode shapes, and damping ratios. Tracking these properties over time will establish a record for the future that may be used to establish the health of the bridge. The stay accelerometers will be used to estimate the stay cable forces and to measure the damping ratio of the installed stay dampers. Tracking the latter two parameters will ensure the proper functioning of the stays.
Tilt
Tilts, or inclination, of the east edge girder is measured at 9 locations along the girder using FBG Tech model FBG-TI-310 tiltmeters. The sensors have a range of +/– 3 degrees and a sensitivity of 450 pm/degree. Using a Micro Optics SM130 Interrogator having a wavelength stability of 2 pm, this yields a resolution of 0.0044 degrees.
Girder inclinations are measured at both ends of the bridge, the pylons, mid-span, and mid-way between each of these locations. All tilt meters are located on the east side of the bridge. The tilts are measured about the Y axis (i.e., the “pitch” of the girder). Note that the tiltmeters have a response time of 20 sec., thus are effective in measuring only static movements.
Edge girder tilts, measured under controlled vehicle loads, are used to determine the girder profile and integrated to estimate the global deflection of the bridge at key locations. These are indirect measures of the stiffness distribution of the bridge that can be tracked over time. The tilts can also be used to monitor long-term creep and shrinkage effects.
Displacement
Displacements at each of the two expansion joints and at the bearing on pylon 5 east are measured using a Cleveland Electric Labs displacement transducer. The transducers have a resolution of 0.1 mm.
In all cases the transducers are positioned on the east side of the bridge and they measure longitudinal movement, in the direction of traffic, i.e., the X direction.
Bearing displacements, correlated to time and temperature, are used to confirm that the expansion bearings are moving and functioning properly.
Wind speed and direction
Wind speed and direction are measured at the top of pylon 6 west, and at deck level on the east side just south of mid-span. These are measured using R.M. Young model 85106 ultrasonic anemometers. The sensors have a resolution of 0.1 m/s in speed and 1 degree in direction.
The anemometers are analog devices. To integrate them into the optical system, an analog-to-optic convertor is located at the sensor, thereby converting the analog output to an optical signal.
The wind data is used to quantify the nature of wind speed and direction at the bridge site. This can be particularly valuable for triggering the system to record at appropriate frequencies during high wind events.
Chloride
Chlorides in the deck are measured at 10 different locations using a combination of 10 conventional galvanic ladder sensors and 6 fiber-optic chloride sensors.
Chloride ingress in the deck is measured at ten locations using Rohrback Cosasco Systems, Inc., model 900 sensors. The Rohrback sensor is a multi-depth ladder type sensor that provides measurements at four different depths, typically 73, 100, 130, and 159 mm above the bottom face of the deck. Innovative fiber-optic chloride sensors are located concurrent with the Rohr back sensors in 6 different locations. The prototype fiber optic sensors are manufactured by QPS Photonics and utilize a coating that changes reflective properties as it is exposed to chloride.
Chloride measurements are used to indicate the level of chloride penetration into the deck and therefore the potential for steel corrosion. This can be useful for calibrating bridge degradation models.
Security system
Security is a concern today with any major infrastructure. An added advantage of the fiber-optic monitoring system is the ease with which a real-time security system can be implemented. Cameras and sensor pads can be added and become just another type of sensor on the optical network. An integral fiber-optic security system was installed on the IRIB.
Cabling and conduit
The main multi-fiber backbone of the system is routed from the communications enclosure through a conduit located in a barrier on the deck. This is the only conduit that was needed – all other fiber-optic cable is directly embedded in the concrete, except where it is routed to surface mounted sensors. Junction boxes are located along the deck where sensor cables are spliced to the main fiber cable.
Regarding the embedded fiber, the heavily armored cable has been used for many years in the telecommunications industry. It can withstand the thermal and chemical demands of the concrete during the pour and the curing process, and also long after the concrete is cured. Consequently, the fiber cable can be embedded directly in the concrete without the need for conduit. This greatly simplified the installation of the SHM system.
To install the strain sensors, an “array” that included multiple sensors on a single fiber spaced the appropriate distances apart was first shop fabricated. Most strain arrays contained 4 sensors. During installation, one sensor of the array is anchored to the rebar in the appropriate location. The array fiber is then routed to the next sensor location, anchoring it with zip-ties or embedding it in flexible plastic conduit along the way to the next sensor location. The next sensor is anchored and the process is repeated. Finally, the fiber ends were routed to a block-out that could be accessed after the concrete was cast. Every sensor array was tested after it was installed but before the concrete was poured to make sure there were no breaks in the cable or significant attenuation. If a problem was detected, it was rectified before the concrete was cast.
The design provides redundancy in the event an embedded fiber breaks during the pour or sometime in the future as the fiber-optic system can be configured to reach the sensor from either end of the array loop. A sensor would be “lost” only if there were fiber breaks on both sides of a sensor.
Data acquisition and control system
The heart of the fiber-optic system is a pair of 4-channel Micro Optics SM130 Interrogators. Interrogator “A” has a maximum scan rate of 500 Hz; interrogator “B” has a maximum scan rate of 1 kHz. A 16-channel multiplexer is connected to each interrogator thereby increasing the effective number of main fibers for the system to 32. Interrogator “A” normally runs at a rate of 125 Hz and handles all of the sensors except the accelerometers and a few strain sensors. Interrogator B normally runs at a rate of 250 Hz and handles all of the accelerometers and the few remaining strain sensors.
The back end control software for the system is Micro Optic’s “Enlight” software. This is where all of the fundamental control parameters for the system are set and the sensor parameters are stored.
On the front end, the system is running Chandler Monitoring Systems, “Intellioptics” software (Fig. 9). This is a graphical user interface program that provides overall control and database management for the SHM system. Key features of Intellioptics include allowing the user to view real time sensor data broken down by zones, generating reports from archived data using custom specified time windows, using specified thresholds for sensors which, when exceeded, can send text or email alerts to key users, and automatically generating weekly reports that includes key sensor statistics and plot of the data.
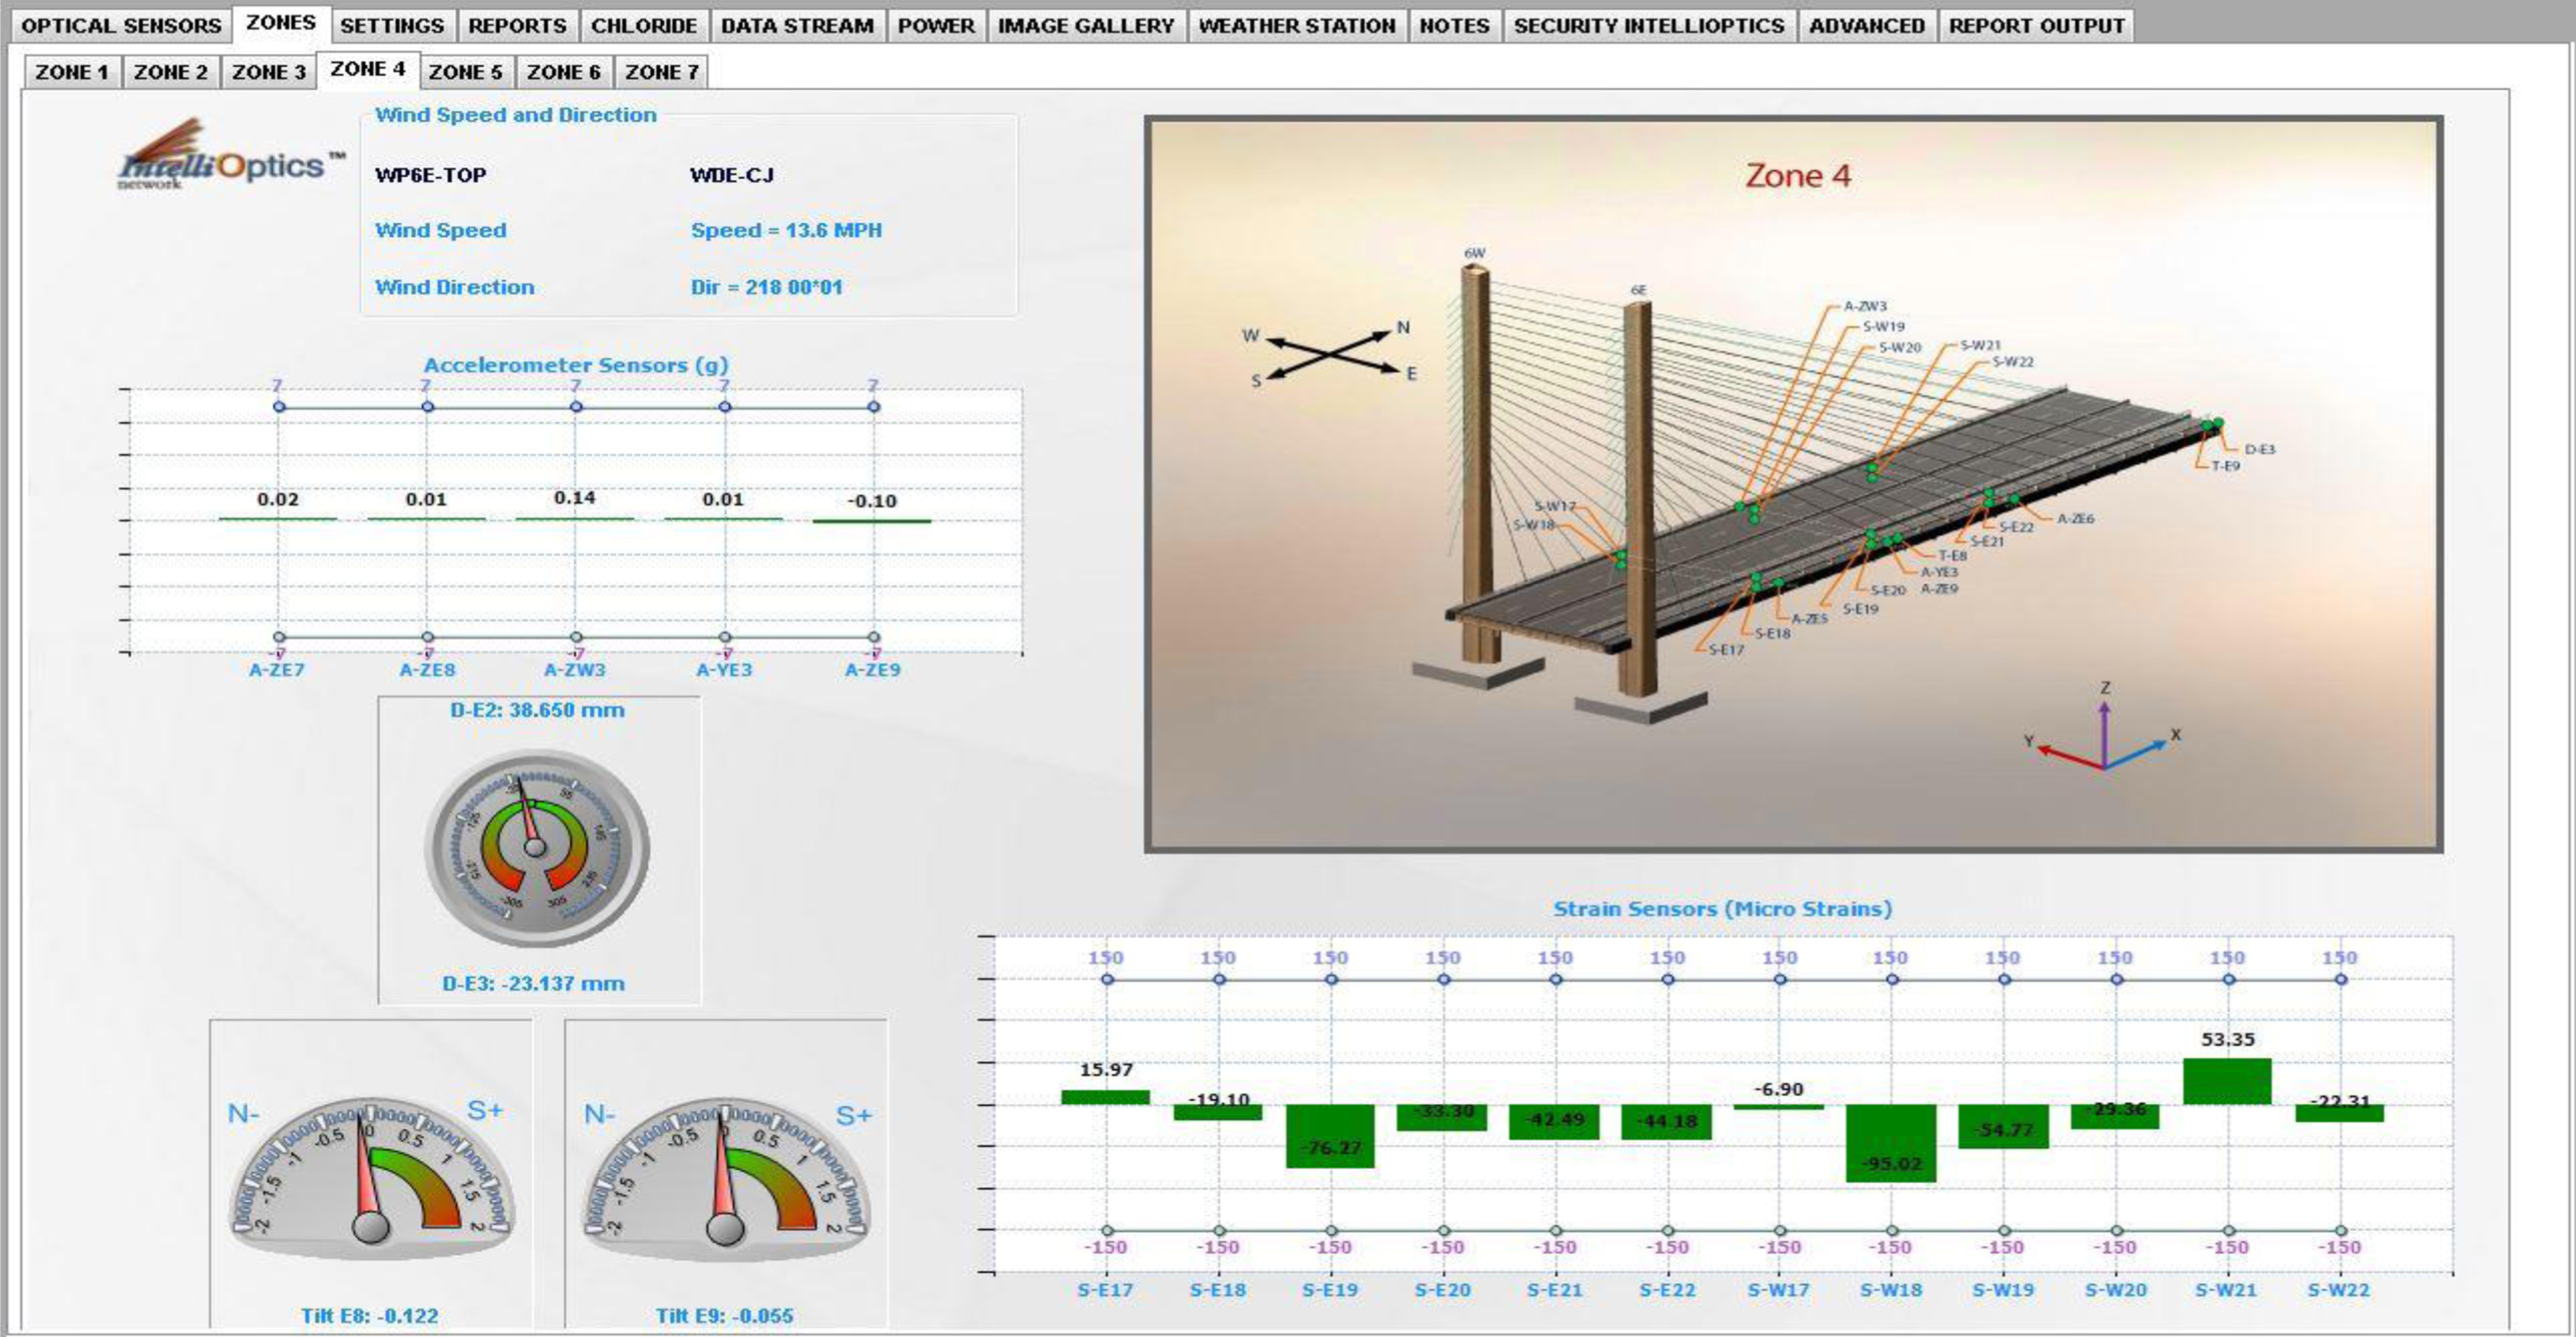
Screen shot of one view of the SHM control system showing sensor readings and sensors in one “zone”.
The total cost of implementing the SHM system was slightly less than one percent of the cost of the bridge. In total, the equipment and installation cost was roughly $1,250,000. Of this amount, the equipment and supplies were $450,000, and the planning and installation cost was $800,000 (or roughly one third for equipment and supplies and two thirds for planning and installation). It should be noted that being a joint effort between UD-CIBrE and CEL/CMS, some of the personnel on the project were university faculty, full-time university staff, and graduate students who have a somewhat different salary structure than industry personnel. It is interesting to note that at roughly one percent of the overall project cost, the system implementation cost is well within the contingency budget for the project.
Operation of the SHM system
The SHM system operates 24/7. During operation two basic types of data are collected: “monitor” data and “event” data. Monitor data is collected continuously at both low and high frequency. For low frequency data, a single average sensor reading, computed from data taken at 125 Hz over a 10-minute period, is recorded. For high frequency data, the data is continuously recorded at 25 Hz. The monitor data is used to quantify the response due to ambient live loads and well as to monitor long-term, gradual variations in bridge behavior. These long-term variations might be due to daily or seasonal thermal variations or slow degradation due to environmental effects or sustained load.
Event data recording takes place periodically and on demand when high winds are expected at the bridge site. Event data is recorded at a relatively high frequency (167 Hz) and is intended to be used to evaluate the bridge response during infrequent “high intensity” dynamic events. Future upgrades in the system software should allow for automatic triggering of high frequency event data.
Data analysis and reporting
The primary function of the SHM system is to provide quantitative data on the response of the bridge over time that can be used by DelDOT’s Bridge Management group to better manage and maintain the structure. The data is continually collected and results summarized and reported in Quarterly Reports. The quarterly reports are broken into five sections.
The first section is “Alerts.” Within this section, any alerts that were triggered during the quarter are listed. Each sensor has a threshold value assigned, and when that threshold value is exceeded, an alert is sent via text to designated individuals at DelDOT.
The second section of the quarterly report is titled “Key Comparisons at Critical Locations.” In this section, minimum and maximum values of measured strains at key locations, measured expansion joint movements, computed rating factors, and measured ambient temperatures during quarter are tabulated. These values are also compared to historical minimum and maximum values.
The third section of the report is titled “Plots.” In this section, key plots summarizing measured strains, measured expansion joint movements, computed rating factors, and measured ambient temperatures are presented.
The fourth section of the report is titled “Senor Table.” In this section, a table summarizing the quarterly minimum and maximum values, historical minimum and maximum values for all sensor are presented. The functional status of each sensor is also listed.
The fifth and final section is titled “Observations.” In this section, comments are made related to the status of any malfunctioning sensors, anomalies in data, presence of any permit vehicles, and the occurrence of any “events” such as weather of accidents. This section will also provide comments on any observations of note.
Based on the data collected and tabulated in the quarterly reports, UD CIBrE makes an annual presentation to DelDOT summarizing the years monitoring. Over time, these quarterly and annual reports and presentations will enable changes in bridge performance to be monitored and assessed and they will become part of the bridge’s permanent inspection records.
Conclusions
The new Indian River Inlet Bridge in Delaware was opened to full traffic in May of 2012. The concrete cable stayed bridge was designed and built under a design/build contract by Skanska/AECOM. A state-of-the-art fiber-optic based structural monitoring system was designed and installed on the bridge, under the direction of the University of Delaware, Center for Innovative Bridge Engineering. The SHM system has been in operation since the bridge opened and is continuously monitoring the structure. The all fiber-optic system was designed to provide quantitative data on the response of the bridge for many years to come. The data is becoming part of the inspection record of the bridge, and is being used to better manage and maintain this significant infrastructure for the state. To the best of the author’s knowledge, this is the first comprehensive SHM system of its kind to be installed on a new cable supported bridge in the United States. In that regard it serves as a test bed for other SHM systems and other bridges around the country. It is hoped that this and the companion paper will be of benefit to owners and engineers who wish to design and implement their own SHM systems on long-span bridges.
Footnotes
Acknowledgments
The authors would like to acknowledge the financial support of the Delaware Department of Transportation (DelDOT) and the Federal Highway Administration for the project. They would also like to acknowledge Mr. Doug Robb (formerly DelDOT) and Mr. Craig Stevens of DelDOT, Jason Arndt of DelDOT, Mr. Jim Zammataro (formerly Cleveland Electric Labs), and Mr. Keith Chandler of Cleveland Electric Labs (formerly Chandler Monitoring Systems) for their time and effort working on the project. We would further like to acknowledge the many University of Delaware students who worked on the project including Jack Cardinal, Patrick Carson, Kent Davidson, and Pablo Marquez.