
Abstract
Simple-span precast prestressed girders can achieve continuity, which in turn eliminates deck joints and protects the reinforcement from corrosion by preventing water leaks. The study presents a method to create continuity by casting a continuity diaphragm over supports and then post-tensioning the top end of the girders. The method exhibits all the advantages of a continuously post-tensioned technique. In the study, a bridge with three continuous spans was tested by using different truck loads at different positions. Stress on the girders and diaphragm were monitored by using the attached and impeded strain gages and a rosette. A three-dimensional finite element model was developed by using ANSYS and validated for the tested bridge. The FE model was used to analyze the transfer of stress between adjacent girders and spans. The results of FE model analysis indicated a strong correlation with the live load test data. Additionally, the results of the parametric study indicated that post-tensioning for continuity decreases the positive moments in the girders and leads to an increase in the transfer of stress between adjacent spans. It is expected that the results of the study will provide baseline data for these types of bridges.
Introduction
The concept of making continuous bridges by using pre-cast prestressed girders was executed since 1960 through casting-in situ concrete slab and diaphragms [1, 2]. It is a construction option that is considered for the most economical bridges by increasing span lengths or girder spacing. The main advantage of continuous precast prestressed-concrete girder bridges is that they eliminate deck joints [3] that protect the girder end from deterioration, and protect the reinforcement from corrosion by preventing water leaks. Therefore, the elimination of deck joints reduces long-term maintenance costs [4, 5] and extends the service life of bridges [6]. Continuity also improves the appearance and riding qualities of these types of bridges.
A continuous prestressed precast concrete girder is designed as a pre-cast pre-tensioned simple supported girder, and continuity is then introduced by casting continuity and intermediate diaphragm between the girders. Reinforcement of the diaphragm and connecting the ends of girders is necessary to resist moments and prevent cracks. Over time, prestressed girders are subject to creep, shrinkage, and thermal effects that cause the girders to camber. The camber leads to the development of a positive moment at the continuity diaphragm. As shown in Fig. 1, connections resist positive moments [7]. Different positive moment connections are suggested. An early study in 1960 by Mattock and Kaar connects the continuity diaphragm in the positive moment region by using bent bars [8]. In 1969, Freyermuth proposed an improved method to design positive moment connection, and the method (PCA method) was based on time dependent analysis [9]. In the study, post-tensioning the top of the girders was implemented to resist negative moments by coupling the top of the girders and pre-compression continuity diaphragms. The construction sequence was as follows, erect post-tensioned precast members with reinforcement extending beyond member ends at interior joints. Form, pour, and cure continuity and intermediate diaphragm wherein the diaphragm is used to connect the girders. It is in contact with the bridge deck to carry a compressive force and moments of the connection region. The continuity tendons are post-tensioned and anchored to the girders at a certain distance from the interior ends. The continuous deck is formed, poured, and cured. The temporary beds over the girder interior ends are replaced by a bed over the continuity diaphragm as shown in Fig. 2. The continuity is fulfilled for live and impact loads, and the girders deflect under dead load at a simple-span condition prior to achieving continuity. This is termed as a live-load continuous connection. The performance and design of this type of bridge are examined [7–10]. Wang W-W et al. and others used the concept of post-tensioning at the negative moment region to strengthen old bridges [11–13]. Post-tensioning at the negative moment region shown an increase in prestress level [14]. Sun, C., et al., developed and implemented a threaded rod system to ensure that precast concrete girders are continuous [15]. Various forms of continuity connections are discussed in several extant studies [16–19].

Positive moment connection.
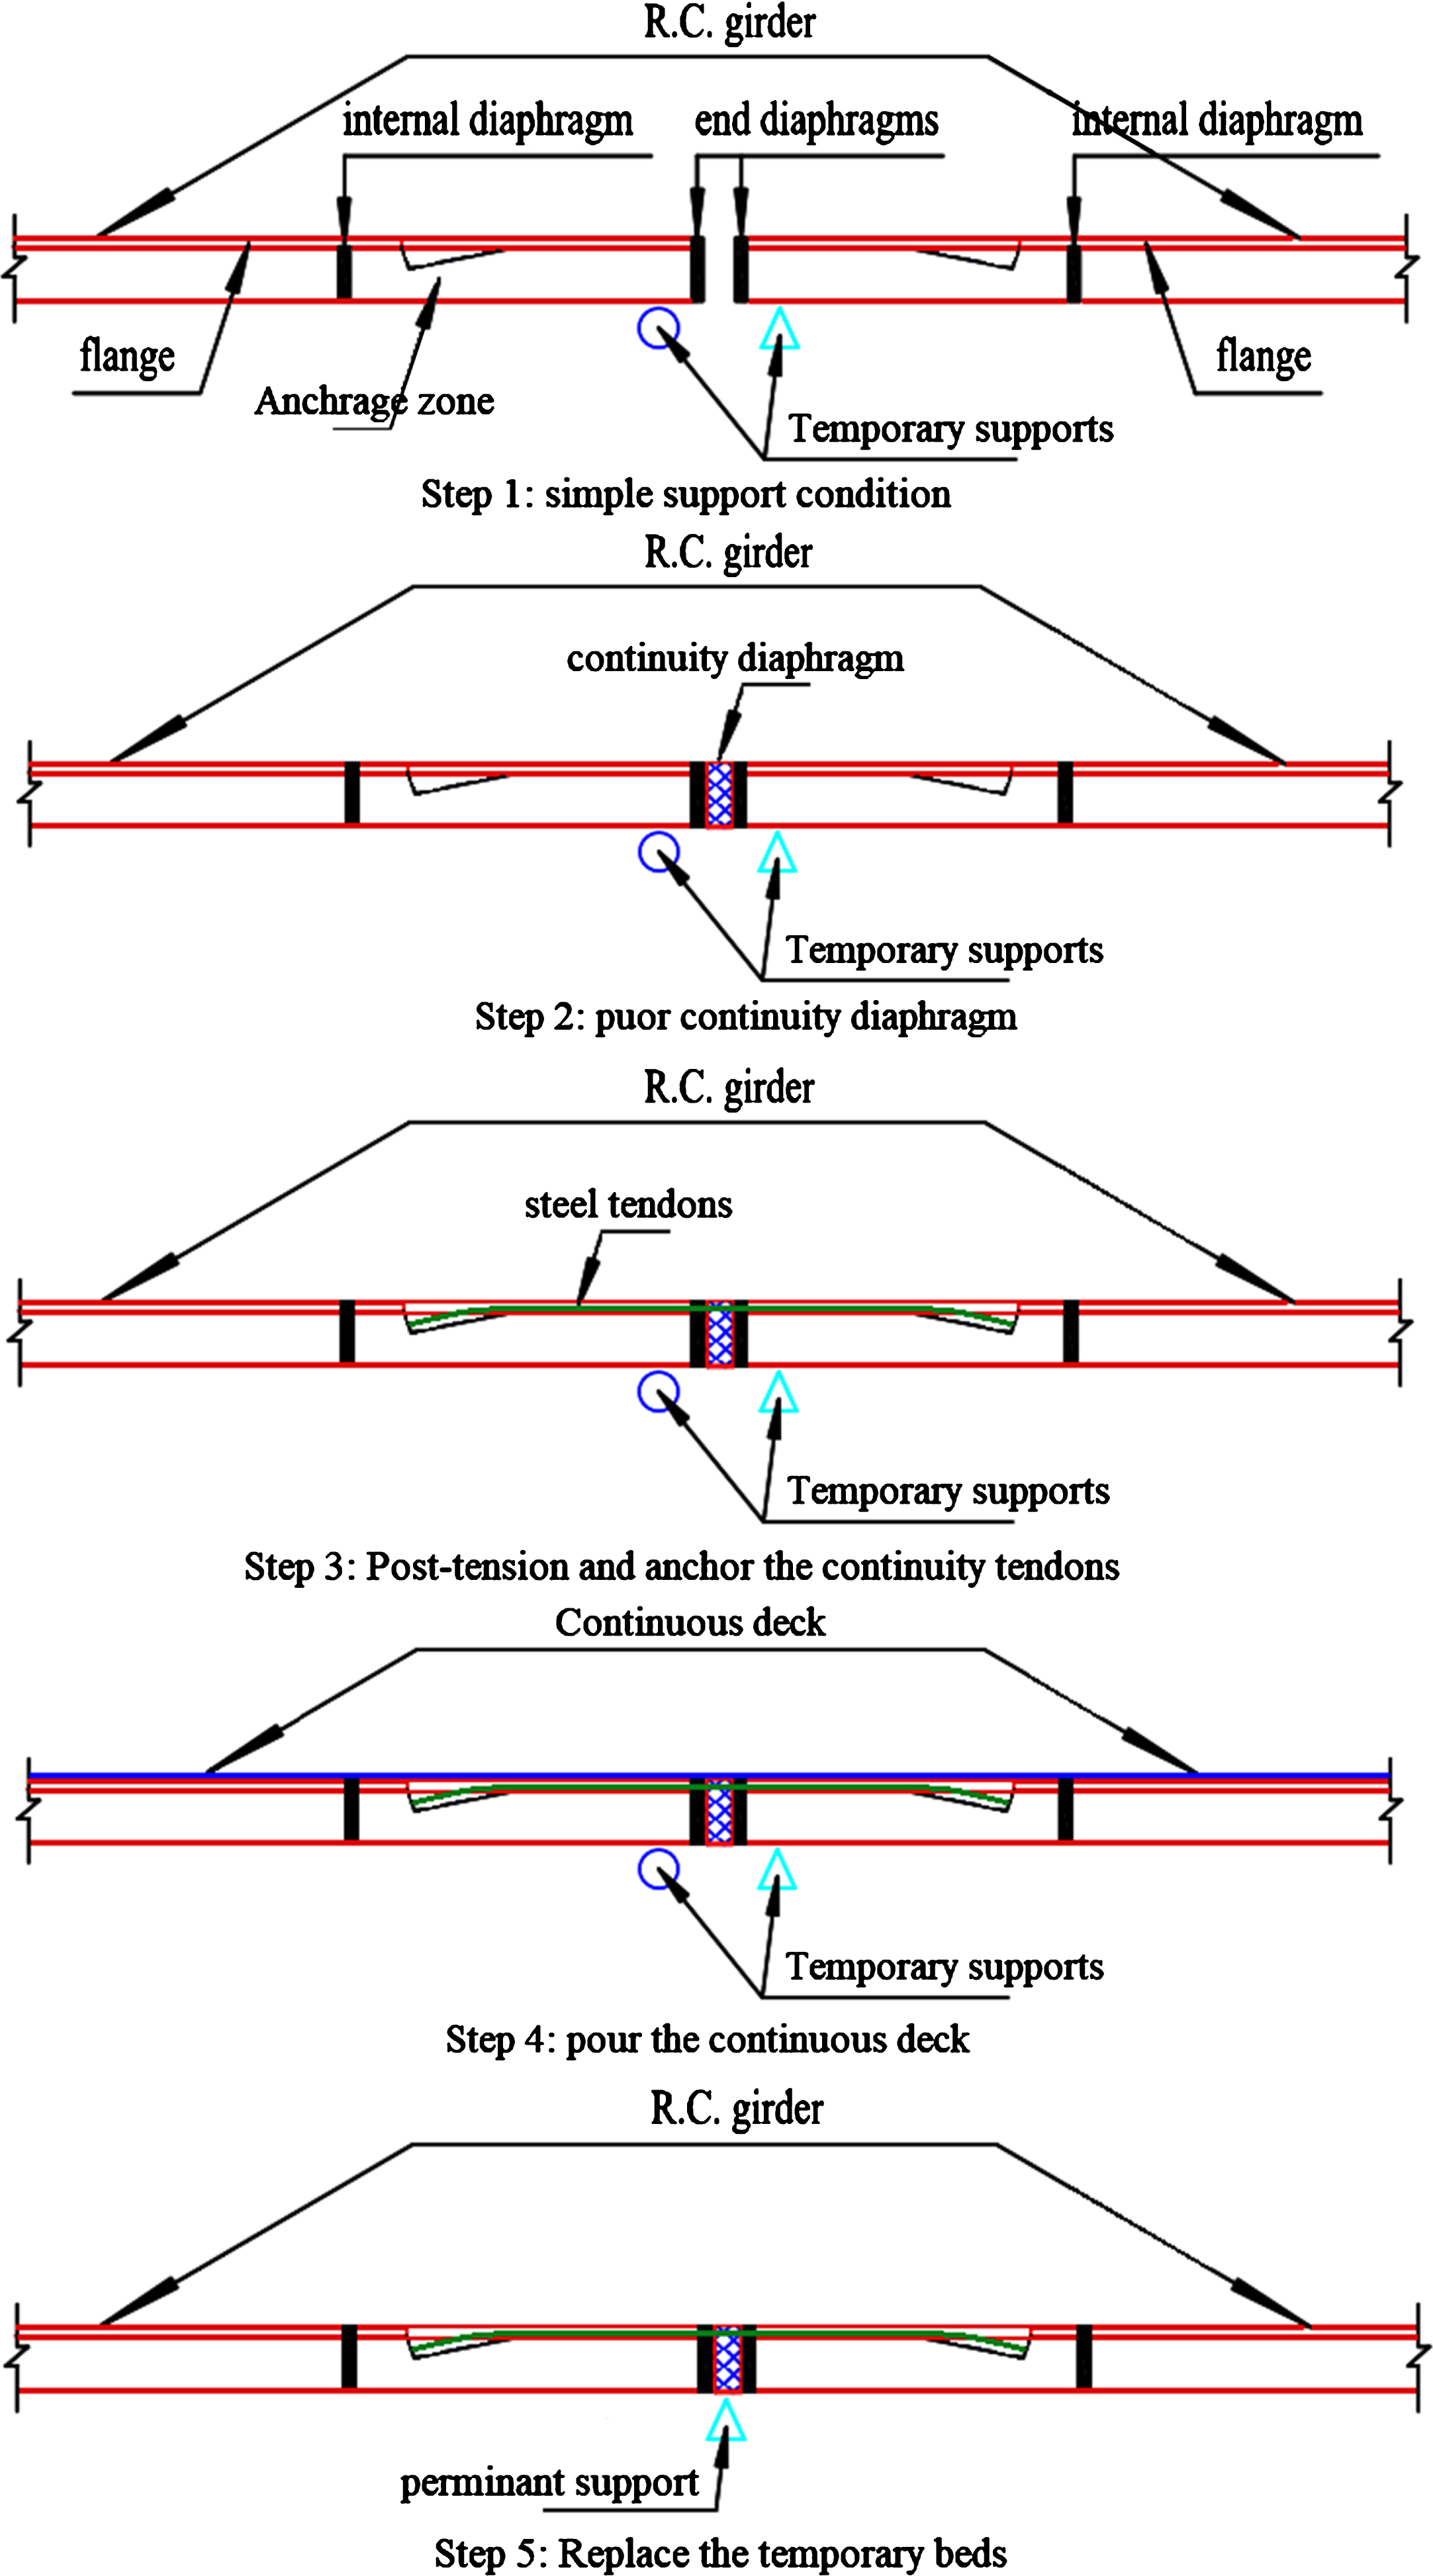
Construction sequence.
The present study examines the stress distribution on t post-tensioning in a negative-moment region for continuity bridges under truck loading. A Baobei bridge was used in the study to address stress distribution due to truck-loading. A three-dimensional finite-element model was developed for the bridge. The model was validated via field-test data. Subsequently, the validated FE model was used to analyze the transfer of stress between adjacent girders and to investigate the post-tensioning efficiency for continuity by varying model properties.
Bridge description
In the study, the Baobei bridge is tested for a live-load distribution. The bridge consists of three continuous spans that are constructed as simple support post-tension girders and continuity is subsequently achieved through post-tensioning the top end of the girders as shown in the construction sequence in Fig. 2. The total length of the bridge is approximately 120 m. Figure 3 shows the main dimension of the bridge wherein the structures are not skewed. The deck exhibits a width of 12.25 m that is measured between the outer ends of the barriers. The roadway width is 11.25 m and is measured between the inner ends the barriers on five prestressed T girders with a spacing of 247 cm. The continuity diaphragm exhibits the same cross-section as that of the girders. The intermediate diaphragms exhibit a depth of 219 cm and are 18 cm thick. The part was casted with the girders and other parts are cast in situ in advance to ensure strengthening for continuity. The 8-cm RC continuous deck is monolithically cast. The compressive strength of the deck is 38.3 MPa. Typically, structures exhibit 105-cm tall solid reinforced concrete barriers (wherein the width varies from 50 cm at the base to 20 cm at the top) and without any sidewalks. The bridge is constructed by using T girders. Figure 5(a) shows the girder cross section at the support, and Fig. 5(b) shows that at the mid-span. The compressive strength of the girder is 38.3 MPa. The girder is prestressed with seven-wire strands in the stage of a simply supported and continuity connection that exhibits an ultimate stress of 1860 MPa. The jacking stress is 1395 MPa. The profiles and dimensions of the continuity cables (T1, T2, and T3) are shown in Fig. 4. The girders are prestressed by using a curved strand profile. The location of the prestressed strand (N1, N2, N3, N4, and N5) is shown in Fig. 5(c). The girders are supported by a bearing pad at the continuity diaphragm over the typical pile. The form of the span is denoted as spans 8, 9, and 10. The five girders are denoted as 1, 2, 3, 4, and 5.
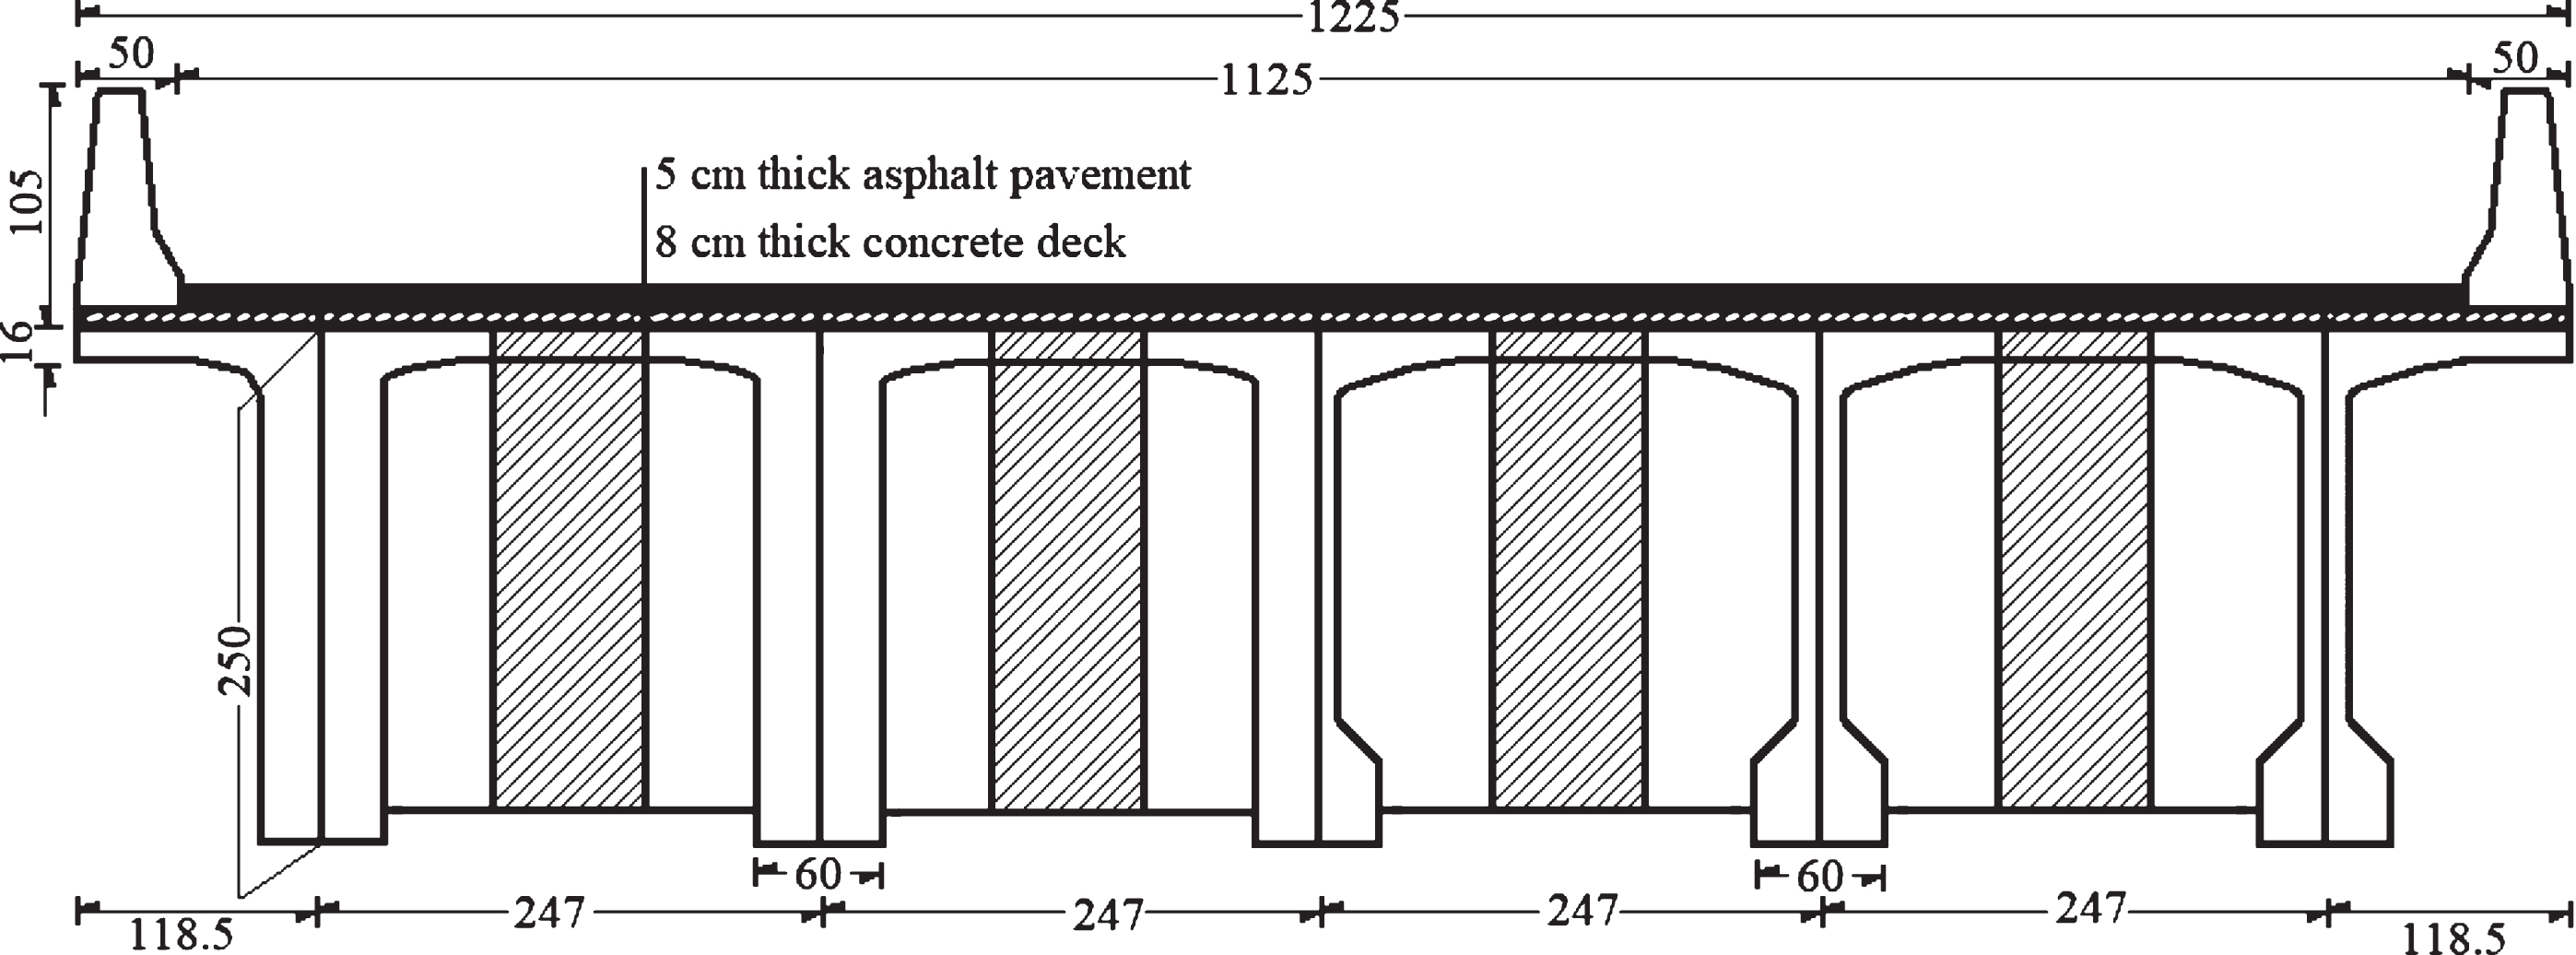
Main dimension and cross section of the bridge.
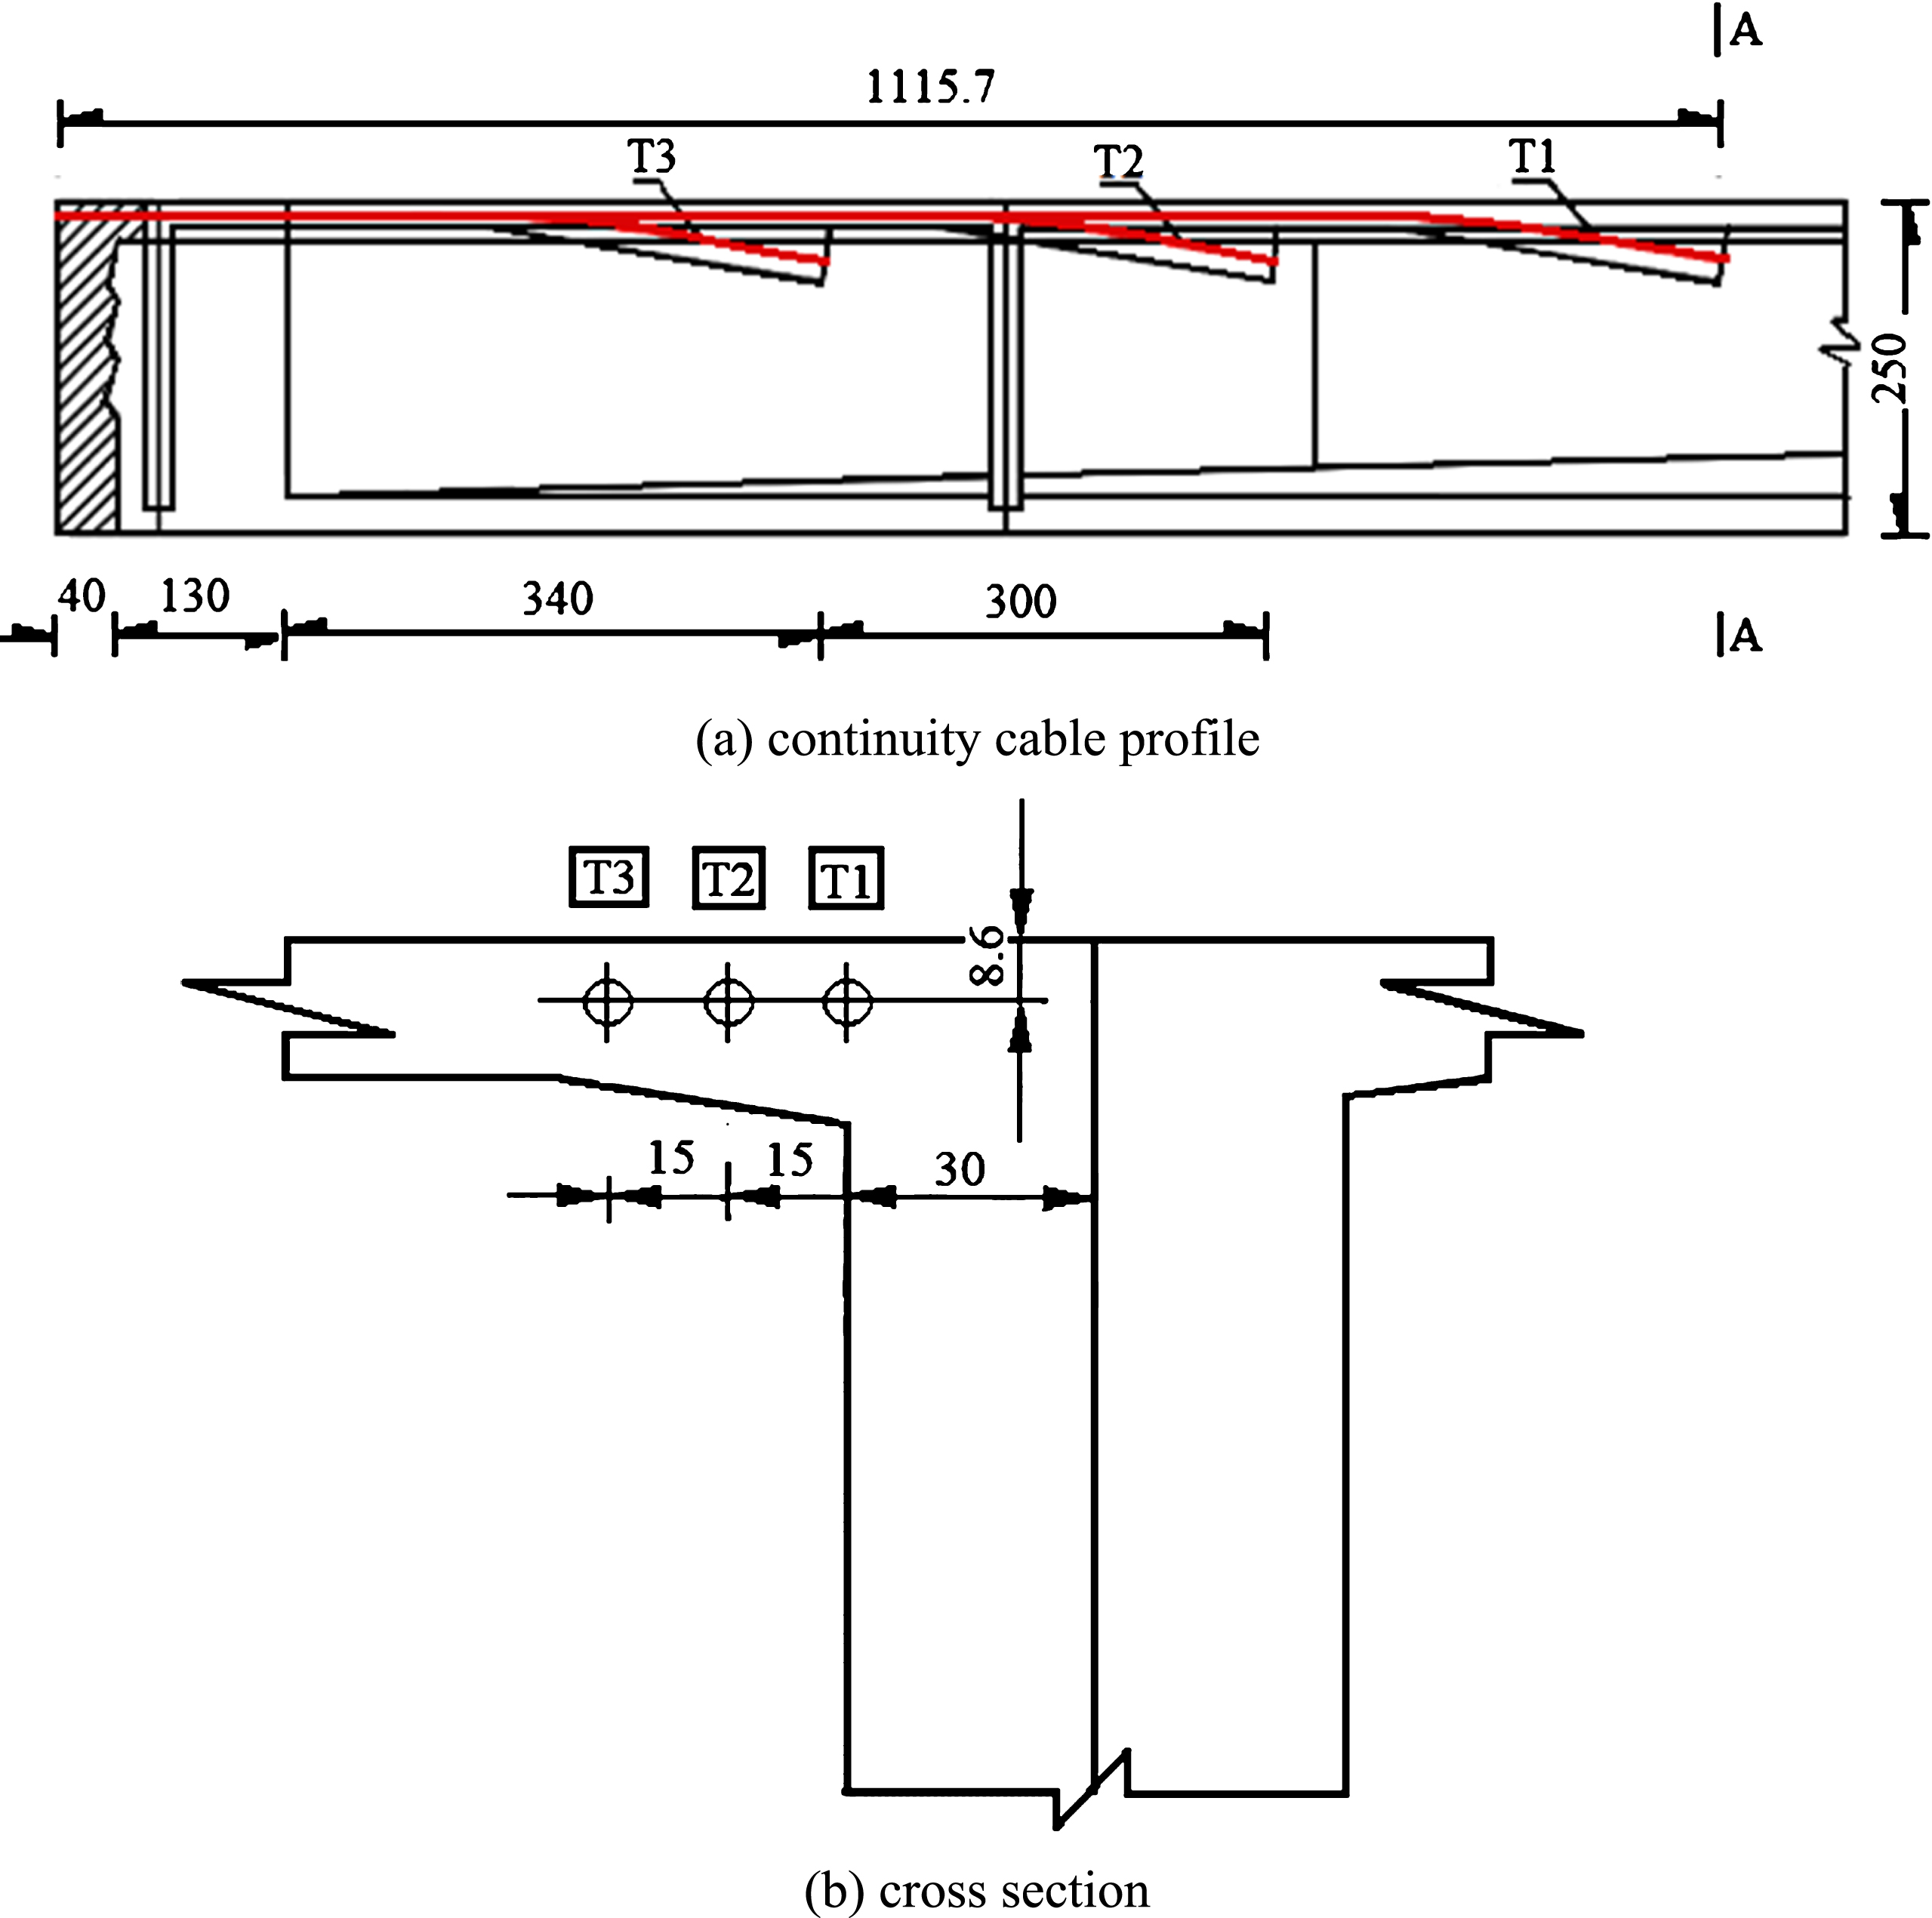
Continuity cable details.
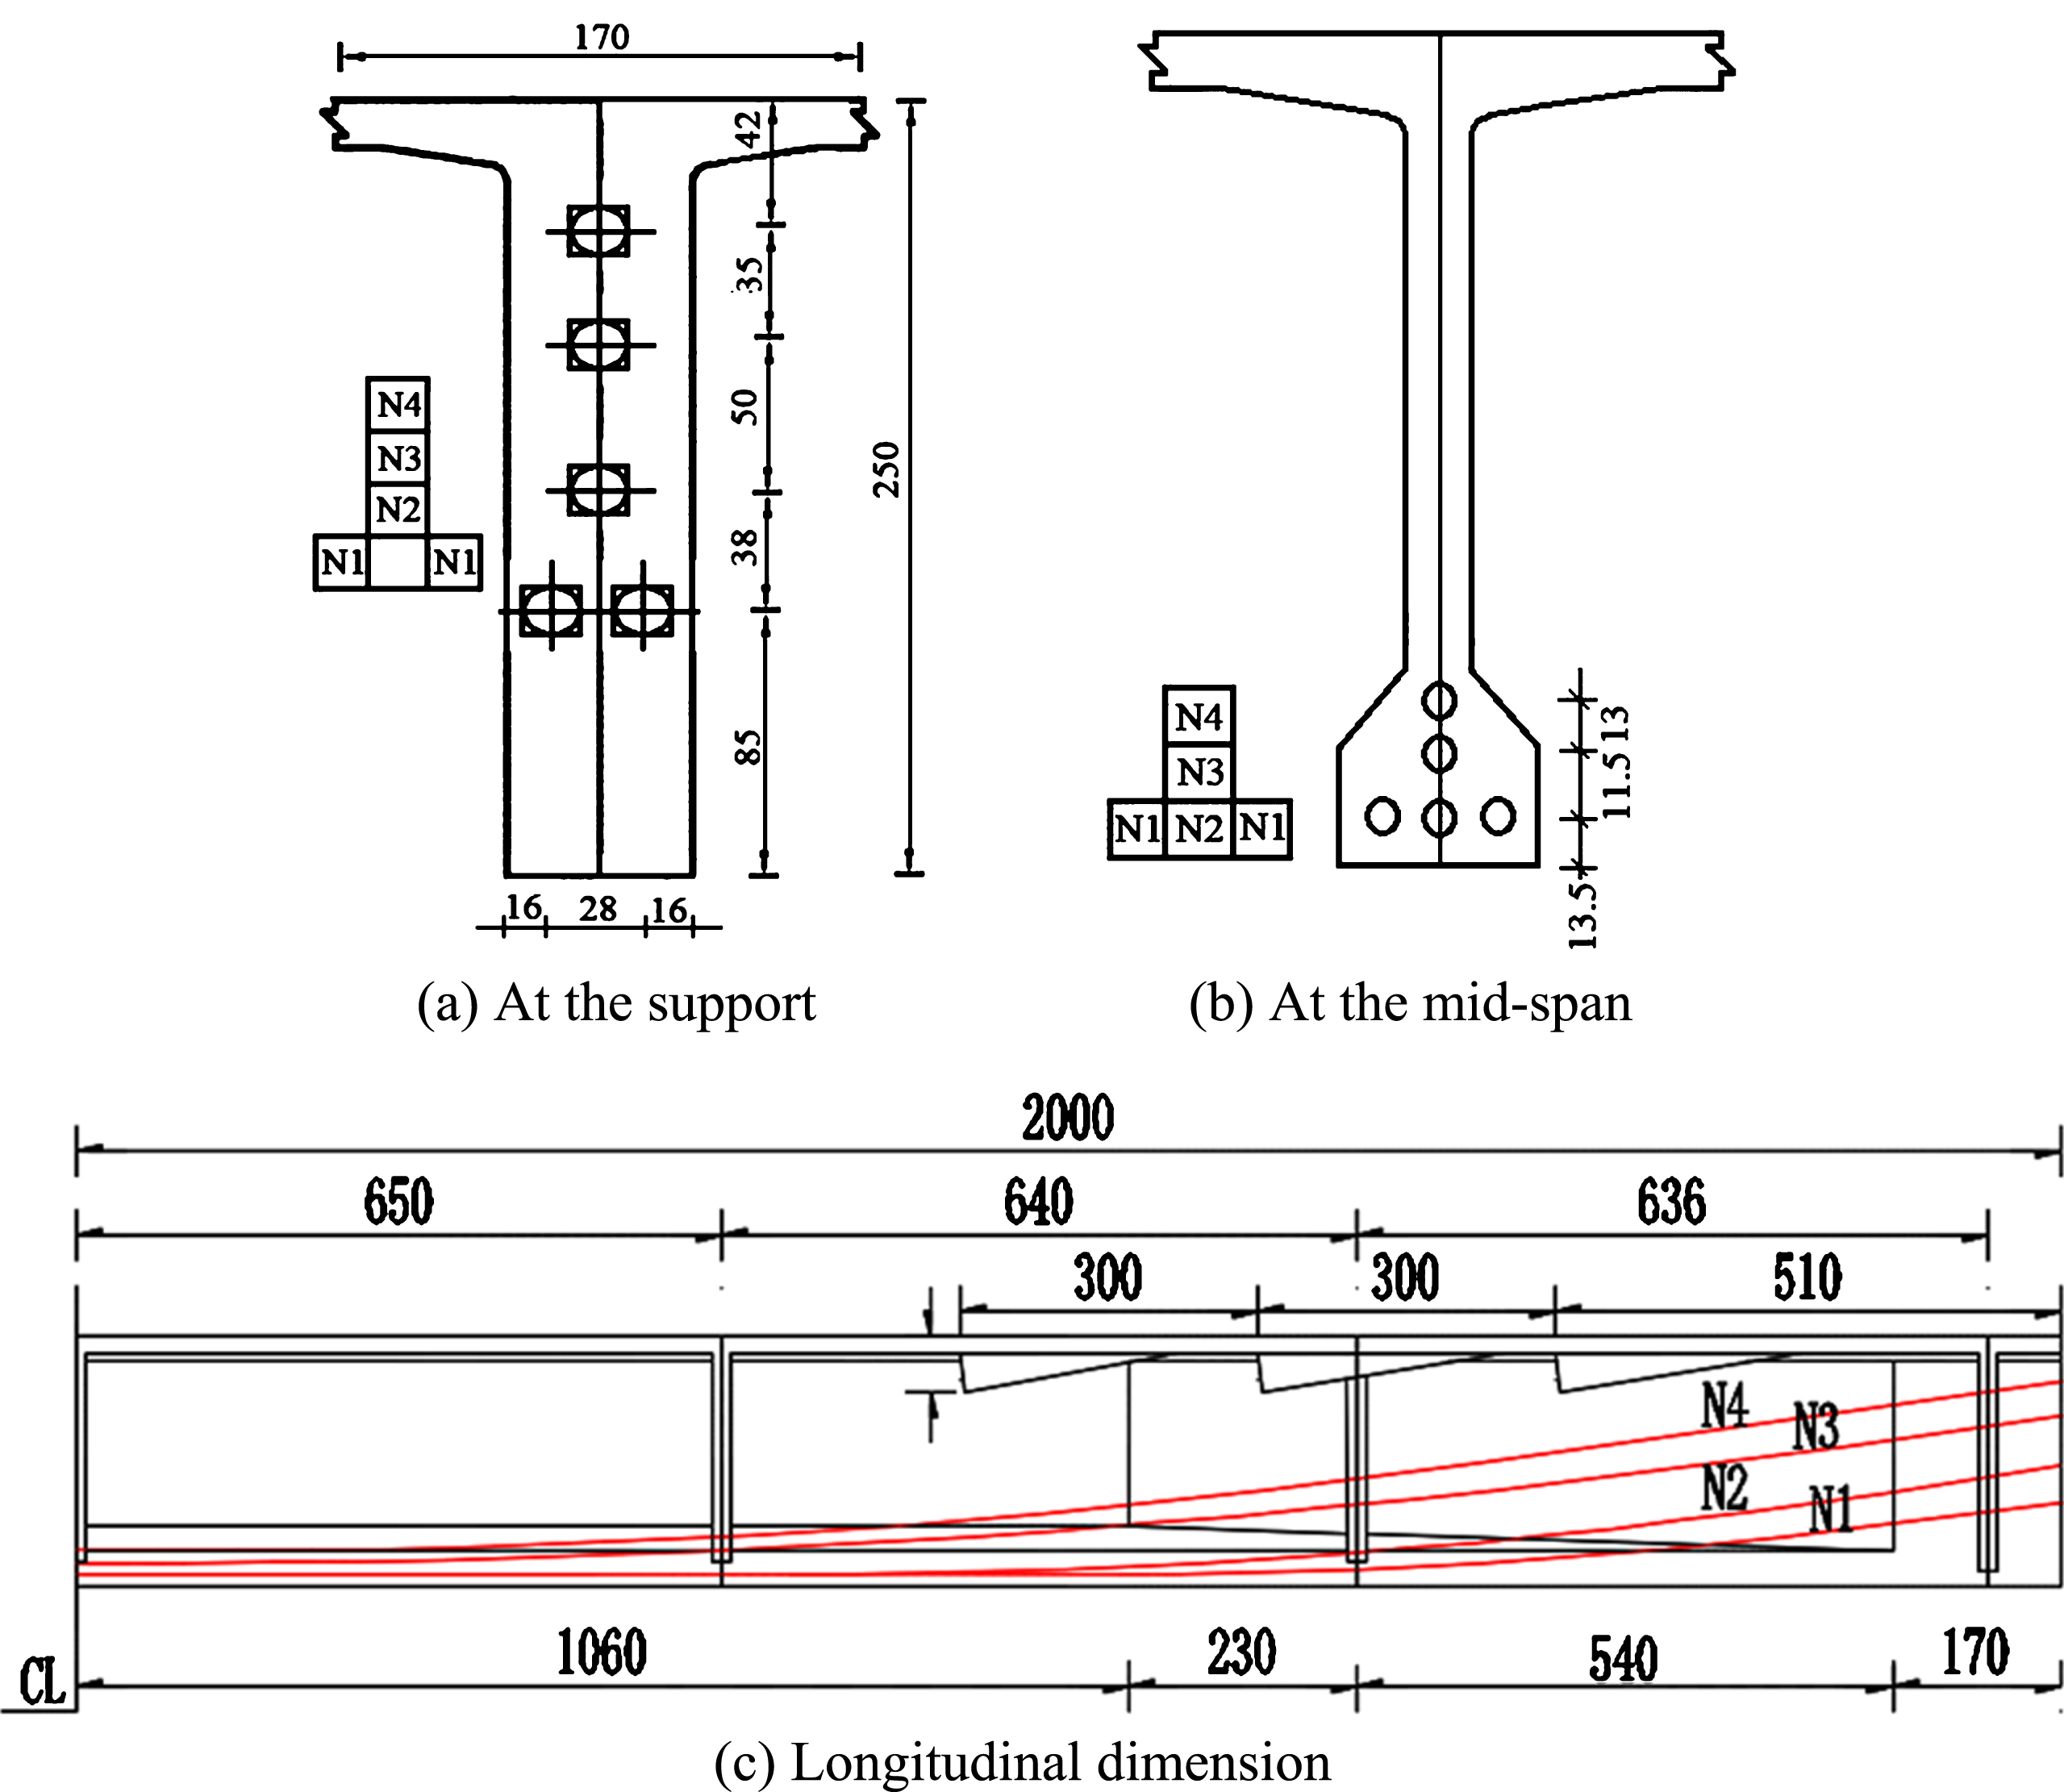
Girder cross section and cable profile.
The strain gage layout on each girder is shown in the instrumentation plan as follows. Three strain gages are attached at a distance of 300 cm from the left supports and are denoted as A1 to A3 as shown in Fig. 6(a). Four strain gages are attached close to the mid-span and denoted as B1 to B4 as shown in Fig. 6(a). Nine strain rosettes are located at a distance of 300 cm from the right supports and are denoted as C1 to C9 as shown in Fig. 6(a). Additionally, 10 strain gages are attached to the steel bars and are denoted as D1 to D10 as shown in Fig. 6(b). At the top flange of the girder, four strain gages are attached at a distance of 3.25 m from the mid-span and are denoted as E1 to E4 as shown in Fig. 6(c). In order to investigate the transfer loads, five strain gages are attached to the intermediate diaphragm and are denoted as F1 to F5 as shown in Fig. 6(d). With respect to temperature reading, four temperature sensors were attached. All the instrumentation was on girder number 4 and in intermediate diaphragms between girders 4 and 3 and between girders 4 and 5.
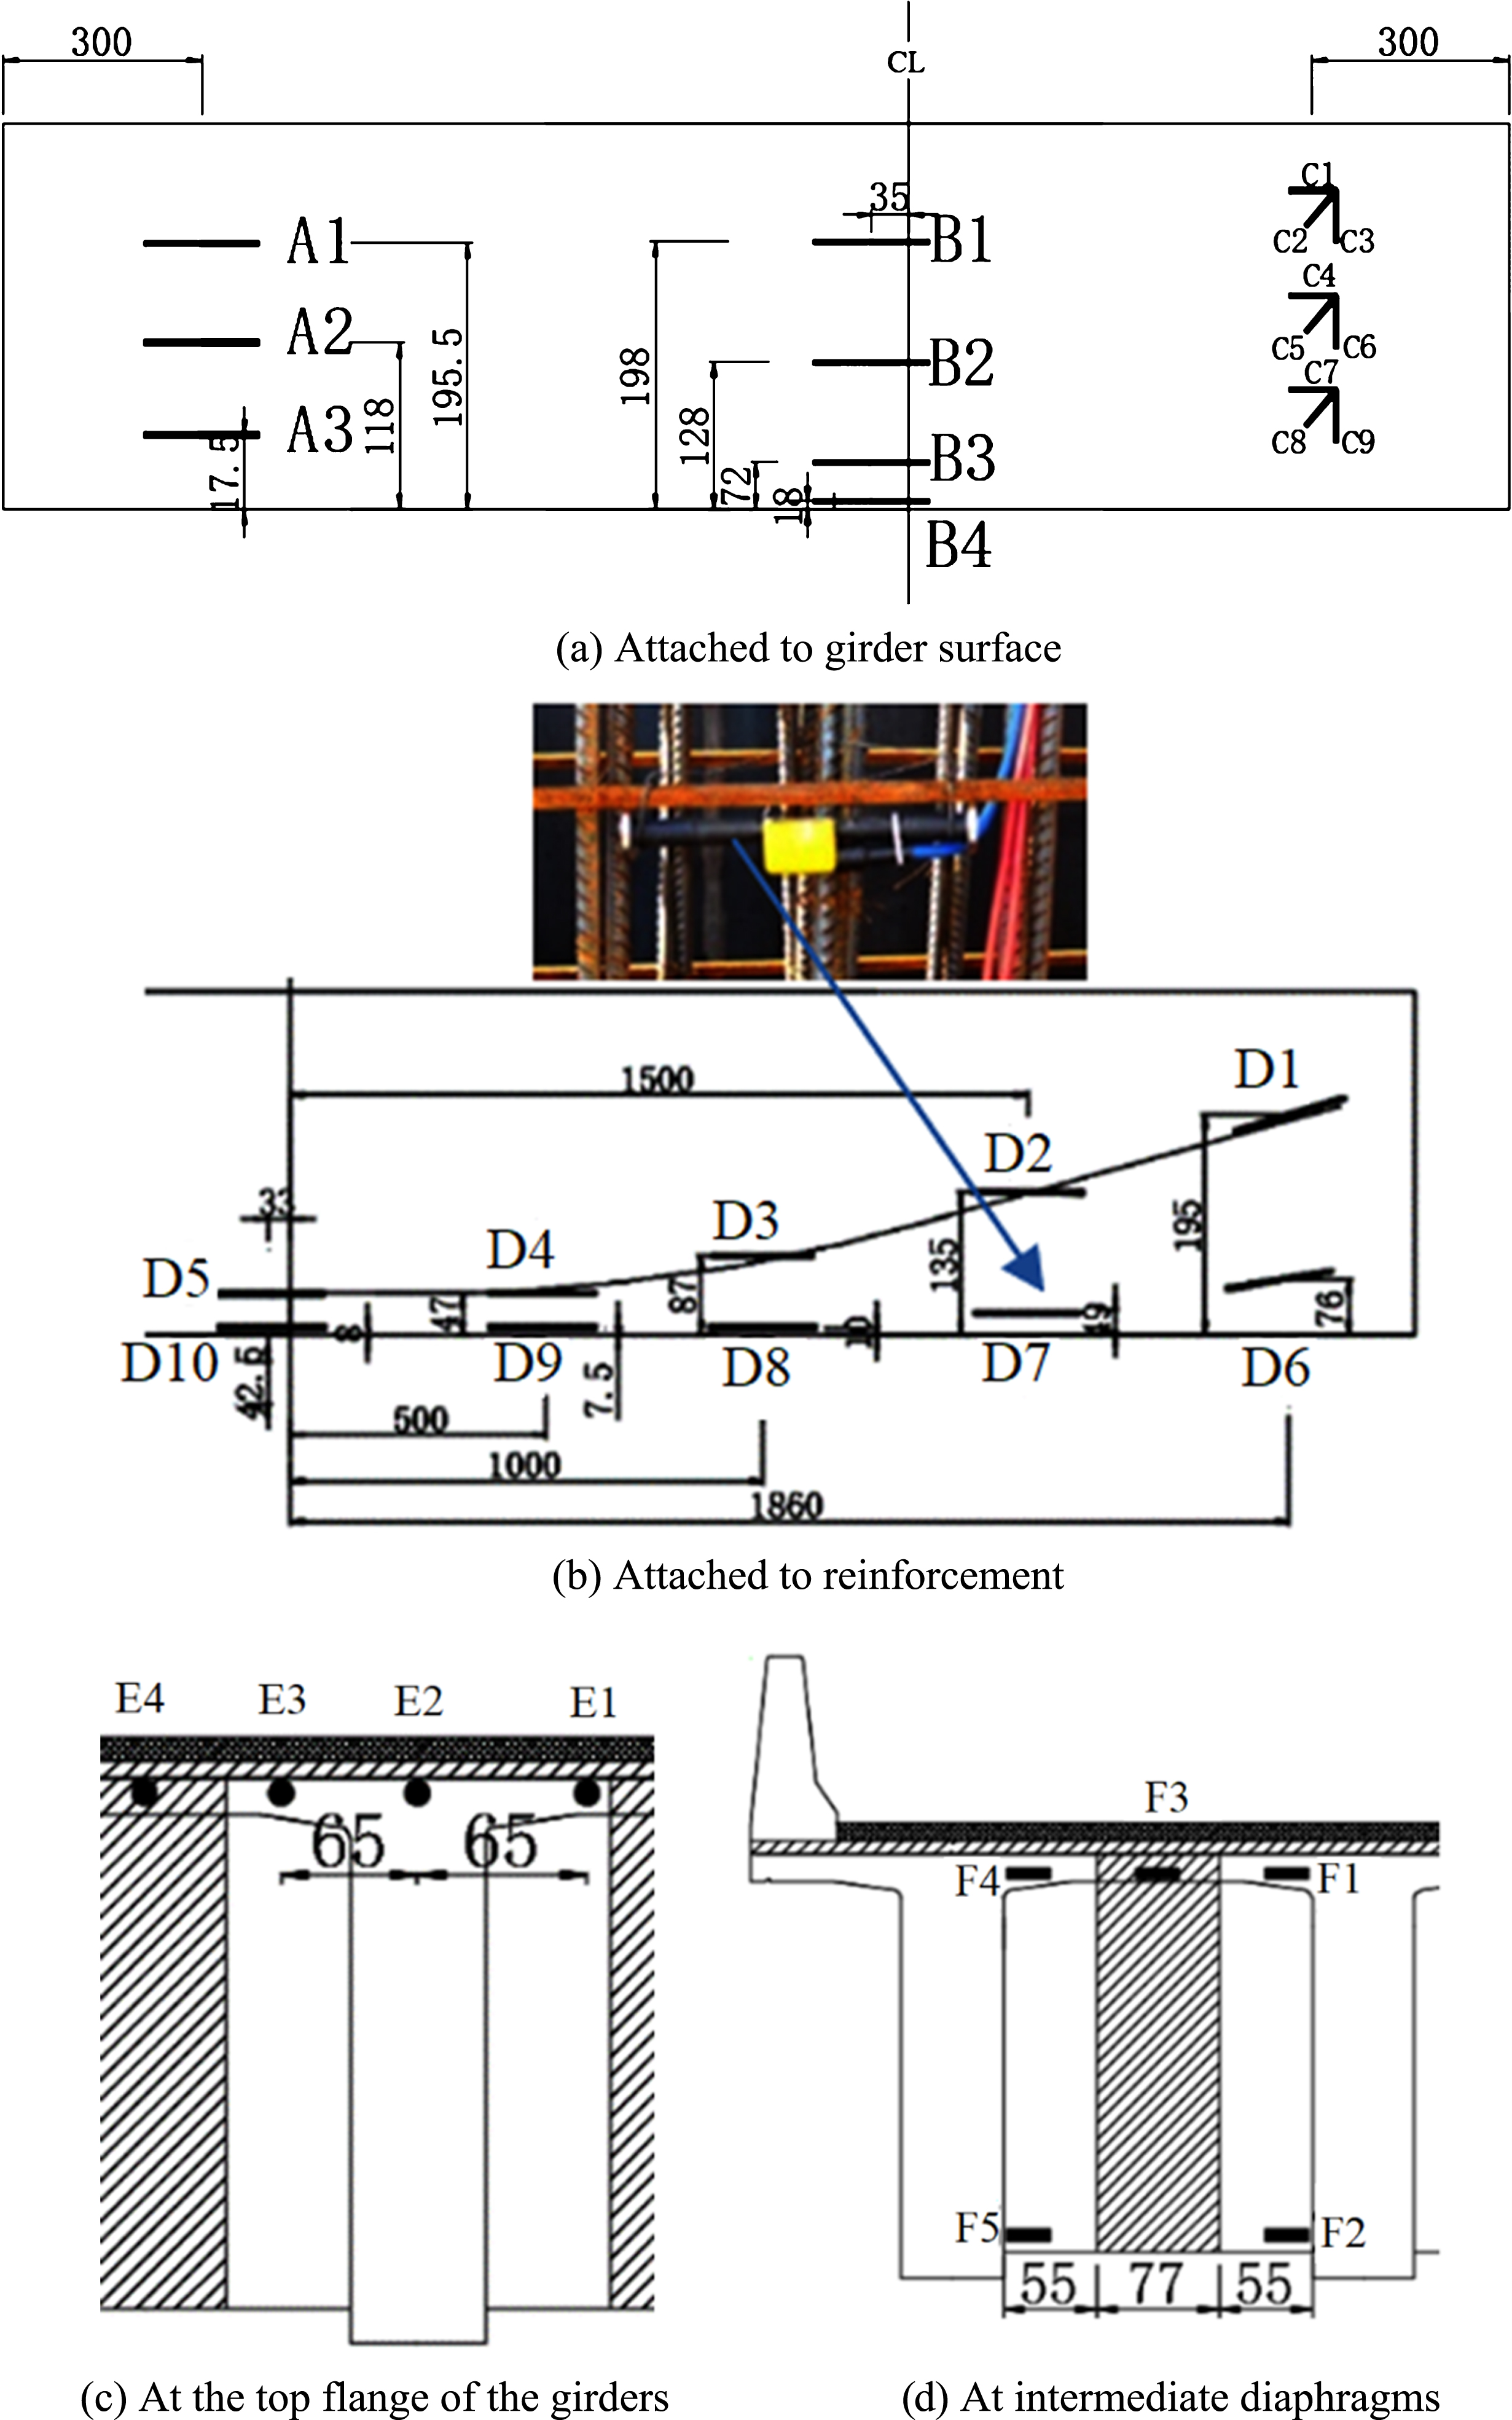
Instrumentation plan and strain gage layout.
Before the bridge is opened, a static load test is conducted to investigate the post-tensioning ability for the continuity and performance of the load redistribution due to a combination of trucks and to provide baseline data for this type of bridge. A three-axle truck is used as a test loading vehicle. The test combined four trucks with various truck axle weights and spacing as shown in Table 1 and Fig. 7, and the front wheels of both trucks exhibit a spacing of 1.8 m.
Weight of the trucks
Weight of the trucks
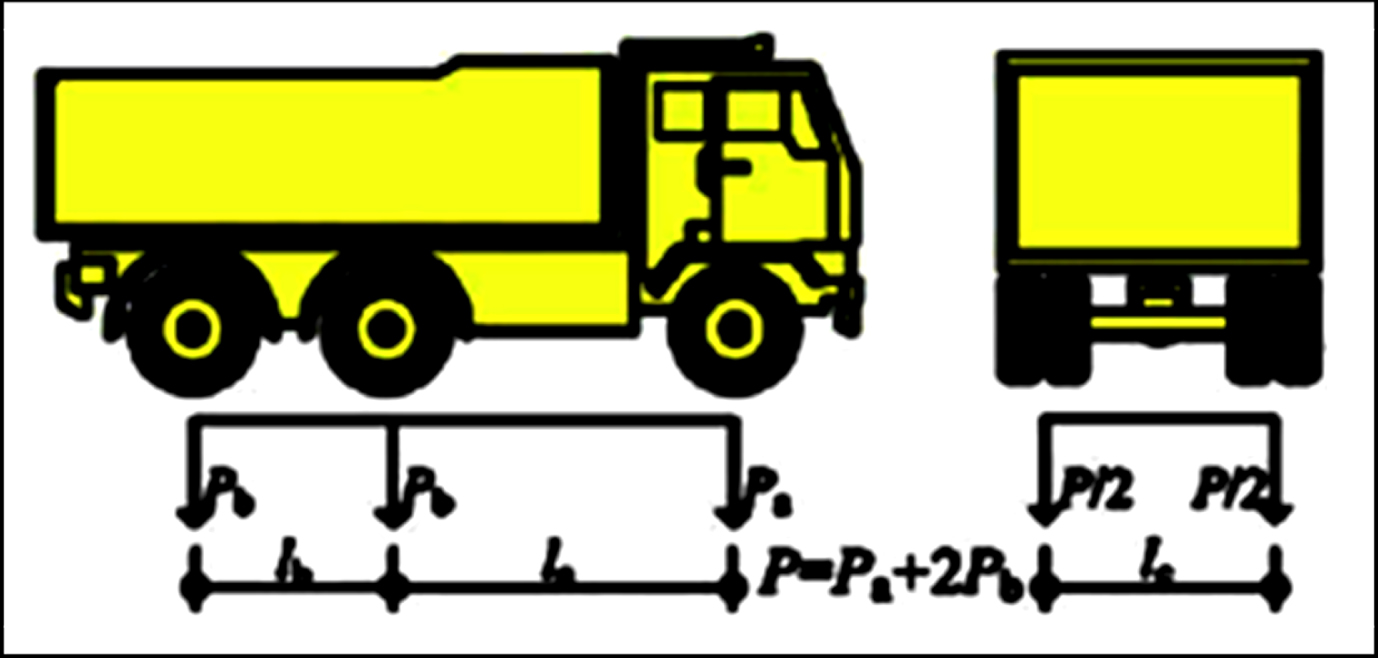
Dimension and weight of the trucks.
A total of six truck positions on span 9 and span 10 is determined to generate the desired stress actions, and the positions are illustrated in Fig. 8.
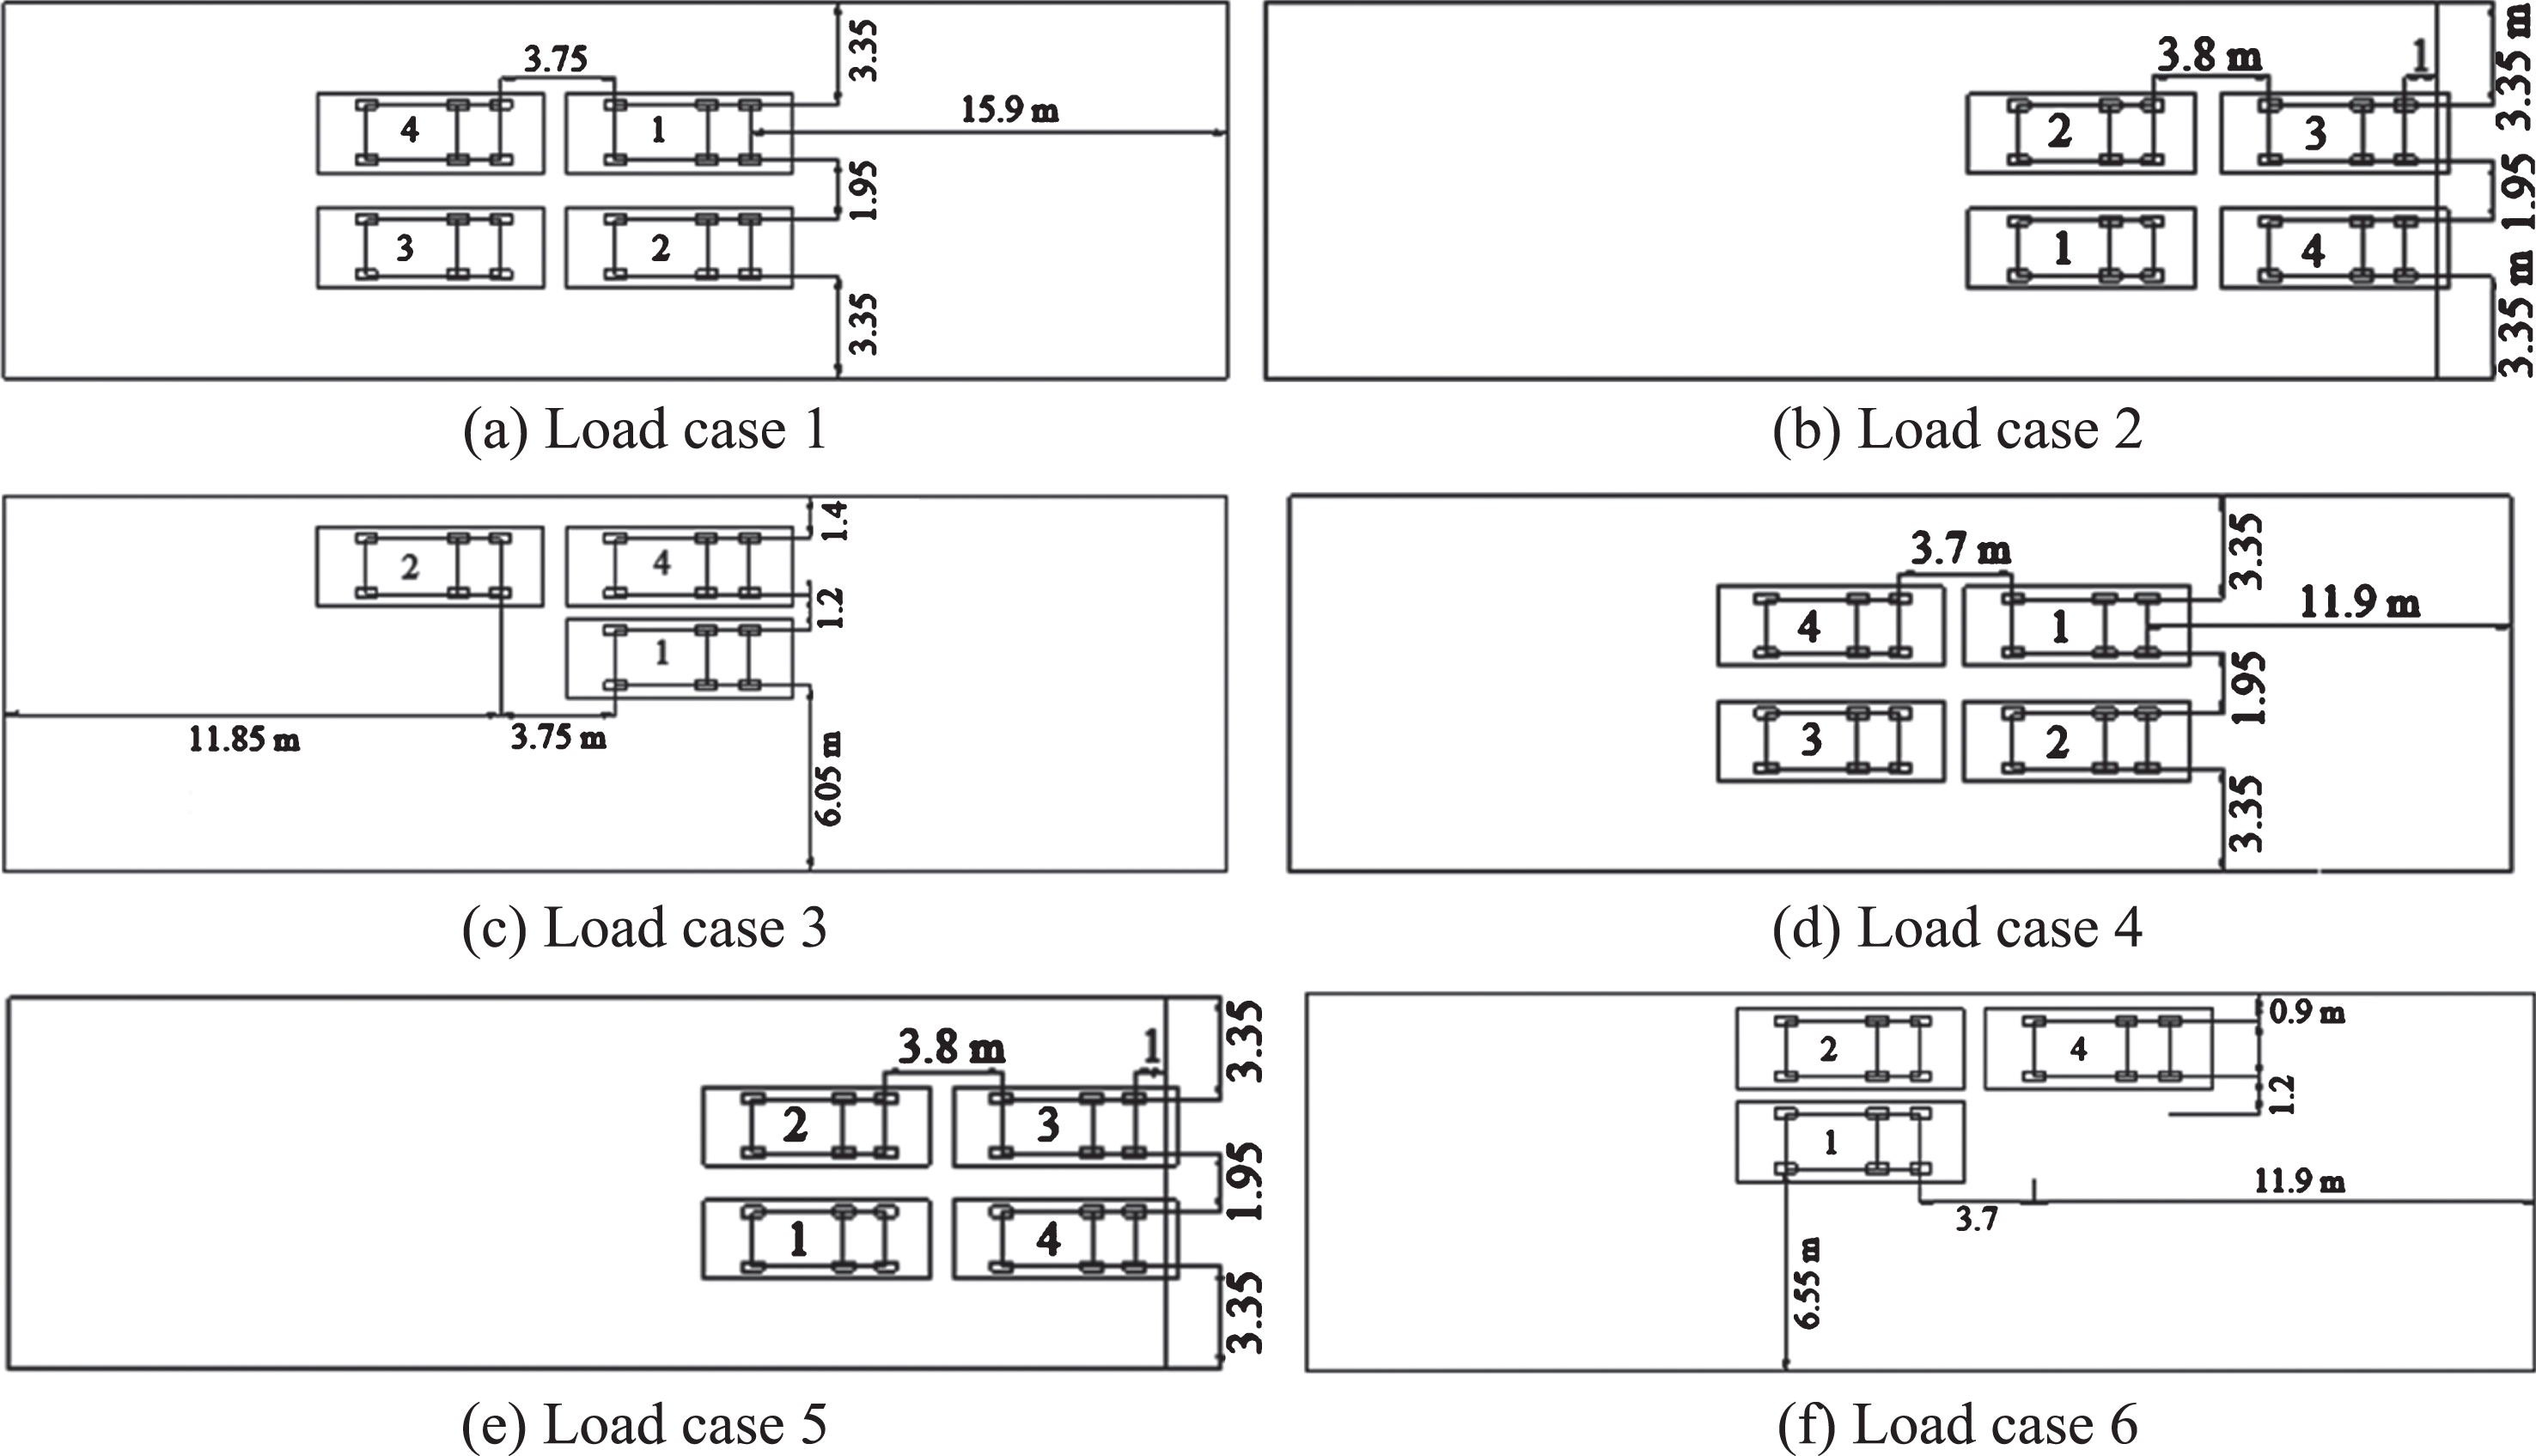
Truck loading Position.
Load cases 1 and 4 feature trucks 1, 2, 3 and 4 that are statically placed in the transverse direction on the girders to generate symmetric positive moments at mid-spans as shown in Fig. 8(a) and 8(d), respectively. Load cases 2 and 5 feature trucks 1, 2, 3 and 4 that are statically placed to generate negative moments near the supports as shown in Fig. 8(b) and 8(e), respectively. Load cases 3 and 6 feature trucks 1, 2, and 4 that are placed in the transverse direction on the bridge to generate asymmetric positive moments at the mid-spans as shown in Fig. 8(c) and 8(f), respectively. The truck load cases are selected to evaluate the ability of post-tensioning for continuity, distribute the force between spans, and appraise the continuity results of full post-tensioning. However, the truck loading is considered as suitable for the study. Figure 9 shows truck loading 1 over the bridge.

Trucks over the bridge.
The trucks are positioned for the distribution loading cases. Figure 9 depicts load case 1. The truck loading started at 2:03 p.m. and continued until 4:29 p.m. During the test, the temperature on the girders increased by 3.96°C based on the temperature sensor reading, and this changed the strain gage readings and affected the bridge response. This indicates that the stress calculated from the strain gages corresponded to the stress due to the live load and thermal effect. The effect was corrected. However, the thermal effect on the bridge should be considered to obtain the net stress on the bridge attributable to the truck loading. Figure 10 shows the stress on span 8. Stresses on the left side of the girder are shown in Fig. 10(a). Stress on sensor A1 corresponds to tension for all load cases, and load cases wherein the truck is close to the support yield high values as other load cases. The stress on A2 corresponds to tension for loading 6 and compression for other loadings. Stress close to mid-span are shown in Fig. 10(b). As shown in the figure, the stress on B2 corresponds to compression for load case 1 and tension for all other load cases. Load case 6 yields the maximum tension for all readings. Additionally, in the area near the bottom of the girder, the stress from load cases in which trucks are located on span 9 produce compression stress. This implies that a camber occurs on span 8 and 10 when a truck is located on span 9. The results of shear stress are depicted in X, Y, and XY directions in Fig. 10(c). With respect to all load cases, the shear stress values on X correspond to tension and those on Y correspond to compression. Additionally, in the X-direction, the stress for load cases in which the trucks are on span 9 are as high as the load cases in which the tracks are on span 10. However, the load cases in which the trucks are on span 10 yield higher values of stress in the Y direction.

Stress results on span 8 for truck positions 1–6.
Figure 11 shows the stress on span 9. The stress on left side of the girder results in the production of tension stress for all load cases on sensor A1 in which the observed values correspond to the maximum in the case of the truck positioned on span 9. Furthermore, at strain sensor A3, load cases 1, 2, and 3 result in compression stress (Fig. 11(a)). Load cases 1, 2, and 3 result in deflection on span 9 close to the mid-span while load cases 4, 5, and 6 produce tension stress on sensor B1. The stress values produced in other locations were lower when compared with the stress on span 8 (Fig. 11(b)). The results of shear stress are depicted in the X, Y, and XY directions in Fig. 11(c). The X-direction shows the tension stress while the Y-direction shows the compression stress for all the load cases. The stress values are due to the sensor located at the zone of continuity cable.
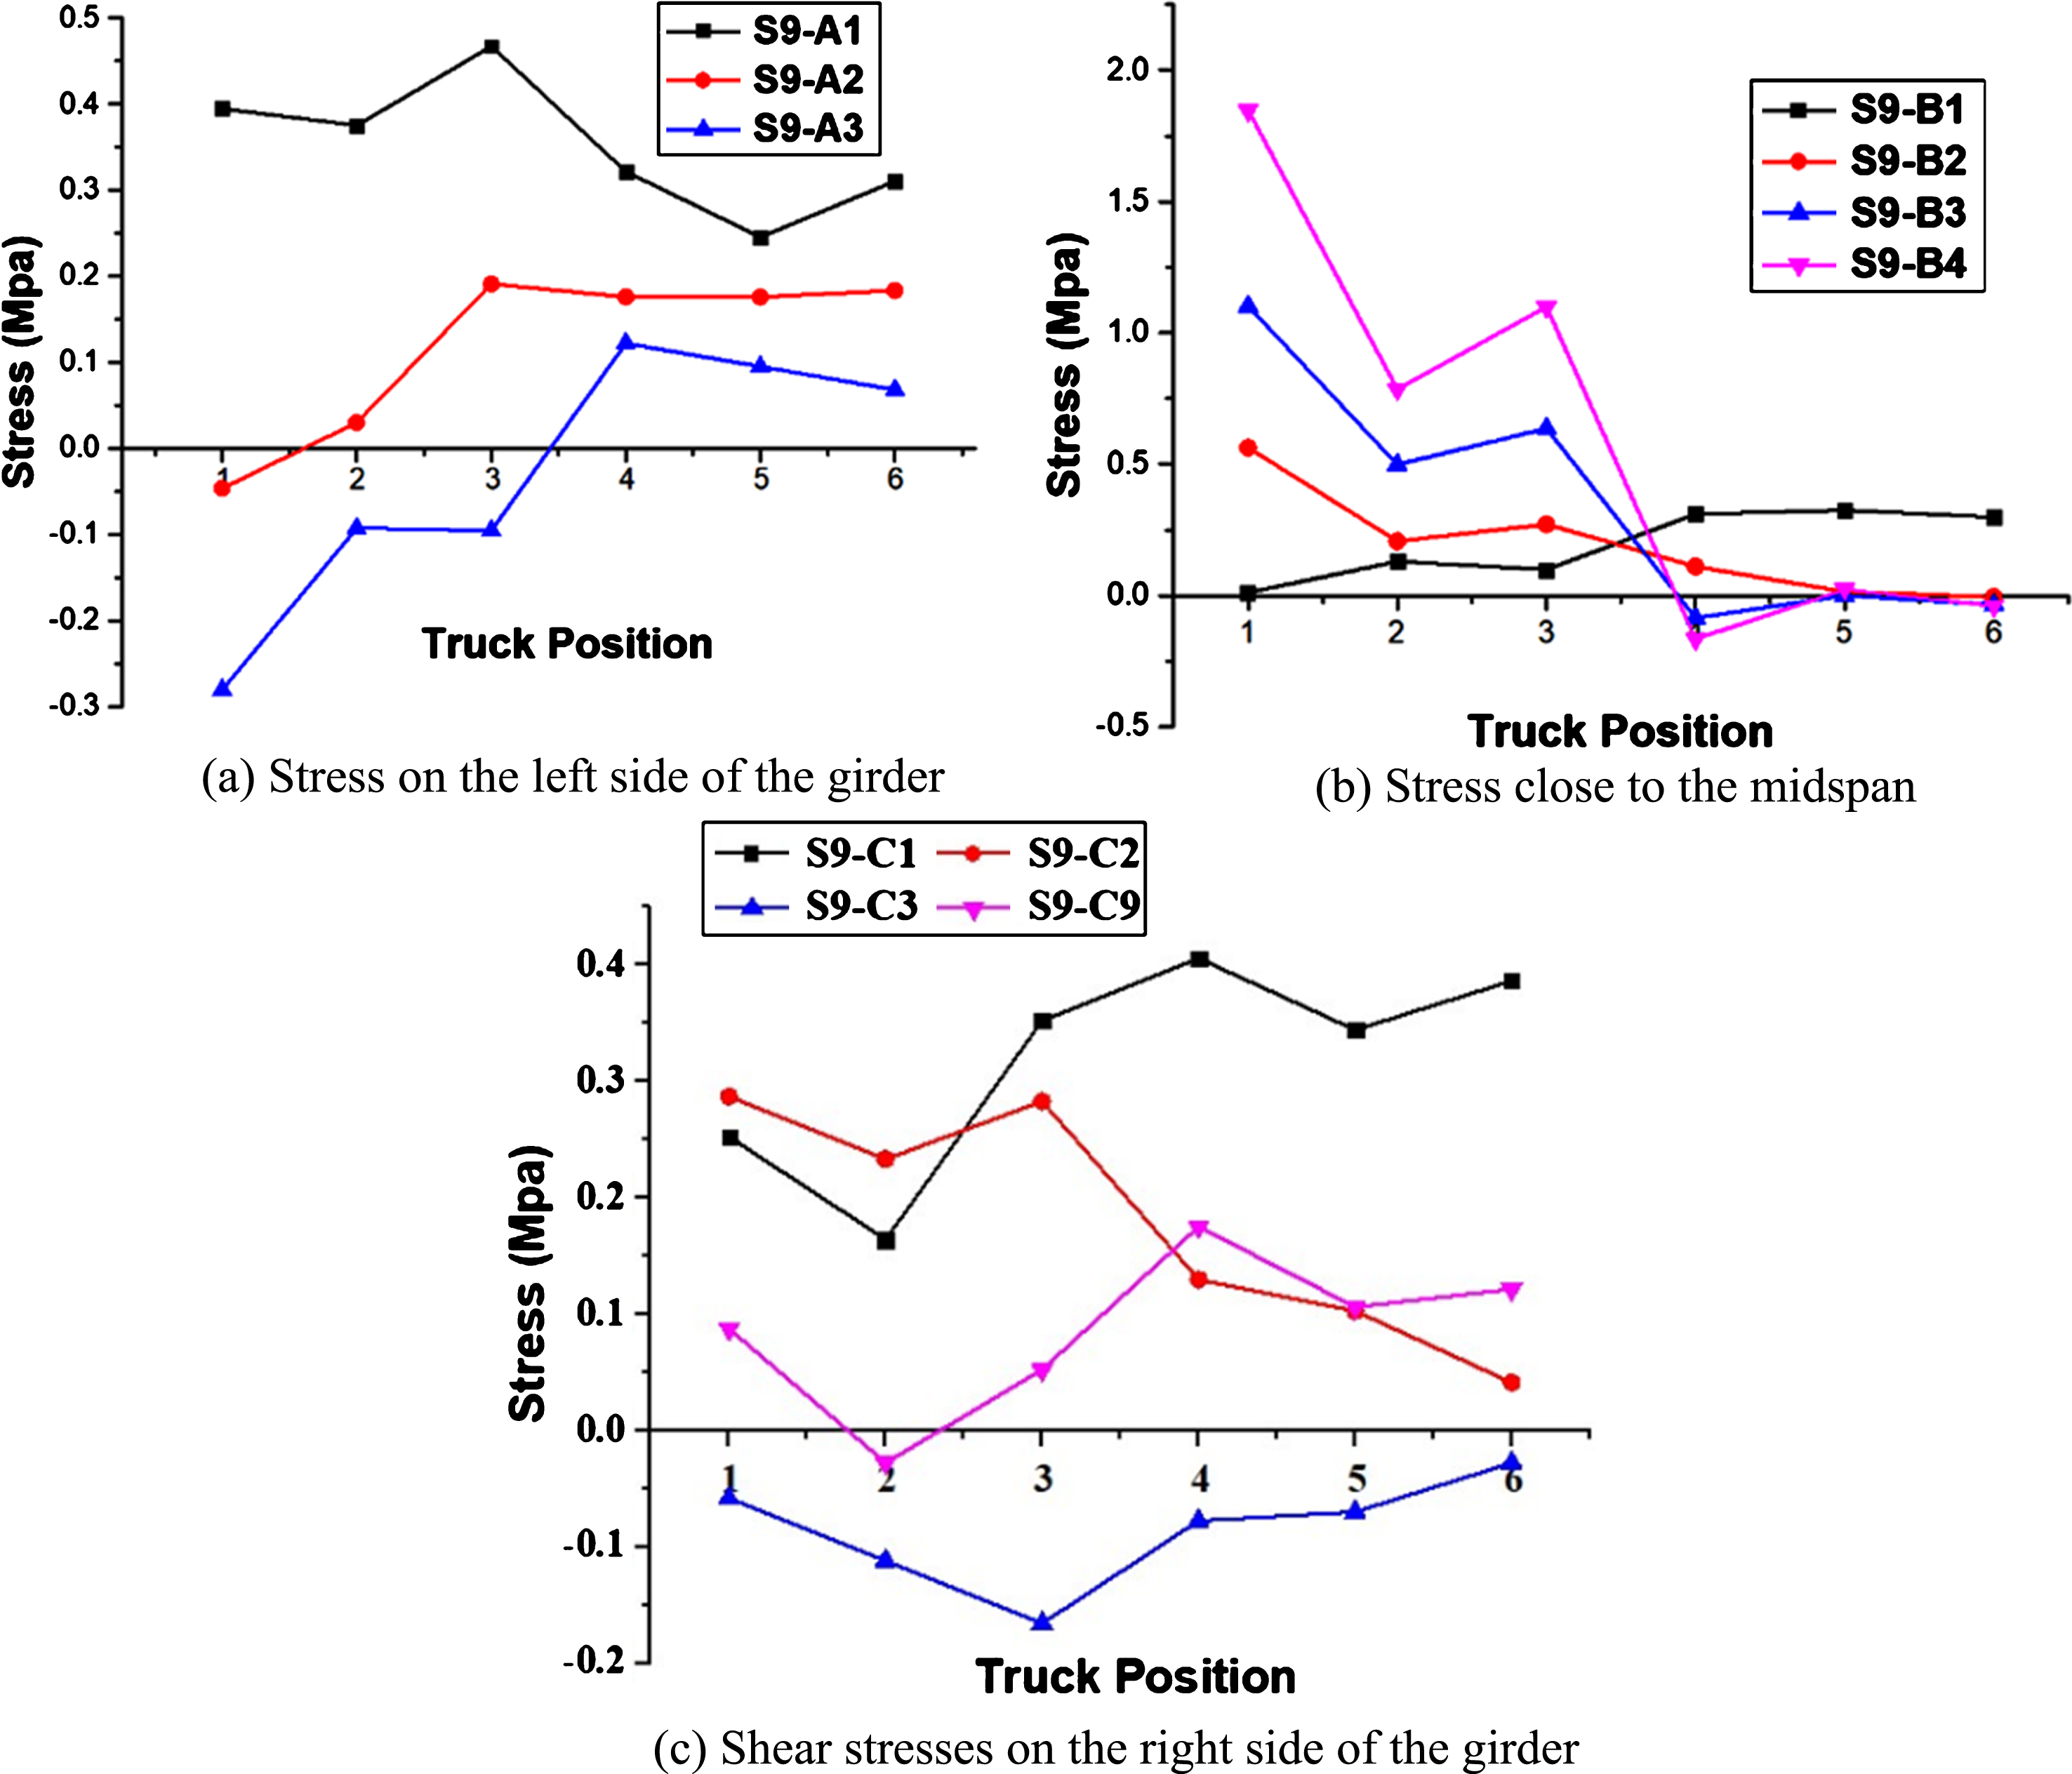
Stress results on span 9 for truck positions 1–6.
Figure 12 shows the stress on span 10. Stresses on the left side of the girder are shown in Fig. 12(a). On sensor A2, load case 1 results in a compression stress and other load cases result in tension stress, and strain sensor A1 results in tension stress for all load cases. Load cases 4, 5, and 6 result in deflection close to the mid-span while load cases 1, 2, and 3 result in compression stress close to the bottom flange (Fig. 12(b)). The results of shear stress are depicted in the X, Y, and XY directions in Fig. 12(c). The stress on X-direction corresponds to tension in C1. The stress in C7 corresponds to compression when the truck is on span 9 and corresponds to tension when the truck on span 10. The shear stress in C3 corresponds to tension and that in C8 corresponds to tension when the trucks are on span 10. For cases in which the trucks are on span 9, the shear stress in C8 corresponds to compression and exceeds the X-compression stress.

Stress results on span 10 for truck positions 1–6.
A 3D finite element (FE) model of the Baobei bridge is developed by using ANSYS software. The exact truck locations used in the bridge are identified, and finite-element analyses allow loading of the bridge model with different truck combinations. The cross-sectional dimensional of each component varies due to the girder shape. All structural concrete members of the bridge are modeled by using SOLID65 element. The element exhibits eight-nodes with three translation degrees of freedom at each node. The 3D spar element LINK180 is used to model prestressing strands, and the element exhibits two-nodes with three translation degrees of freedom at each node. The anchorage and bearing pads are modeled by using SOLID185 elements. The degree of freedom of prestressing strands is translationally coupled for all with anchorage and for vertical translation with the girders. The prestressing force is simulated by applying a temperature force. The temperature force is calculated from the initial prestressing force, Young’s modulus, and thermal expansion coefficient. Linear and multilinear material properties are assumed as the actual material properties obtained on the field. Young’s modulus is considered as 195000 MPa for prestressing strands and 34500 MPa for concrete. The model is used to analyze the effects of live load cases, and thus the construction sequence is not considered. Figure 13 shows the FE model of the bridge. The final model comprises of 182156 elements.

Bridge model.
In order to verify the accuracy of the FE model of the bridge, the measured and corrected net stress values from the live load test are compared to the corresponding calculated stress of the model. Nodes are created on the FE model in the same locations as the strain gages on the actual bridge. This facilitates a direct comparison with the measured results. The stress on the girders with respect to load cases 3 and 6 are used to validate the model.
Figure 14 shows a comparison between the measured live load and calculated FEM data of girder 4 for load case 3 on span 9 and load case 6 on span 10. The FEM result is obtained as discretely close to the mid-span when the position of the truck is identical to that in the field test. As shown in the figure, with the exception of strain gage B2 on span 10, the data indicates a strong correlation between the FE model and live-load result.
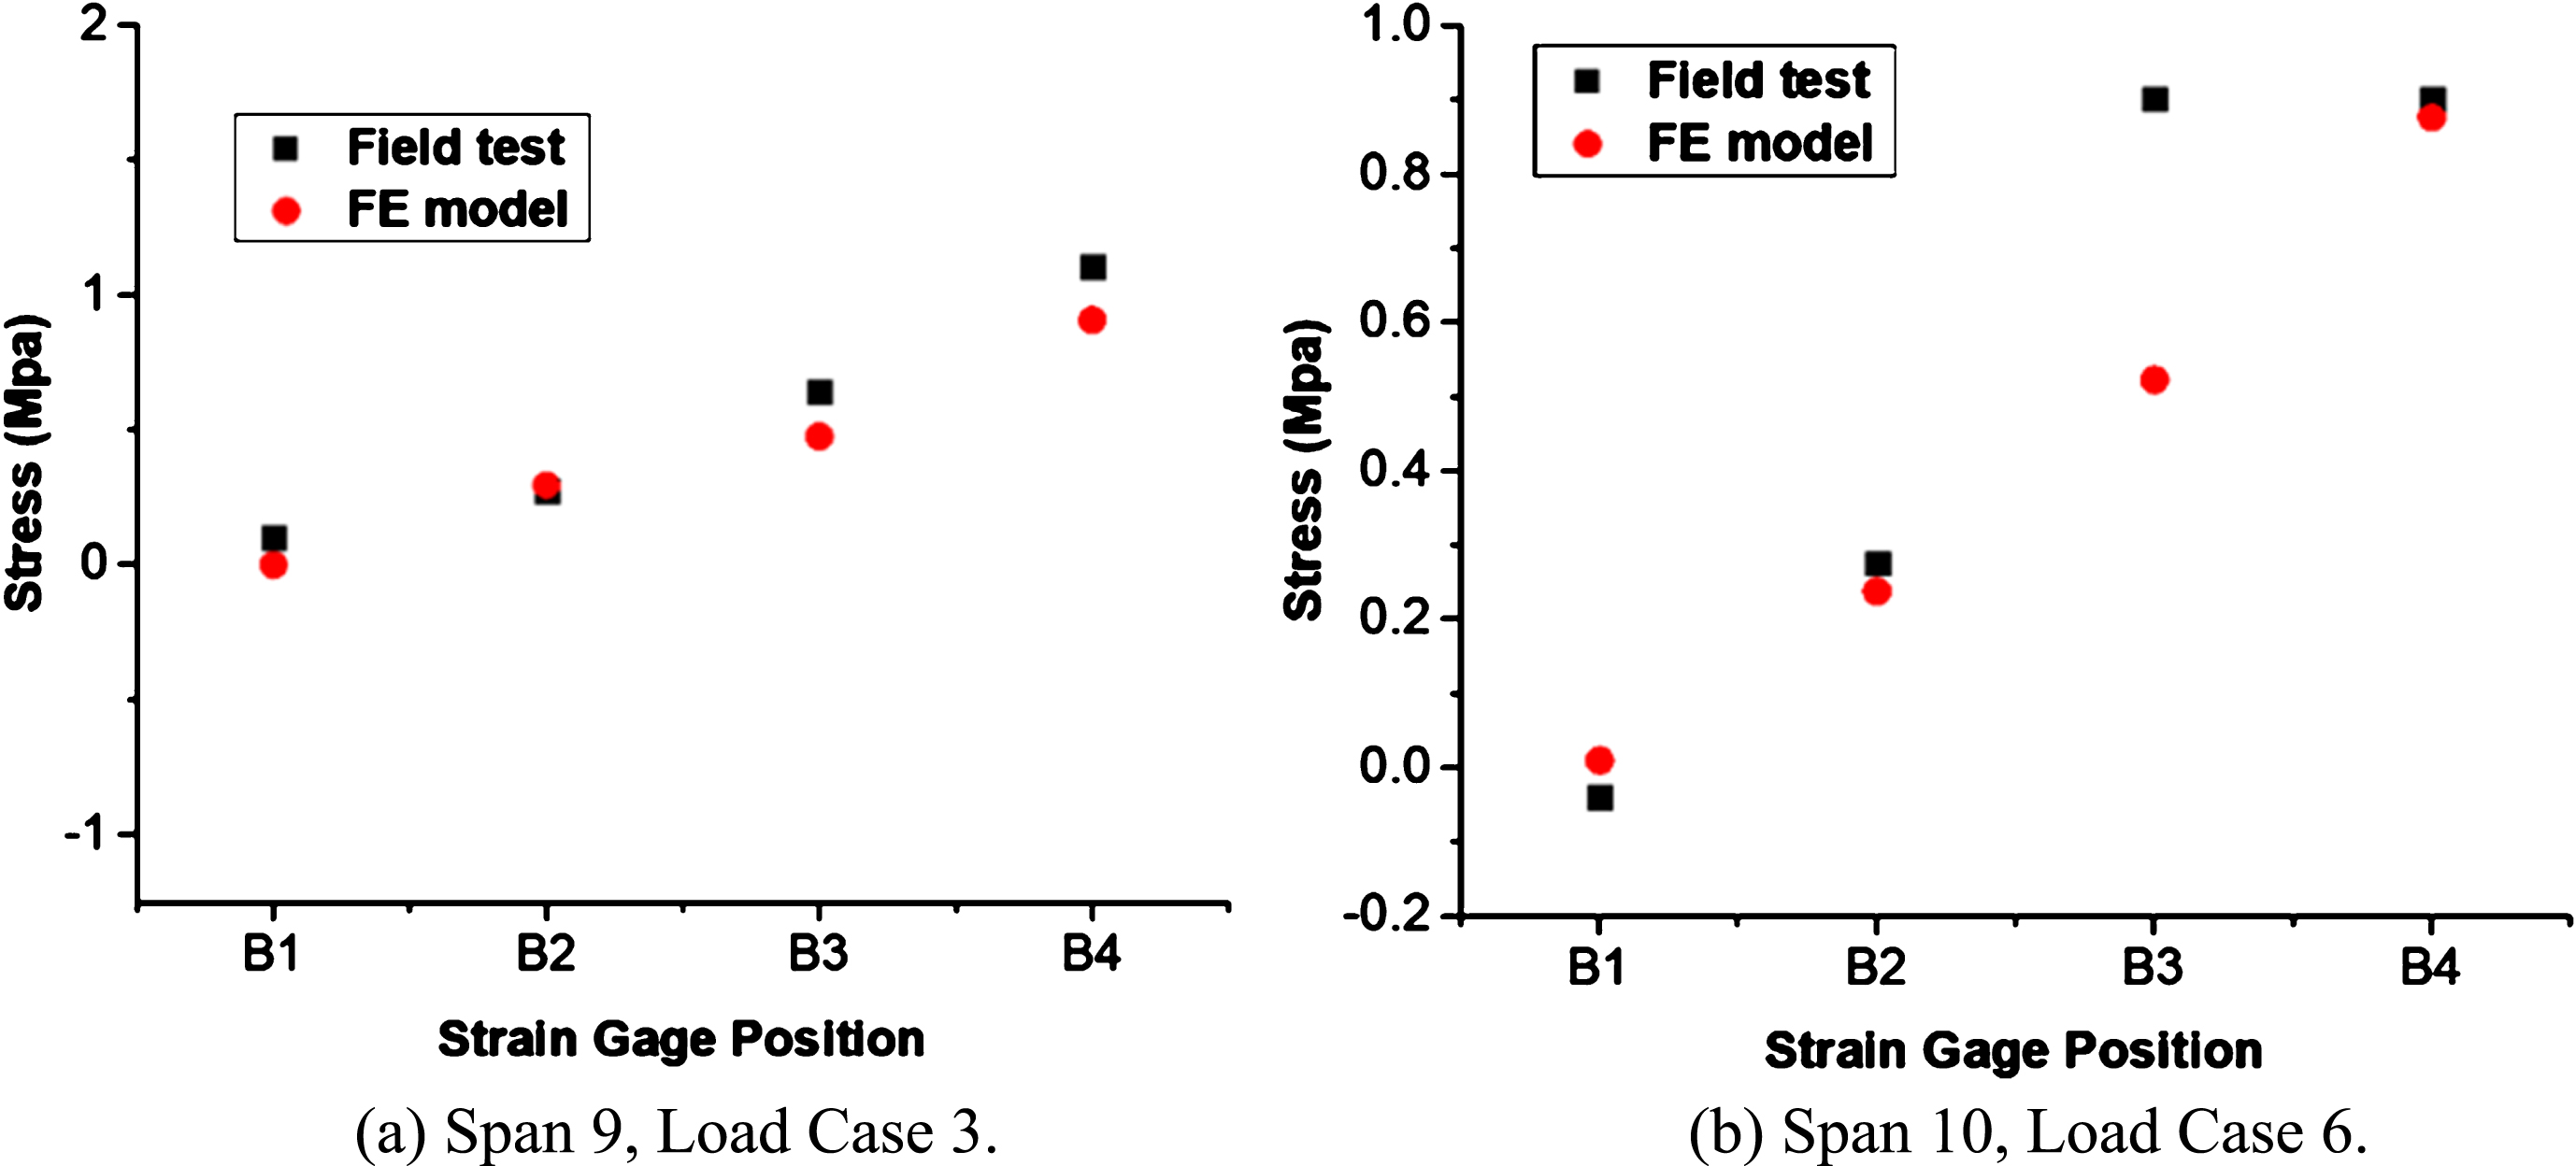
Comparison of stress between the live load and FEM results.
Figure 15 shows the results of the transfer of stress between adjacent girders for truck loadings 1 to 6. Figure 15(a) shows the results for span 8. Truck loadings 1, 2, and, 3 produce compression stress in the girder’s bottom flange. With respect to loading 1, girder 1 was slightly more highly loaded. With respect to loadings 2 and 3, the stress transfer is almost equal. Truck loadings 4, 5 and, 6 produce tension stress on the bottom flange of the girder, and the stress transfer is almost equal. Figure 15(b) shows the results for span 9 by considering the symmetric positive stress results of span 9 with loading 1. This results in relatively higher and relatively lower stress on girder 4 and girder 2, respectively. With respect to asymmetric positive stress, girder 4 is more highly stressed and the exterior girder 1 carries relatively less stress. With respect to loading 2 in which the truck is placed near the support, the stress transferred to the girder’s mid-span is almost equal. Truck loadings 4, 5 and, 6 produce compression stress on the bottom flange of the girder, and the stress transfer is almost equal. Figure 15(c) shows the results for span 10 by considering the tension stress results of span 10, loading 4. Girder 5 is slightly heavily loaded, and it can be observed that girders 2 and 4 of the bridge are slightly less loaded. Loading 5 results in a pattern similar to that of truck loading 4. With respect to loading 6, the leftmost girder (girder 1) is less loaded, and rightmost girder (girder 5) is most heavily loaded.
However, the negative stress results in span 10 show similar pattern and magnitude to those of span 9.

Transfer of stress between adjacent girders.
The objective of the study is to if post-tensioning can result in continuity to reduce the moments due to a truck load. In this part, the stress along the length of the bridge girders are evaluated under truck loads 3 and 6. Forces are caused by the truck loading transfer from the span to the adjacent span along the girders line. Figure 16 shows the results of stress transfer between the spans. As shown in Fig. 16(a), the truck is positioned on span 9, and maximum stress is at girder line 2. At girder lines 1 and 3, the stress corresponds to compression. As shown in Fig. 16(b), the truck is positioned on span 10, maximum stress is at girder line 3, and girder line 1 is subject to tension stress in this case.
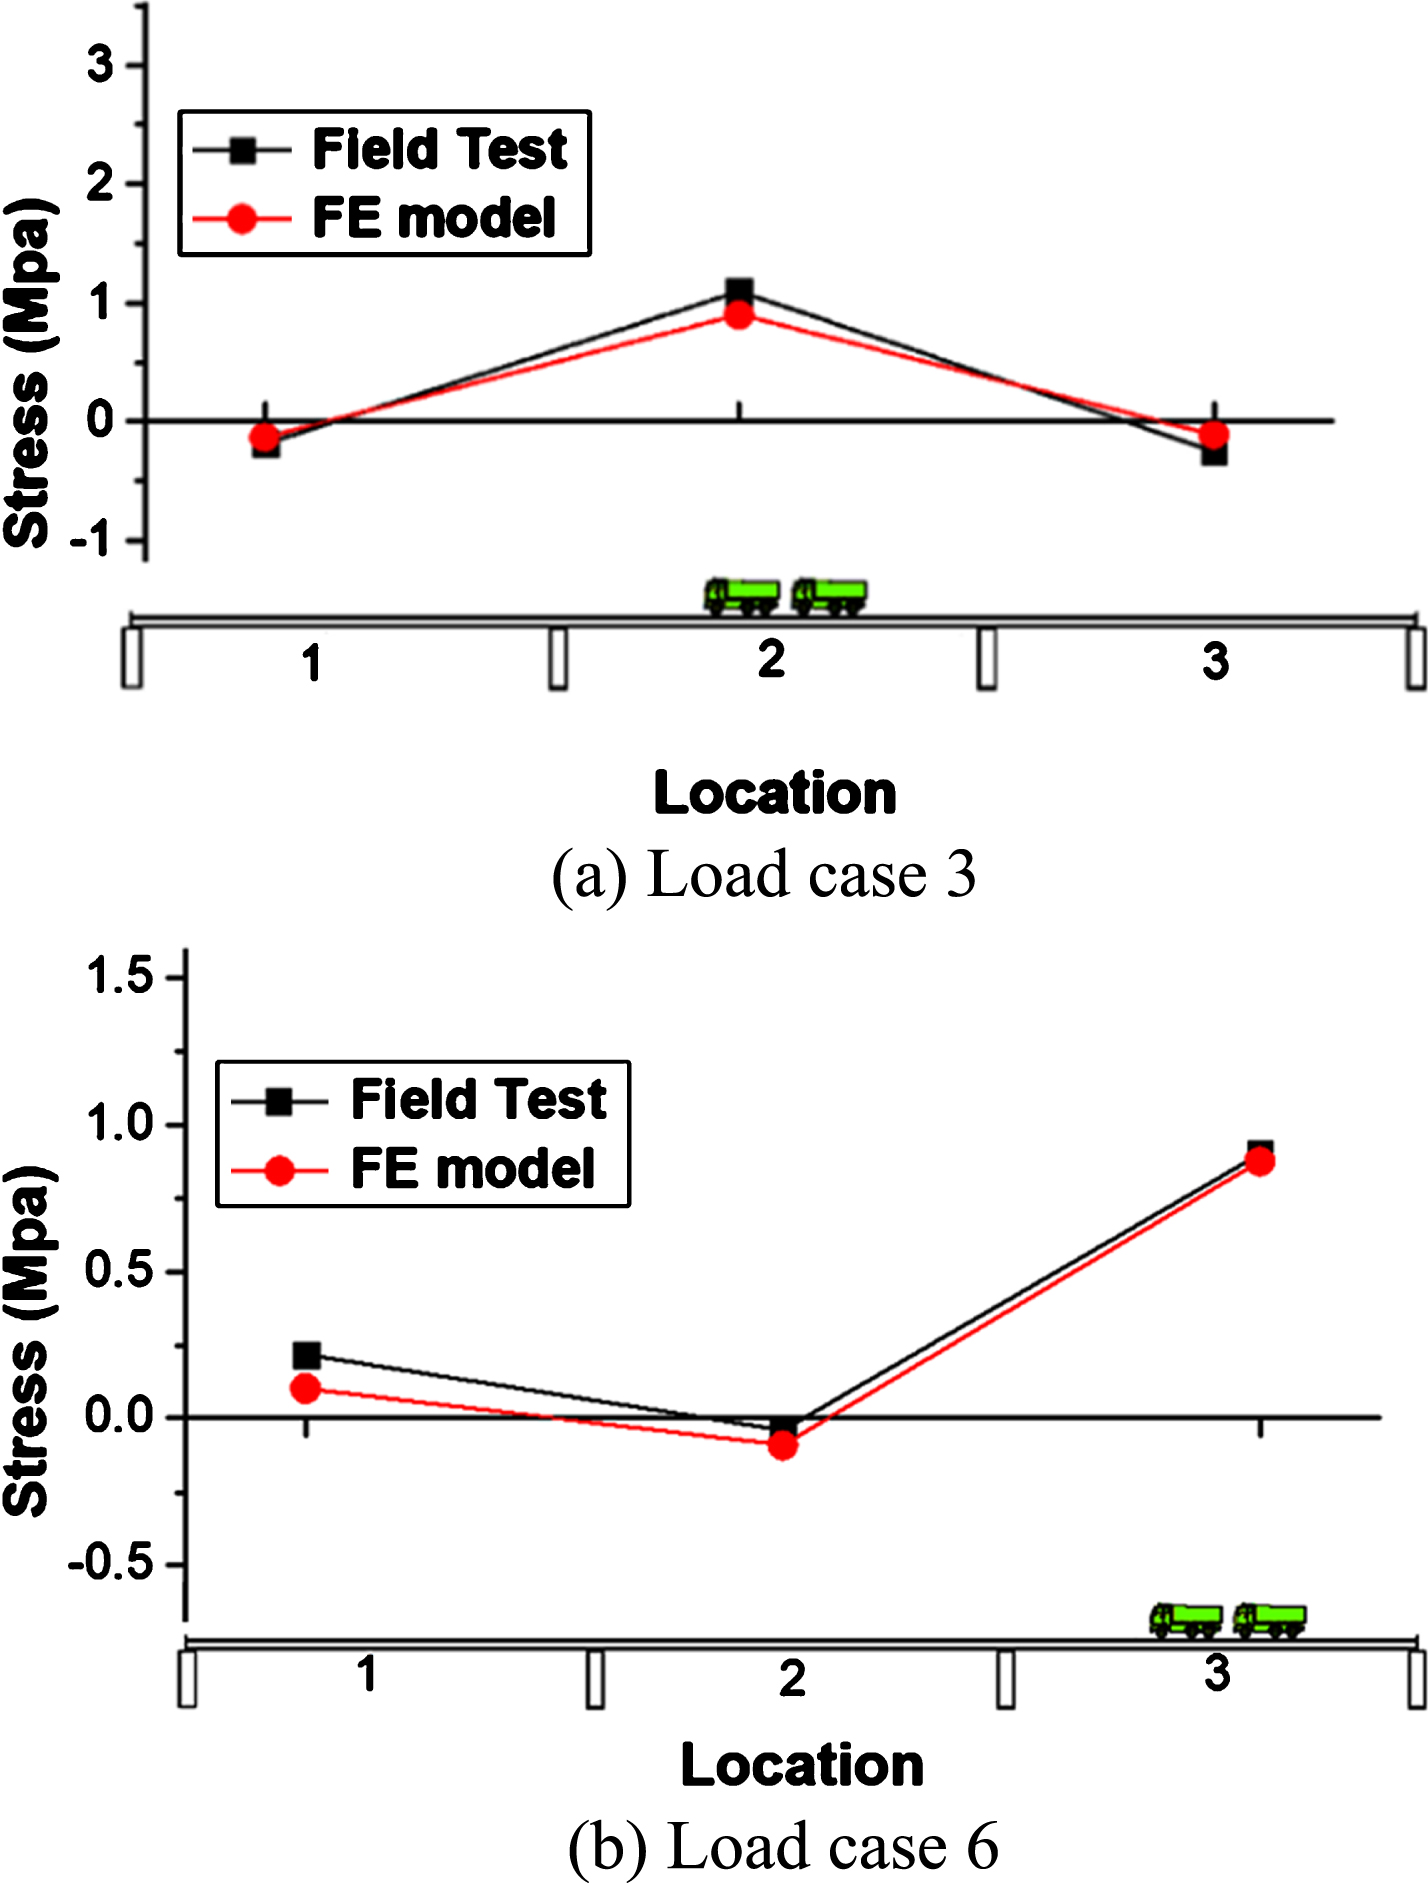
Distribution of stresses along spans.
Effect of post-tensioning for continuity
In order to quantify the effect of post-tensioning for continuity on the magnitude of the girders stress, a parametric study is conducted. The calculation of stress in the parameter study is influenced by post-tensioning the connection region.
The effect of post-tensioning for continuity is evaluated by calculating the stress for post-tensioning for the continuity model and non-tensioning for the continuity model. Figure 17 shows the result of truck loading. The connection region was not tensioned in model 1. The connection region was post-tensioned for continuity in model 2. The results indicate that post-tensioning for continuity decreases the positive moments in the girders and leads to an increase in the stress transferred between adjacent spans.
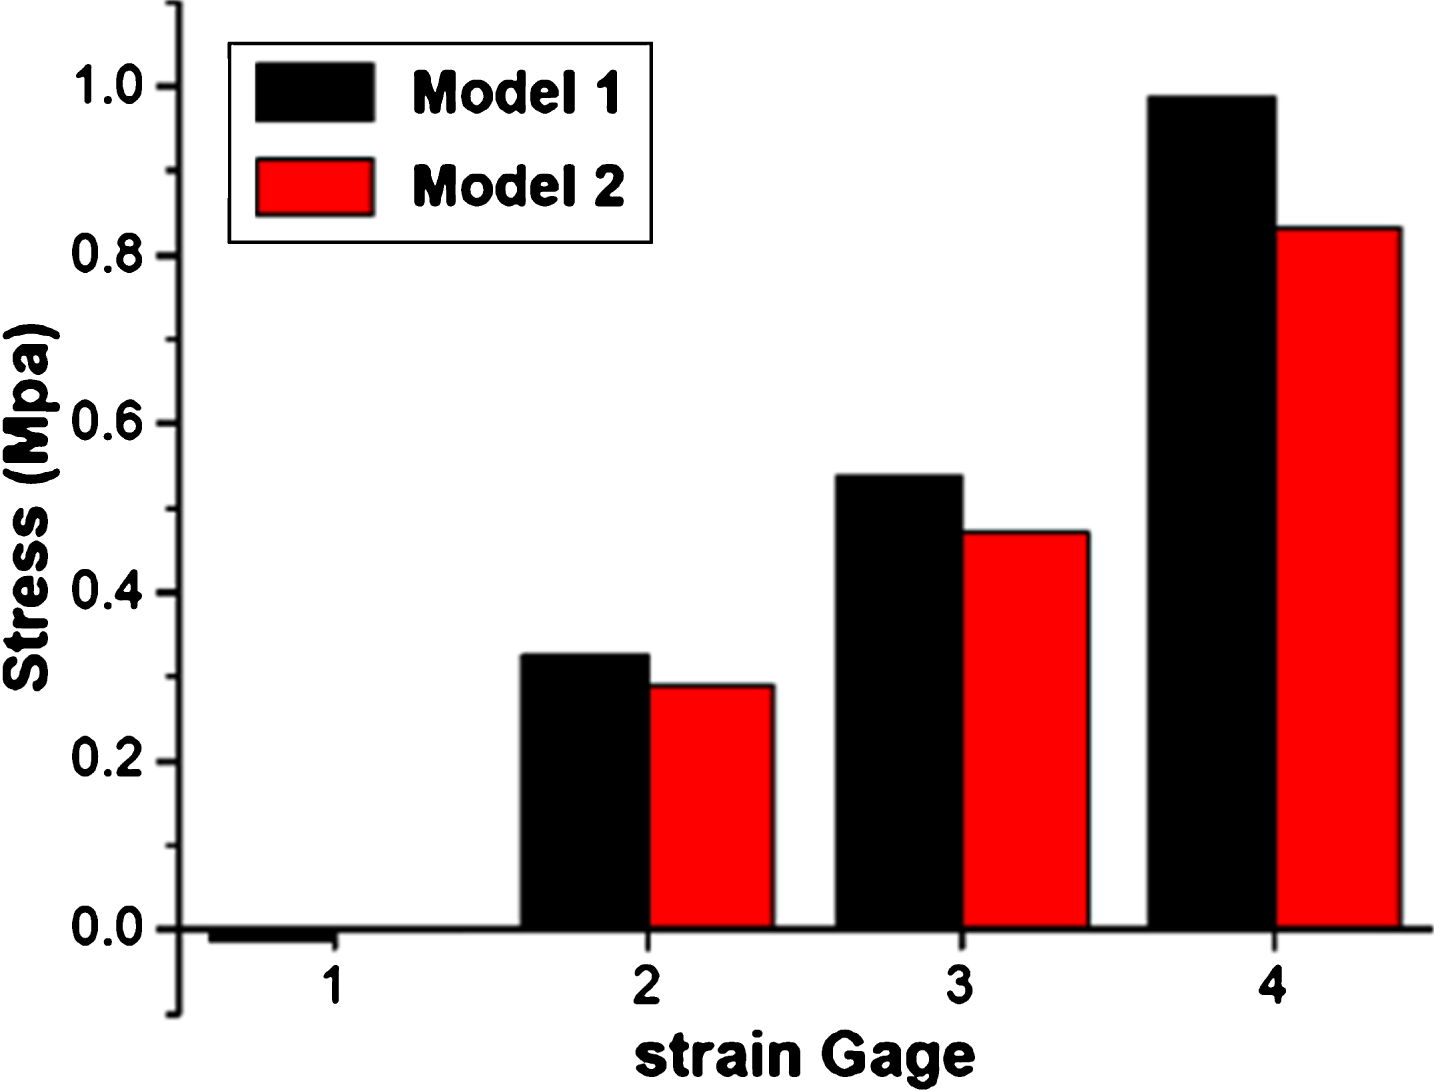
Two forms of continuity of mid-span stress.
In the study, a static-loading test was accomplished on a bridge with three continuous spans. The continuity for the bridge was achieved by post-tensioning the region with negative moments at continuity supports. Live load test results indicated the stress distributed on spans 8, 9, and 10 for all load cases. A full-scale model was developed by using a finite element software (ANSYS), and field test results were used to validate the model and revealed a good agreement. The 3D FE validated model was used to analyze the transfer of stress between adjacent girders and spans. The analysis indicated that the stress was distributed on the girders of adjacent spans at values that were almost equal. Joint continuity suggested that the forces due to the truck loading transfer from the loaded span to the adjacent span along the girders. A parametric study was conducted to examine the effect of post-tensioning on continuity. The results indicated that post-tensioning for continuity decreases positive moments in the girders, thereby increasing the load carrying capacity.
Footnotes
Acknowledgments
This study was sponsored and fully funded by the Inner Mongolia Transportation Department.