
Abstract
Life-cycle cost analyses are often considered in bridge management in conjunction with the decision-making process for bridge maintenance, rehabilitation, or replacement. An accurate estimate for these costs requires a better understanding, and proper modeling of, deterioration rate of a bridge’s components throughout its useful time. In considering the deterioration rate in bridge life-cycle cost analysis and management, special attention will need to be paid in regard to the potential for accelerated fatigue damage that can occur because of frequent use of overloads. Overloads and their potential for fatigue damage may in fact become a major cost item in the bridge overall life-cycle cost. In this study, an index representing the fatigue life expended (FLE) due to overloads is introduced and used as a driving factor in the deterioration curve to incorporate the significance of fatigue damage from overloads in the decision-making strategies in maintenance and rehabilitation and in bridge management.
Keywords
Instructions
Fatigue damage in bridges
In general, fatigue damage starts with the formation of micro cracks within structural components of bridges and grows with the repeated application of loads leading to failure. Fatigue cracks grow more rapidly as the intensity of truck weights and the frequency of truck load applications increase. A repeated application of heavy trucks may result in a faster rate of fatigue damage accumulation in fatigue-critical structural components (such as, for example, a steel beam with welded cover plates as shown in Fig. 1). The frequent heavy trucks can be very critical for certain bridges with critical components prone to fatigue damage.
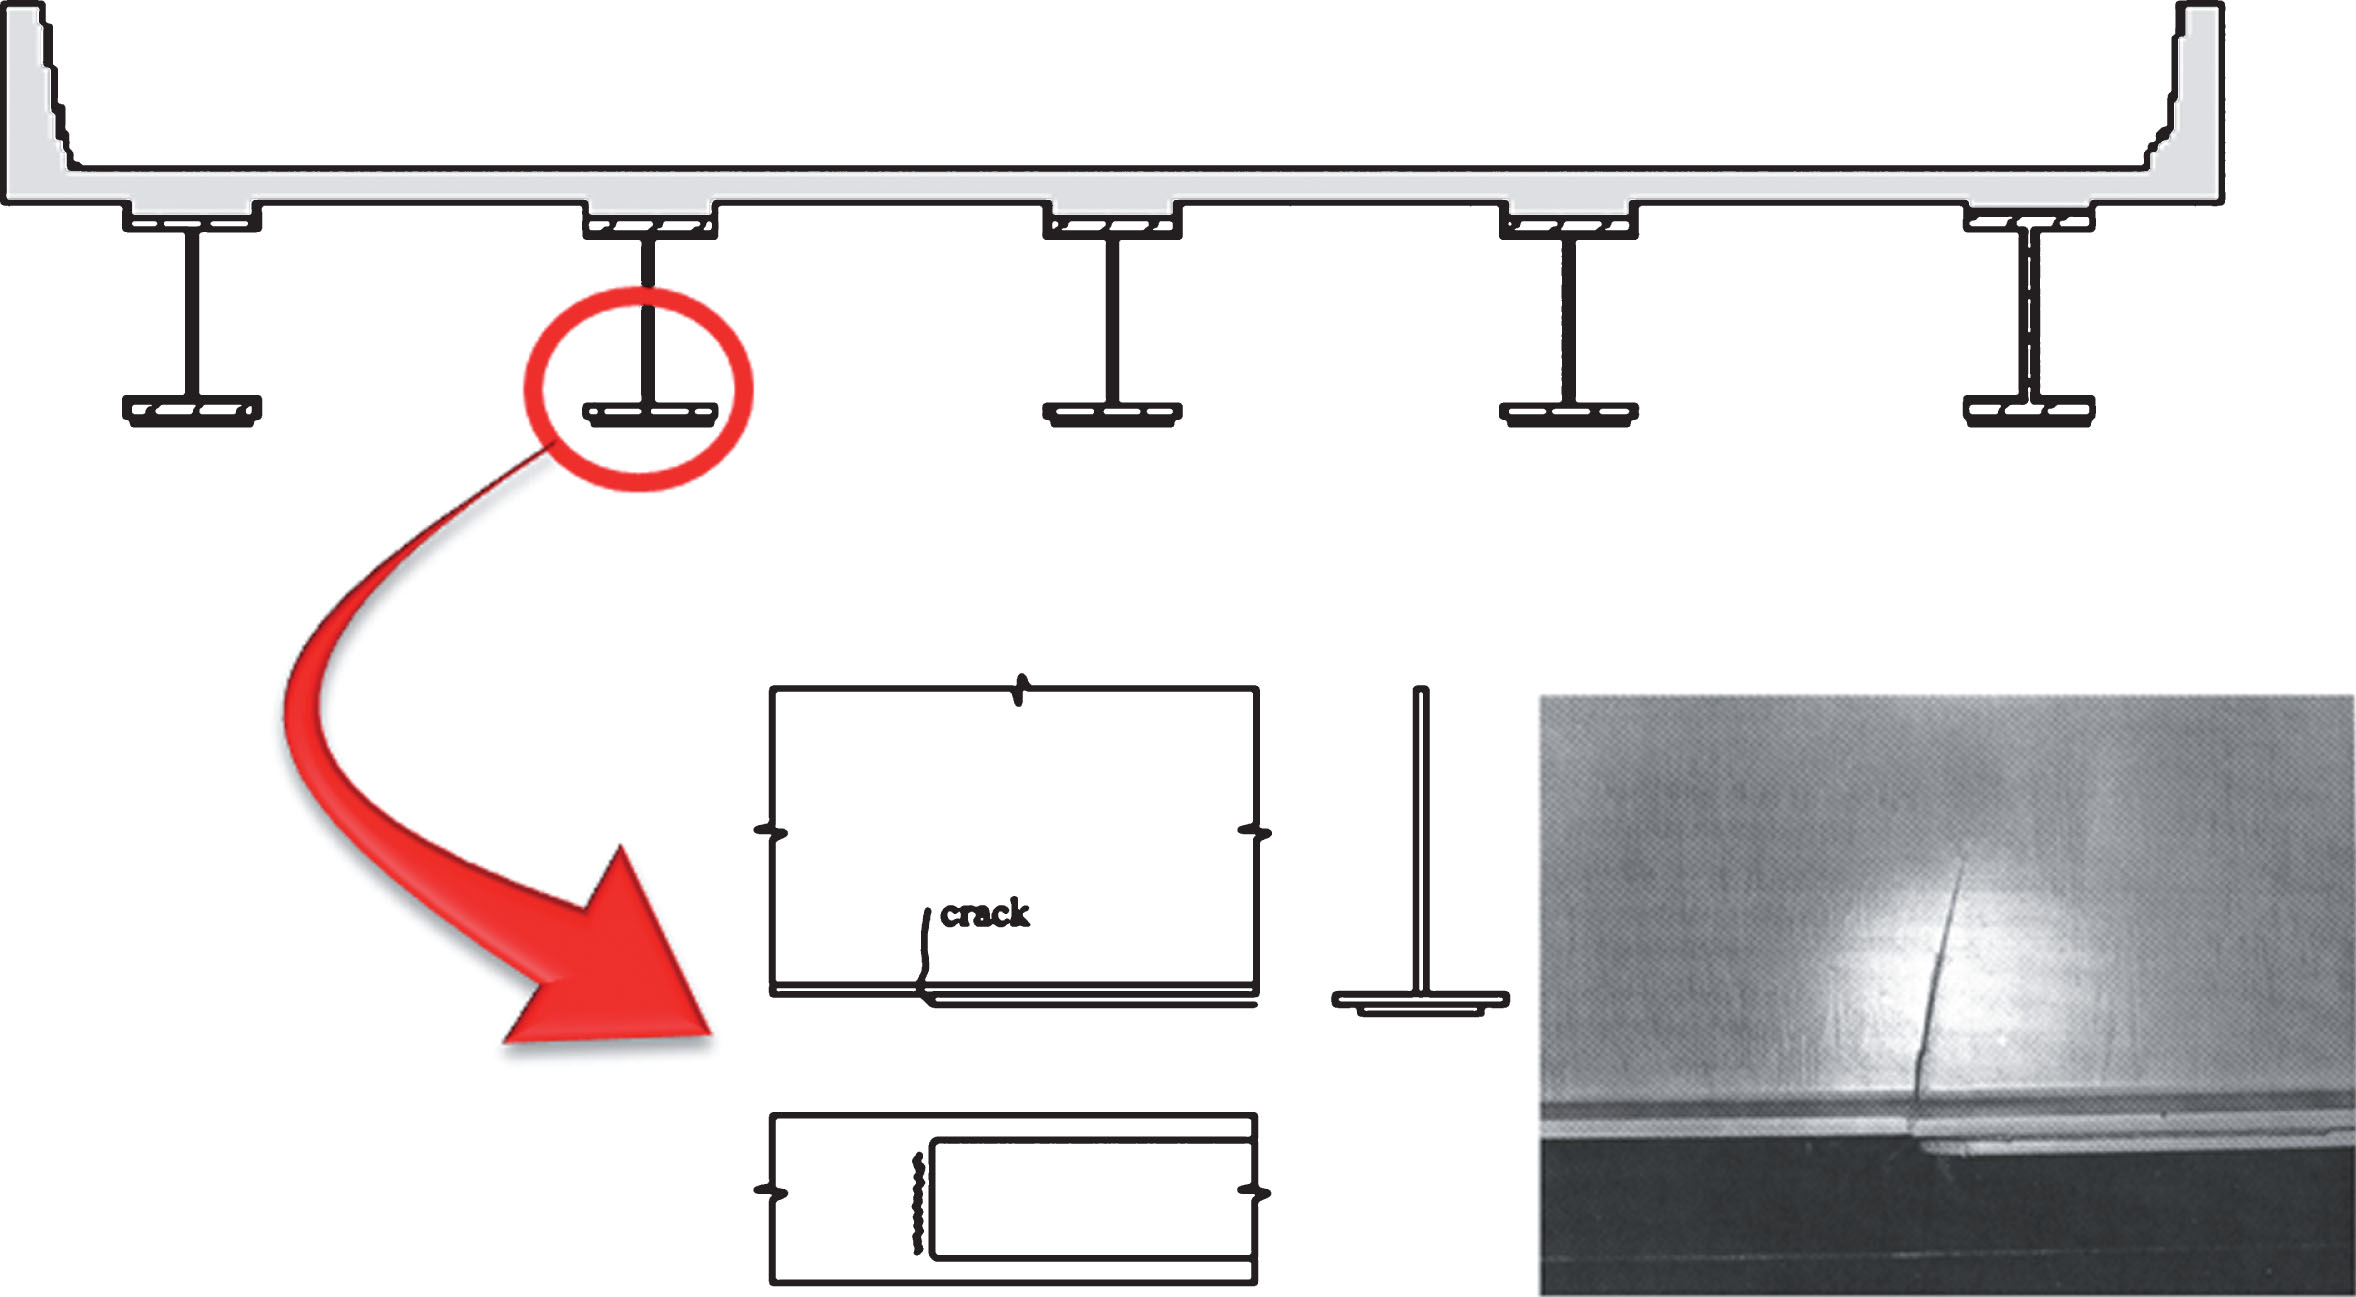
Fatigue detail used in the study (Kuehn et al., 2008).
The detail in Fig. 1 is designated in AASHTO specification as Detail Category E and E‘ (AASHTO 2018). It is one of the most critical details for fatigue damage and is broadly used for many steel girder bridges in the United States. The cover plates are welded to the bottom (and also sometimes the top) flanges of steel girder bridges in order to increase the moment capacity. As the requests for special permits to use bridges by heavy trucks increase, there is a concern over the potential for rapid damage to bridges (with critical fatigue components), if the number of such permits is issued frequently and without any control.
There are currently many bridges in service that have been built for truck weights below the design load of 356 kN (80 kips). Some of these bridges are along feeder ramps; and as such they are subject to the current truck weight of 356 kN (80 kips). These bridges are most vulnerable to an accelerated fatigue damage accumulation, which will result in a shorter fatigue life. Aside from this group of bridges, many newer bridges that have been designed for the 356 kN (80 kips) load are subject to loads higher than this load limit because of overload permits. It is noted that the term overload, as used here, refers to truck weights in excess of the 356 kN (80 kips) limit. Studies on the effect of truck load on highway systems have shown that truckload spectra often contain occurrences of overloads that in certain cases may actually be rather frequent (Jang 2018, Mohammadi & Shah 1992, Snyder et al., 1985).
Occasional passages of overload trucks may not impose any significant amount of fatigue damage on bridge components. However, these bridges become vulnerable to substantial fatigue damage, if they are allowed to use overloads frequently. This is especially important to older bridges that have been designed for loads lower than the standard for current highway bridge design in the United States (Jang & Mohammadi 2017, Jang 2018). It is indicated that the fatigue life expended (FLE) is significantly affected by the annual rate of truck traffic growth and the percentage of overloads in the entire truck load population (Jang & Mohammadi 2018). To incorporate the significance of fatigue damage from overloads in bridge management applications, the “fatigue index factor” introduced by Jang (2018) may be used in this study.
Life-cycle cost analysis for bridge
Life-cycle cost analyses (LCCA) are often considered in bridge management in conjunction with the decision-making process for bridge maintenance, rehabilitation, or replacement. A major portion of a bridge life cycle cost is associated with maintenance and rehabilitation that occur periodically. An accurate estimate for these costs requires a better understanding, and proper modeling of, deterioration rate of a bridge’s components throughout its useful time (Moses et al., 1987). The deterioration rate is affected by the structural type and design, volume and intensity of traffic, damage as a result of continuous use and fatigue, and the plan for scheduled maintenance (Hawk 2003). In general, the condition rating specific to bridges is used as an index to represent deterioration. When using the condition rating in bridge life cost analysis and management, special attention will need to be paid in regard to the potential for accelerated fatigue damage that can occur because of frequent use of overloads on the bridge. The risk of damage to the affected bridges due to overloads is greatly increased by changing regulations, unexpected or unprincipled operators, and steadily increasing loads. Overloads can especially cause cumulative damage (e.g., fatigue) that can lead to additional repair and replacement costs as well as to an increased risk for reduction in load capacity or service life (Jang & Mohammadi 2018). According to a National Cooperative Highway Research Program, NCHRP, study (2016), from 2005 to 2012, there has been an increase in the number of permits issued by state DOTs for overload trucks. With frequent applications of overloads on a given bridge, one may wish to have a closer look at the overloads and their damage potentials and perhaps consider certain control strategies in the overall bridge management practice. Thus, overloads and their potential for accelerated fatigue damage may in fact become a major cost item in the bridge overall life-cycle cost, if not addressed properly. This is especially true considering the fact that the truck populations continue to grow resulting in rapid bridge deterioration.
Objective
In this study, an index representing the fatigue life expended (FLE) due to truck overloads is introduced and used as a driving factor in the deterioration curve, which is used in the decision-making strategies in maintenance and rehabilitation and in bridge management. This paper describes an application of the bridge rating with the fatigue index factor in bridge management and bridge life-cycle cost analyses. The Life-cycle cost analyses are considered for determining bridge maintenance, rehabilitation, or replacement schedules. A major component in such analyses is a “bridge deterioration” equation. The “fatigue index factor” used in the bridge rating equations (Jang & Mohammadi 2017, Jang 2018) can be implemented in developing modified models for bridge deterioration to use in bridge management applications.
Bridges life-cycle cost analysis
Bridge life-cycle cost analysis
The life-cycle cost analysis (LCCA) is an engineering economic analysis tool. It is useful in quantifying the differential costs of alternative investment options for a given project such as bridge re-construction or for studying preservation strategies for existing systems. The “bridge” life-cycle cost analysis (BLCCA) is conducted to minimize costs over the long-term life of bridges (Hawk 2003). The underlying procedure in BLCCA is to (1) establish alternative options for a project; (2) determine activity timing for each alternative; (3) estimate agency and user costs; and (4) determine life-cycle costs. For each alternative, the output may be demonstrated graphically as shown in Fig. 2. The slope in the graph represents the deterioration rate of a bridge component or system. Each peak indicates the significance of a preventive maintenance or essential rehabilitation. In general, the bridge rating can be used for determining the deterioration rate whether obtained as a subjective measure by an inspector or through structural analyses.
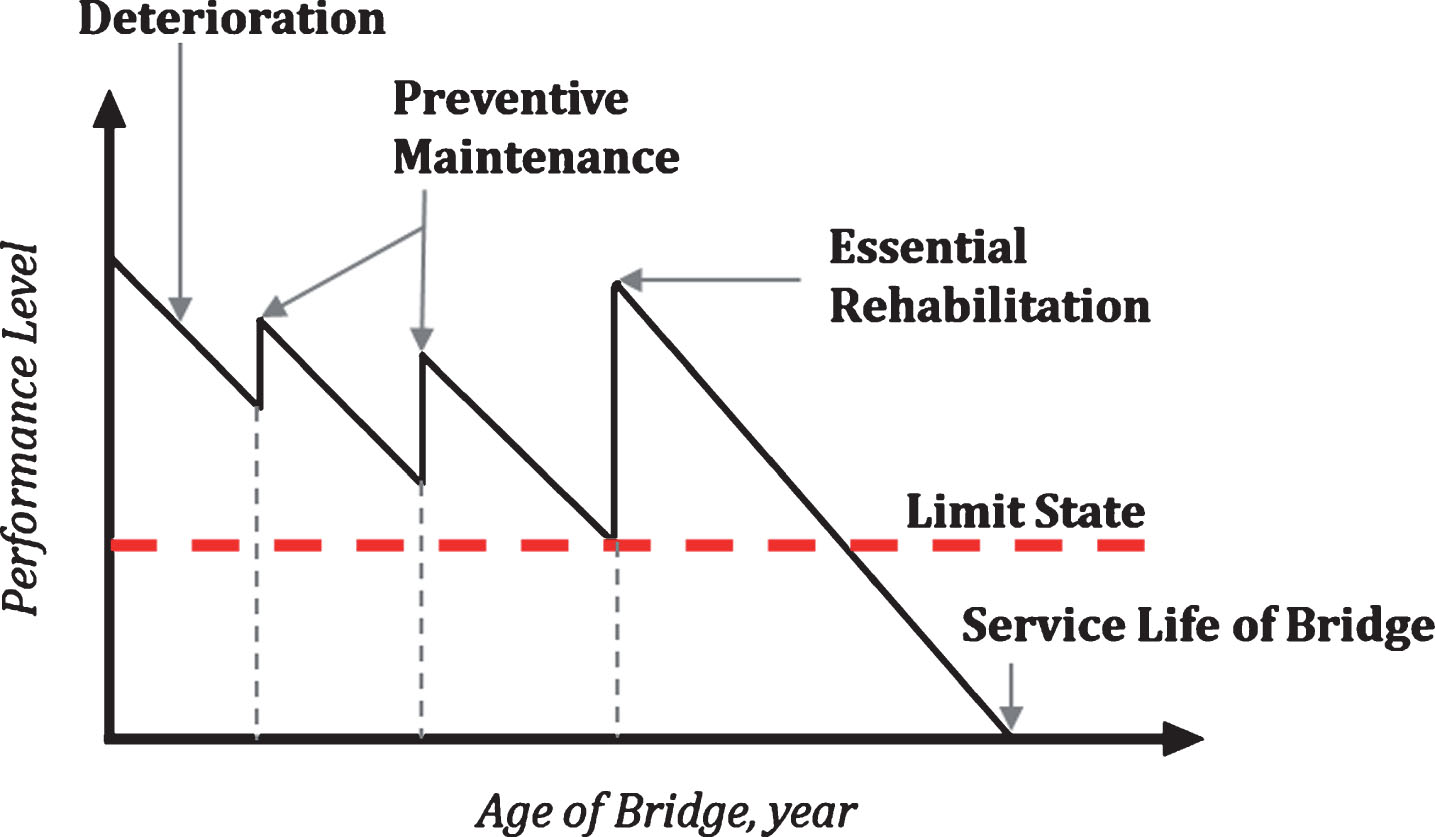
BLCCA output for each alternative.
Among various parameters affecting the deterioration of bridge condition, live loads are most significant. And of course, the effect of live loads can be accelerated when overloads (i.e., loads larger than the legal live load limits) are frequently applied. As indicated earlier, overloads can produce a reduction in capacity or service life of bridges potentially leading to direct agency and user costs as well as to an increased risk of future damage or failure. Hence, it is important to evaluate a bridge using BLCCA with consideration for the risk of potential fatigue damage due to overloads to optimize (1) an estimation of costs before construction and (2) a decision-making process for maintenance, rehabilitation, or replacement after a bridge is put to service.
The deterioration rate is affected by the structural type and design, volume and intensity of traffic, damage as a result of continuous use and fatigue, and the plan for scheduled maintenance. In general, the model used for deterioration rate represents a descending trend for the condition of a bridge or its structural elements. Various measures may be used to describe the deterioration in a structure. However, specific to bridges, generally, the bridge condition rating is used as an index to represent deterioration. Typical deterioration models are often shown as a curve for bridge rating with negative incremental slopes. These curves illustrate the situation when no actions (repairs or rehabilitations) are applied on the structure. Performing normal or routine maintenance influences the deterioration curve; and it can extend the service life of a bridge. The rating based on subjective condition assessment (condition rating) or analytical methods (analytical rating) can be used in such models. If analytical rating values are considered, then these values will need to be converted to measures that describe condition rating, since the deterioration curves currently available are mainly for condition rating. In a simple application of the modified rating models as proposed by Jang (2018), one can incorporate the fatigue damage potentials from overloads to modify the deterioration curves for use in BLCCA.
Application of fatigue index factor for estimating deterioration rates
Condition rating vs load rating
Bridges can be evaluated using either a visual inspection process (condition rating) or a detailed structural analysis (load rating). When bridge evaluation is conducted by a visual inspection, a subjective rating by an inspector is assigned to a bridge component. On the contrary, with analytical evaluation, the rating is computed based on the load applied and the resistance of the bridge component. A significant issue in the condition rating is the gap between the rating by the visual inspection and the actual condition of structure for a given bridge. Cattan & Mohammadi (1997) proposed that an expert subjective rating can be predicted by artificial neural networks (ANN) with the right input parameters (i.e., a bridge type, a span length, age of bridge, etc.). The results of ANN approach showed a reasonable performance in establishing the relation between the subjective (condition) rating and analytical (load) rating values. They suggested that a combination of both load and condition ratings be considered in bridge condition assessment because of each method’s pros and cons. In this study, the load rating is used to account for fatigue damage from overloads; and then is converted to the condition rating for bridge deterioration rate in BLCCA. The relation between the condition and load rating values is shown in Fig. 3 and assumed that: (1) a value of 1 for condition rating represents the rating factor (RF) from load rating for 75 years of bridge without any maintenances; (2) a value of 9 indicates the RF for the brand-new bridge; and (3) a value of 4 represents the situation that the rating factor (RF) equal to 1.

Relation between conditional and analytical ratings.
The load rating equation using the Load and Resistance Factor Rating (LRFR) philosophy is given by the following equation with the term (1+α
FLE
) added to the denominator. It is noted that the AASHTO equation is similar without, of course, the additional term in the denominator (AASHTO 2018). A rating value larger than unity is considered satisfactory; although in certain special situations, the bridge engineer may decide on a different target value for the rating. The modified rating equation accounts for the fatigue damage potential from the overloads (Jang & Mohammadi 2017, Jang 2018).
In Equation 1, φ is a capacity reduction factor; R n is a nominal capacity corresponding to the type of load for which the rating is being conducted; γ DC is a dead load factor for structural components and attachments; γ DW is a dead load factor for wearing surfaces and utilities; γ L is a live load factor for the rating vehicle; DC is a dead load effect due to structural components and attachments; DW is a dead load effect due to wearing surfaces and utilities; LL is a live load effect due to the rating vehicle; IM is an impact factor (dynamic load allowance); and α FLE = a fatigue index factor to account for the significance of the fatigue damage potentials of the overloads.
The proposed modified load rating equation presents the fatigue index factor to incorporate the fatigue damage potentials due to overloads. It is intended to reduce the rating value computed for a given bridge subjected to the overload trucks. The fatigue index factor, α
FLE
, is proposed as a bilinear function by Jang (2018). In a generic form, the equation for α
FLE
can be written as follows:
In which a = current age of bridge and OL = percentage of overloads in the truck load population. Figure 4 represents a bilinear function for the fatigue index factor. This factor can simply be implemented in modifying the bridge ratings (to account for fatigue damage) and establishing a revised deterioration curve accordingly for use in BLCCA.

Bilinear function of fatigue index, α FLE .
In a more detailed analysis, the results of BLCCA can be compared by using the value index (VI) model. The concept of the value index (VI) model was proposed by Mohammadi et al., (1995) in which a single parameter can be used to quantify the value of an alternative for bridge life-cycle cost analysis with consideration for the bridge condition, time and cost. The function of VI model is written in the following equation (Mohammadi et al., 1995).
In which r is the rating, t is time, c is the cost, and A s is the area under the rt curve (i.e., the bridge deterioration curve). The underlying concept of the value index (VI) model is that the increase in r and t results in an improvement in value index. However, the variable r is related to the cost, c. Thus, this model is used as an objective function and its result produces an optimum value of VI that can be used in decision-making procedure and estimation of an optimum time intervals between scheduled maintenance or rehabilitation.
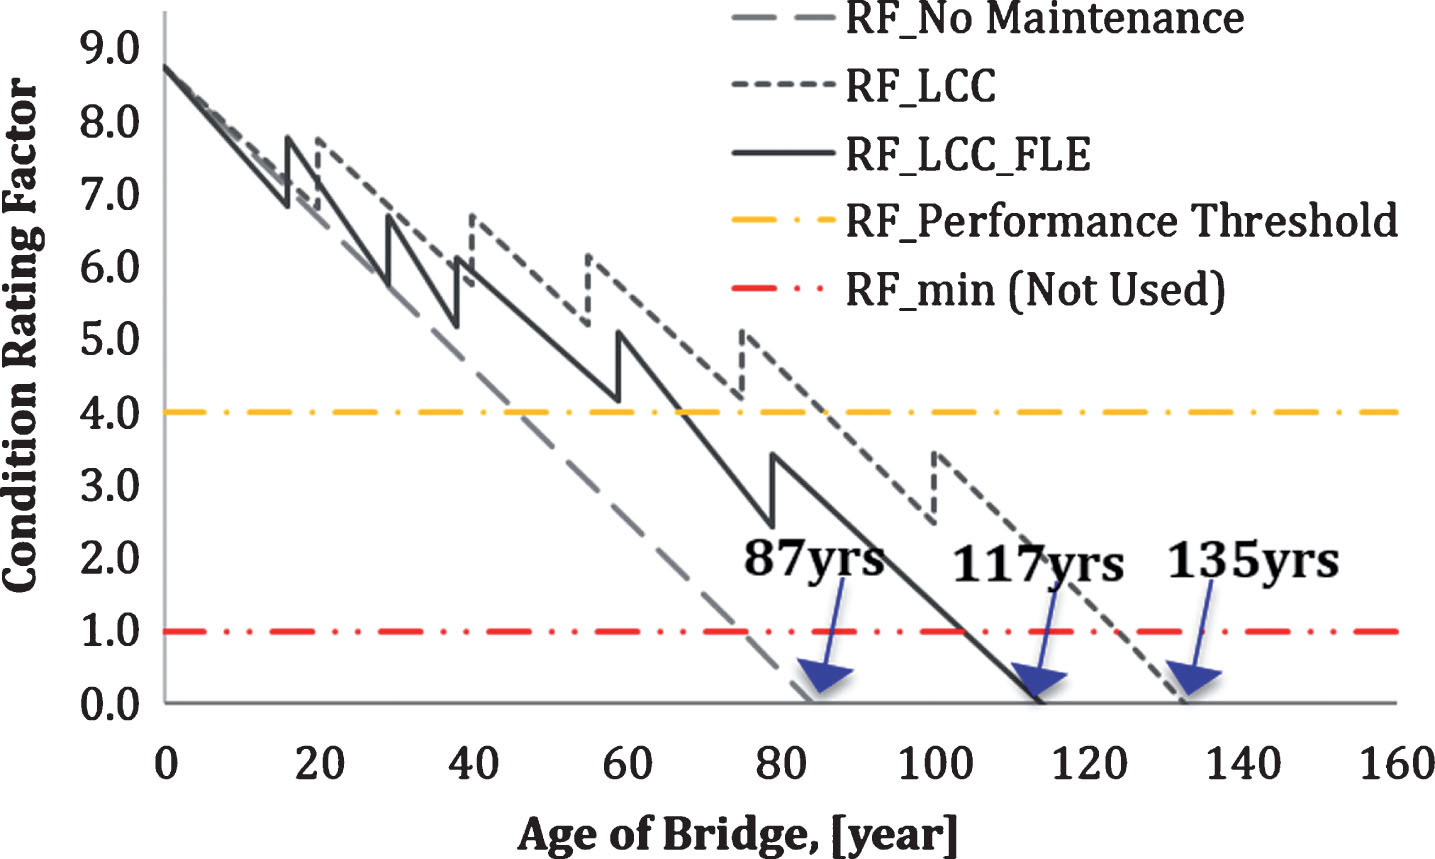
For illustrative purposes, a simply supported steel girder bridge with a welded cover plate (AASHTO Category E in fatigue details) is considered as used in this study. The span length of the bridge is 21.34 m (70 ft). The ADTT (Annual Daily Truck Traffic) and OL (the percentage of overloads in the truck load population) are selected as 2623 and 10.5%, respectively. Bridge design parameters that are common to all cases considered are: γ DC = 1.25, γ DW = 1.5, γ LL = 1.441, and IM = 1.2 (for minor surface deviations). Three different scenarios for the condition rating are considered. These are (Case I) no maintenance is used; (Case II) maintenance without a fatigue index factor applied; and (Case III) maintenance with the fatigue index factor applied. Figure 5 presents the results of life-cycle cost analysis for the example bridge. Obviously, if any maintenance and rehabilitation were performed, the service life of bridge would extend to 135 and 117 years, respectively, depending on whether or not the fatigue index factor is considered. With no maintenance, the service life is at 87 years.
Results of life-cycle cost analysis for three cases.
The value index (VI) model (Mohammadi et al., 1995) can further be considered in the analysis. In this example, the cost, c, in the function of value index is assumed as a unit cost for all three cases and the quantity value index is determined by computing the area under each deterioration curve. To simplify the problem, a linear deterioration function was used in the value index model. Figure 6 represents value index for each case. For case II and III, the value index is 639 and 514 respectively, which are higher than 380 obtained for case I. As expected, the service life of the bridge is extended for those two cases due to several maintenance or rehabilitation actions. The value index is also higher than case I with no actions. The value index for case II shows the highest among the three cases. However, it is not desirable since the potential for fatigue damage from overloads has not been incorporated in the index. This means this value index is not a true representative of the situation, if indeed frequent overloads are applied on the bridge. It is evident that the fatigue damage from overloads results in reducing the service life of the bridge and increasing the bridge-life cycle cost. Thus, the use of the modified rating with consideration for the fatigue damage potentials from overloads is suggested in BLCCA and in making decision for a maintenance and rehabilitation scheduling that is more consistent with realistic deterioration trend.

Value index (VI) for three cases.
The use of the fatigue index in the bridge rating with consideration for the fatigue damage potentials from overloads is suggested in BLCCA and in making decision for maintenance and rehabilitation scheduling. The fatigue index factor used in the bridge rating equations can be implemented in developing modified models for bridge deterioration in BLCCA to use in bridge management applications. The following are the main conclusions of this paper. The method is expected to offer a more realistic procedure for BLCCA by incorporating fatigue damage effects in the deterioration curves. When used in BLCCA, the bridge rating with the fatigue index factor is also expected to result in a more refined process for computing the value of each alternative and for estimating future maintenance and repair costs. The proposed method in this study shows that the fatigue damage from overloads results in reducing the service life of the bridge and increasing the bridge-life cycle cost.
Conflict of interest
None to report.