



Abstract
Fatigue assessment of the novel structural components that are not explicitly addressed in the existing bridge design codes require the application of the local fatigue assessment methods. This study presents fatigue assessment of the novel gusset-less connection of the case-study vertical lift truss bridge, the Memorial Bridge, in Portsmouth, NH. The long-term structural health monitoring responses are collected from the instrumented gusset-less connection at the Memorial Bridge to determine the nominal fatigue response using the collected strain responses. In addition, a global multi-scale finite element model of the bridge is created to effectively model the structural components of the bridge. A local sub-structure finite element model of the connection is created to determine the stress concentration factors that are applied for the hot-spot fatigue assessment method. The acquired stress concentration factors under the static and dynamic load test are applied for hot-spot fatigue assessment of the gusset-less connection.
Keywords
Introduction
Critical components of in-service steel bridges experiencing cyclic stresses, may face shorter fatigue life. The failure of the structural components can occur due to the propagated fatigue crack, which is formed at the fatigue prone areas. The fatigue cracks are frequently initiated at the high-stressed welded components that include the structural discontinuity or imperfections in the weld. Through regular evaluation of fracture-critical structural components of steel bridges, the risk of high costs of maintenance and replacements can be decreased.
In fatigue assessment of large structures including the long-span steel bridges, providing the stress responses at the high-stressed welded areas is one of the crucial steps. The stress ranges are frequently measured through instrumenting the data acquisition systems at the objective structural components of bridges. However, the limitation of access for installing the data acquisition systems, at the welded areas of the bridge, can influence the measured fatigue response. Using the stresses at a reasonable distance to the weld toe, may not reflect the fatigue condition of the welded component.
Multiple fatigue assessment methods, in recent years, are developed to determine the remaining life of the welded structural components. The stresses-based fatigue methods vary based on the stresses that are applied for fatigue analysis. For each fatigue assessment method, unique S-N curves are developed for the categorized welded structural components. Fatigue assessment of the modern-designed components, which are not documented in the existing bridge design codes, can be addressed through the application of local fatigue assessment methods (Neimi 1995).
The local fatigue assessment methods, using local stress ranges at the welded areas, can consider the local stress concentration effects induced by the weld geometry (Hobbacher 2015). The hot-spot stress method or notch stress methods are the local fatigue assessment methods that apply the stresses at the weld toe for fatigue analysis (Niemi et al., 2006). The local fatigue assessment methods, primarily, rely on the development of numerical models to provide the explicit stresses at the stress concentrated areas at the weld toe (Petershagen et al., 1991, Doerk et al., 2003). In recent years, extensive research efforts have been made to evolve the hot-spot stress method for fatigue assessment of the complex structural components using theoretical, experimental and numerical approaches (Maddox 2002).
The hot-spot stress method is primarily applied to address the fatigue assessment of the tubular welded connections (Lotsberg 2004). In recent years, many studies incorporated the hot-spot stress methods for fatigue assessment of the welded components at the long-span bridges in the local and global level (Chan et al., 2001). Ni et al. (2012) performed fatigue reliability assessment of the welded connections of a cable-stayed bridge using field collected data and hot-spot stress method. Aygul et al. (2013) compared the fatigue assessment of four different welded components of steel bridges using the nominal and hot-spot stress method. Wie et al. (2017) performed the fatigue assessment of the cope-hole details through the hot-spot methods using the experimental and numerical efforts. Alancer et al. (2018) recently, provided a global finite element (FE) model for fatigue assessment of a composite steel-concrete roadway bridge using the hot-spot stress method. In most of the available studies, the focus is made on the local performance of the welded components under the simplified loading conditions. The structural connections of steel bridges can have complex boundary and loading condition, which is applied through multiple structural members connected to the connection.
This study focuses on fatigue assessment of a newly designed gusset-less connection in a case-study bridge using the hotspot stress method. The case-study is the Memorial Bridge in Portsmouth, NH, a vertical lift truss bridge that carries the vehicular and naval traffics. The bridge has a long-term structural health monitoring (SHM) program that collects continues field data including the nominal strains at multiple locations of the gusset-less connection. In addition, a global FE model, that includes all the structural members of the bridge, is developed to complete the information required to understand the performance of the connection. The FE model, in this study, is also applied to determine the variability of the hotspot stresses and the nominal stresses at the welded area of the connection. The hotspot stresses at the weld toe of the gusset-less connection is achieved using the field collected nominal strains and the stress concentration factors defined by the FE model.
Fatigue assessment methods
The installed strain rosettes at the representative structural component of steel bridges provide the structural response as the strain time-history at the sparse locations of the connection. The field collected responses are in a reasonable distance to the weld toe, providing the nominal strain responses. Consequently, the acquired SHM data can be applied for fatigue assessment of the objective critical components using the nominal stress method. The structural hot-spot stress response of at the weld toe of the component can be provided through the incorporation of a validated FE model and field collected data. The two applied approaches for fatigue assessment of the investigating connection, the nominal stress method and the hot-spot stress method, are explained in this section.
The nominal stress method
The nominal stresses at the welded structural components are determined in a distance to the weld toe, as shown in Fig. 3. In the nominal stress method, the nominal stress as well as the appropriate S-N curve, developed for the category of the investigating component, is applied to measure the fatigue remaining life of the component. The bridge design code, AASHTO, has documented a variety of the welded structural components various structural component into multiple fatigue categories, A-E, (AASHTO 2012). However, for the complex welded components, that are not considered in the existing fatigue design codes, application of the S-N curves relies on engineering judgments and the assumptions.
The novel gusset-less connection is not cataloged in the standard fatigue design codes, including AASHTO. Therefore, based on the designer’s assumption and the existing studies for the fillet welds, the category C is employed for fatigue assessment of the connection. The determined properties of Category B are applied to measure the fatigue damage index, using the Miner’s rule that is expressed as Equation 1. The required stress/cycles are provided through post-processing the field collected data, using the rainflow cycle algorithm (Downing & Socie 1982).
The hot-spot stress method does consider the local stress concentration due to the notch effect at the weld toe, while excluding the non-linear peak stress, as shown in Fig. 1. The hot-spot stress can be determined by extrapolating the stress responses at the reference points (Fig. 1). The distance of the reference points to the weld toe depends on the type of the weld and size of the mesh in numerical models. For the investigating fillet weld toe, the reference points at the web of the connection, are located at the 0.4t and 1.0t (t is the thickness of the web) in a perpendicular distance to the weld toe, respectively, expressed in Equation 2. The stress responses at the reference points can be achieved using the numerical model and the fine mesh sizes. In the experimental efforts, the hotspot stresses are achieved by placement of the data acquisition system at the reference points (Radaj, 1990).
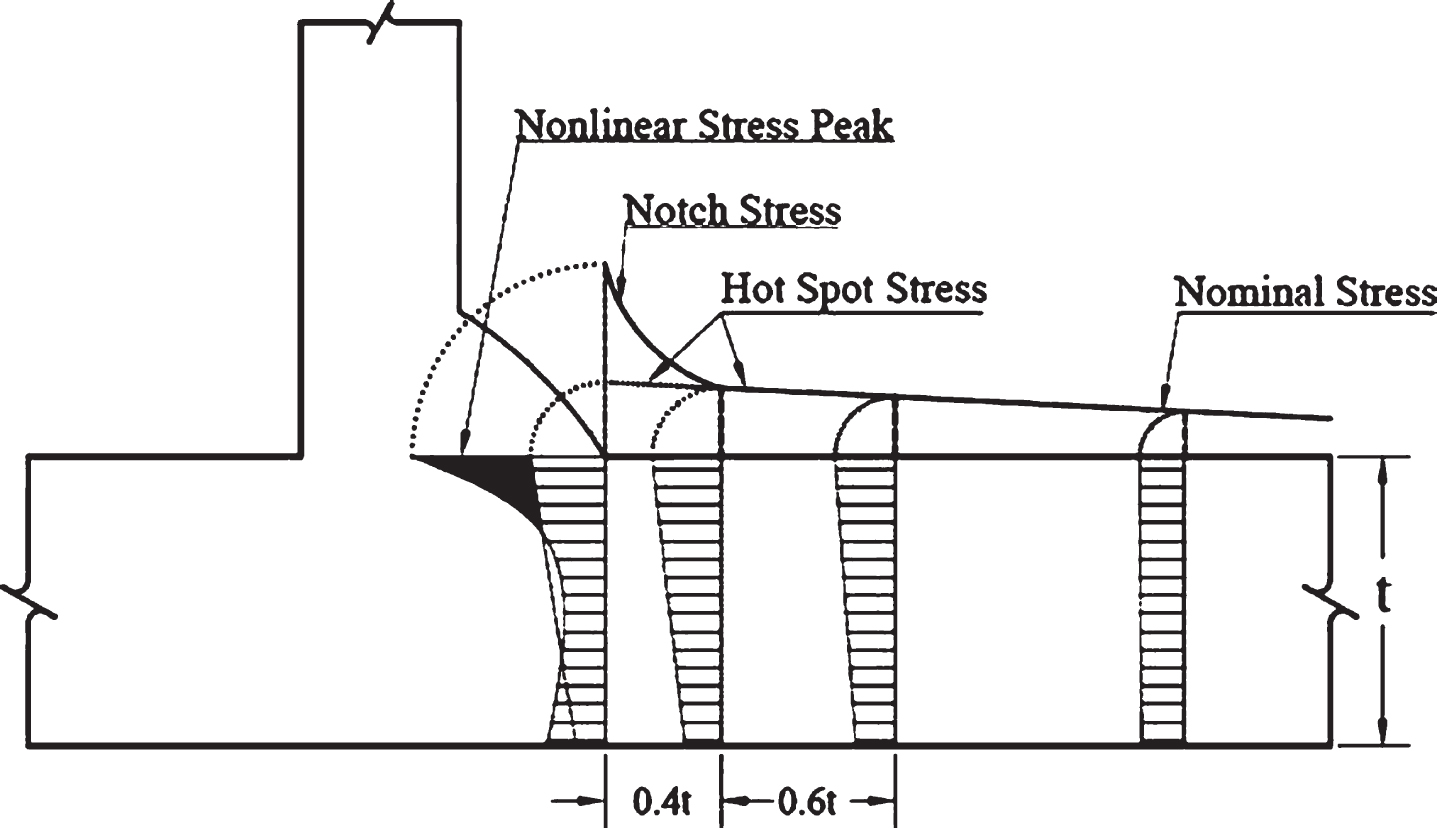
Hot-spot stress extrapolation at the weld toe (Niemi, et al., 2006).
The ratio of the hot-spot stress range at the weld toe to the nominal stress ranges is defined as the stress concentration factor (SCF) expressed in Equation 3. The SCF, that is frequently determined using the numerical models, can be multiplied to the nominal stresses to achieve the hot-spot stress without the requirement to the reference points. The SCF is frequently applied for the hot-spot stress fatigue assessment of the structural components using the field collected nominal strain responses. A single SCF is determined and applied to the variable amplitude field collected data (Niemi & Tanskanen 1999).
In addition, the hot-spot stress method applies less S-N curves as compared to the nominal stress method. In IIW (international institute of welding), the fatigue classes (FAT class) and the associated S-N curves are expressed based on the type of the weld as well as the weld geometry (Dong 2001). For the fillet welds, it is recommended to apply FAT 90 for the load carrying fillet welds and FAT 100 for the load carrying fillet welds (Fricke 2001). In this study, regarding the performance of the weld at the gusset-less connection, FAT 100 is applied for fatigue assessment at the curved fillet welds (Radaj and Sonsino 1998).
In developing the appropriate numerical model for the hot-spot stress method, an extensive study is performed by the researches to specify the requirements of an efficient FE model. The appropriate FE model for the hot-spot stress method requires a careful attention in providing the mesh insensitive models. In the previous studies, it is recommended to apply the fine mesh sizes (maximum of 0.4t) and higher dimensional elements such as the three-dimensional solid elements, as shown in Fig. 2. Also, the incorporation of the weld geometry in the FE model is illustrated to have a significant impact in predicting the precise hotspot stresses at the weld toe (Savaidis & Vormwald 2000). The weld geometry can be either modeled using the thick shell elements or solid elements, as shown in Fig. 2. In this study, due to the considerable size of the weld and the geometry of the curved fillet weld, the 20-noded solid elements are applied to model the gusset-less connection and the fillet welds.

FE modeling of the welded component (a) shell element, (b) solid element with weld geometry (Fricke 2001).
The bridge specifications
The newly reconstructed Memorial Bridge is a vertical lift truss bridge in Portsmouth, NH, inaugurated in 2013 (NHDOT, 2016). The bridge includes three identical spans, two fixed and one moving span at the middle, which is lifted through the two lifting towers in each side of the span, as shown in Fig. 3a. The bridge also includes a novel gusset-less connection situated at the tower, top and bottom chords of the truss bridge which directly joints the horizontal chords to the diagonal members (shown in Fig. 3b). The connection consists of a complex-geometry web and cold-bent flanges which are joined through the 1.58cm curved fillet welds.

a, The Memorial Bridge, Portsmouth, NH, b, The gusset-less connection of the Memorial Bridge (Nash, 2016).
The Memorial Bridge has a long-term SHM program, following one of the “Living Bridge project” goals, to provide a continues information on the global performance of the bridge as well as the local performance of the gusset-less connection (Adams et al., 2017). The acquired data are applied for the design verification and condition assessment of the bridge, under the induced excitations of the traffic loads and lift operation. The SHM system is installed at the south span and south tower of the bridge through a designed instrumentation plan to provide real-time data since March 2017. This instrumentation plan includes 16 strain rosettes, 2 uni-axial strain gages, 12 uni-axial accelerometers, 4 tiltmeters and a weather station installed at multiple locations of the bridge that collect data with the sample rate of 50 Hz (Mashayekhizadeh et al., 2017). Shown in Fig. 4 is the array of five strain rosettes that are installed at the bottom gusset-less connections of the bridge. The installed strain rosettes aimed at providing enough information on the structural response of the connection. In this study, the long-term time-history strain responses of the strain rosettes, installed at the bottom connection, are applied for fatigue assessment.
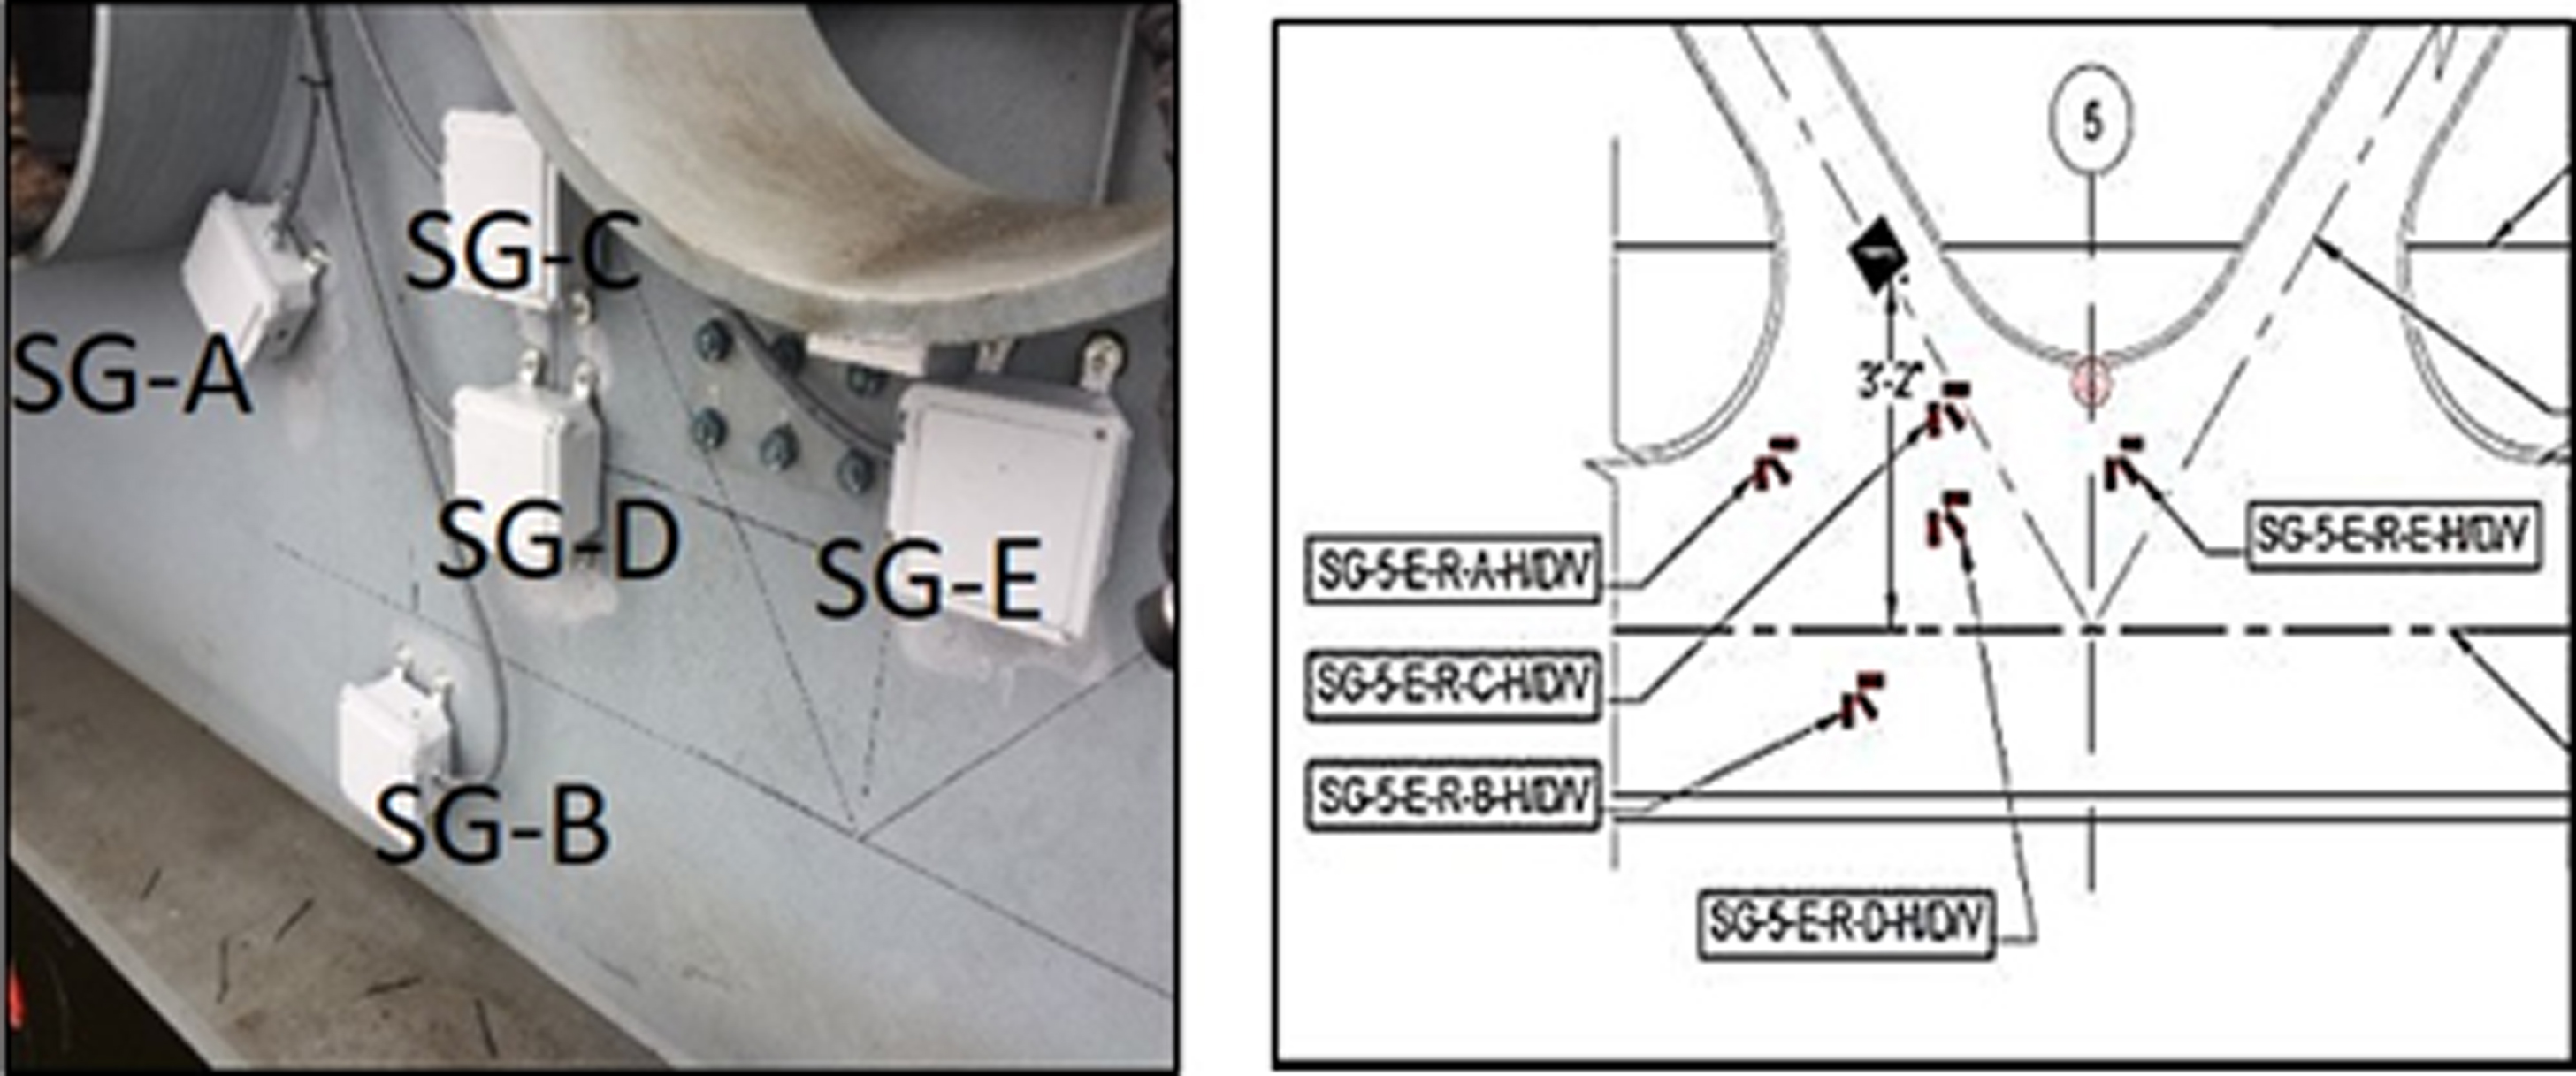
Instrumentation of a Bottom-Chord Gusset-less Connection at the Memorial Bridge, Portsmouth, NH.
The innovative gusset-less connection is designed to improve the local performance of the connection by increasing the robustness of the component while decreasing the requirement for maintenance of the component. The gusset-less connection is applied in a truss bridge, which is connected to multiple structural members in the planar and out-of-plane Direction. In the planar direction, the bottom connection is continuously connected to the bottom chords. In addition, through bolted connection, the gusset-less connection is connected to the diagonal members. In the out-of-plane direction, the gusset-less connection is connected to the transvers floor beam, connecting the two trusses at the east and west side of the bridge. There is, also, a skewed floor beam, connecting the floor beam to the web of the gusset-less connection through the bolted joints.
The connected members to the gusset-less connection apply complex load condition as a result of the variable amplitude traffic loads. Therefore, apart from the complex geometry of the gusset-less connection, it is essential to investigate the influence of the variable loading condition on fatigue performance of the connection. The changes in the direction and amplitude of the stress ranges can influence the location of the crack initiation and the direction of the fatigue crack propagation. The global FE model, in this study is aimed to understand the variability of the loading and conditions under the dynamic traffic loads. Using the global FE model, the dynamic truck loads are simulated and the stresses at the gusset-less connection are achieved as the time-history responses.
The numerical model of the bridge
The global model of the long-span bridges
A global FE model that incorporates all the structural members, aids to understand the details of stress distribution at the welded area of the structural members. In addition, the numerical model helps to determine the location of the maximum hot-spot stress that is prone to fatigue crack initiation. However, the global FE model that includes all the structural components may significantly increase the computation time, which adversely impacts the efficiency of the model.
The FE model of the case-study bridge
In this study, a global time-efficient multi-scale FE model is applied to determine the structural responses at the welded locations, under the traffic loads. The multi-scale approach which incorporates multiple dimensional elements in a single global model is applied to develop a three-dimensional global model, shown in Fig. 5. The model is developed in LUSAS, a commercial FE software package, applied for structural analysis of the large-scale models. The developed model considers the gusset-less connection as the three-dimensional members, modeled with the thick shell elements, while the remainder of the structural members are modeled with the two-dimensional beam elements. The coupling of the opposing dimensional elements is performed using the multi-point constraint equations (Mashayekhi & Santini-Bell 2018).
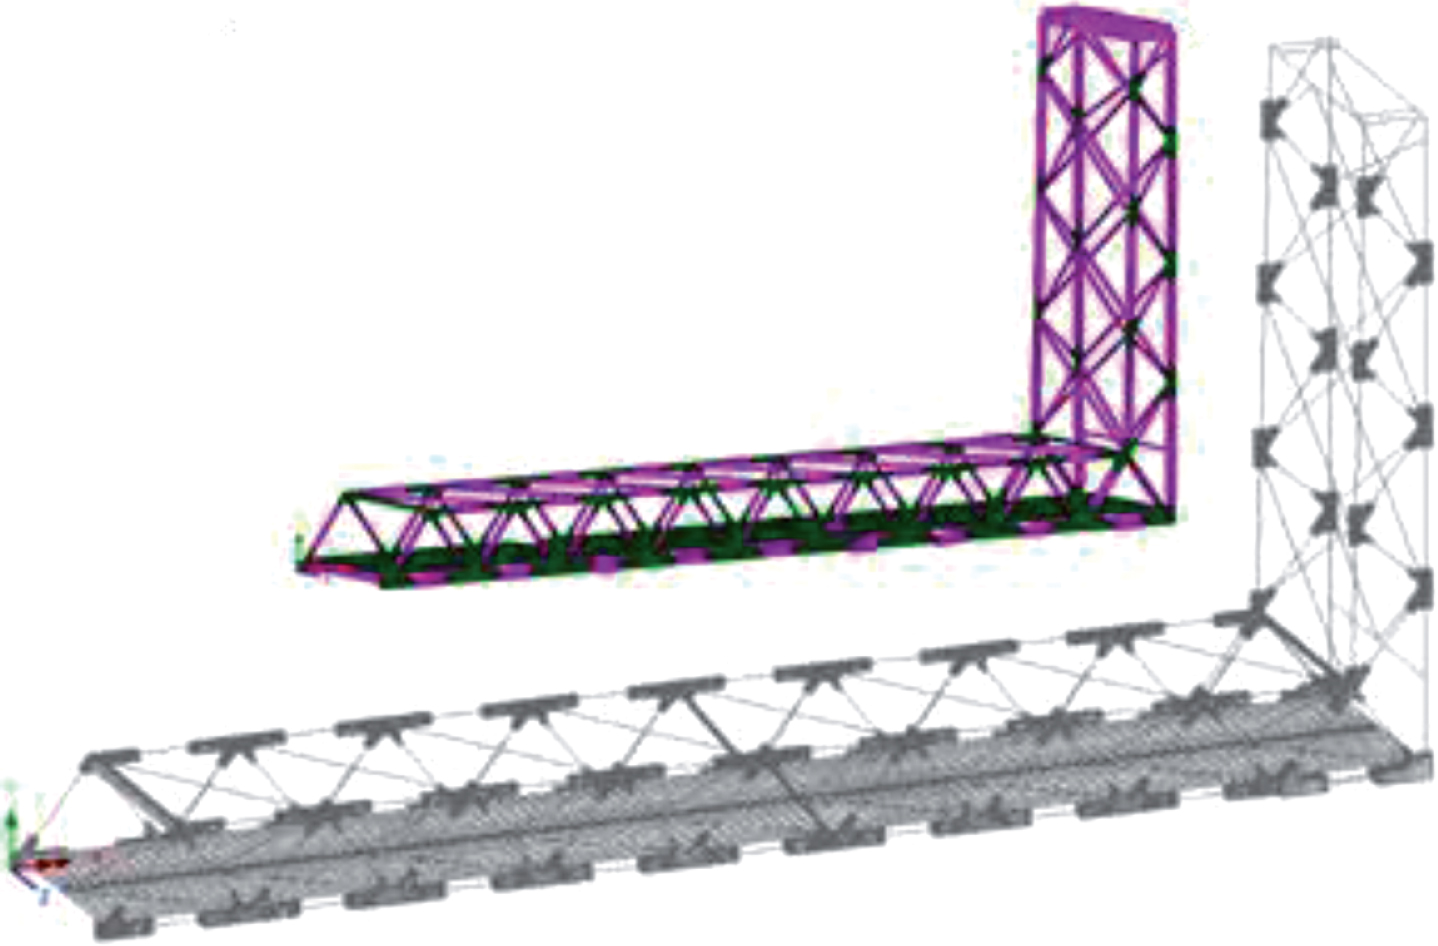
Multi-scale global model of the Memorial Bridge in LUSAS.
The complex geometry of the gusset-less connection and curved fillet weld may necessitate to apply higher dimensional solid element to precisely predict the hot-spot stresses at the weld toe. However, the required prerequisites for the fine mesh sizes, as well as the higher dimensional element, can considerably increase the computation time that opposes with the time-efficiency goal of the model. Therefore, a sub-structure model of the gusset-less connection, which is modeled corresponding to the requirements for the hot-spot stress method, is created, as shown in Fig. 6. The sub-structure model includes the 20-nodded hexahedral solid elements for the welded areas, and 10-nodded tetrahedral elements for the rest of the connection. The boundary conditions of the substructure model are defined by the displacement results of the global model at the equivalent locations. In Table 1, the properties of the global multi-scale model and the associated sub-structure in terms of the type and the number of elements are expressed.
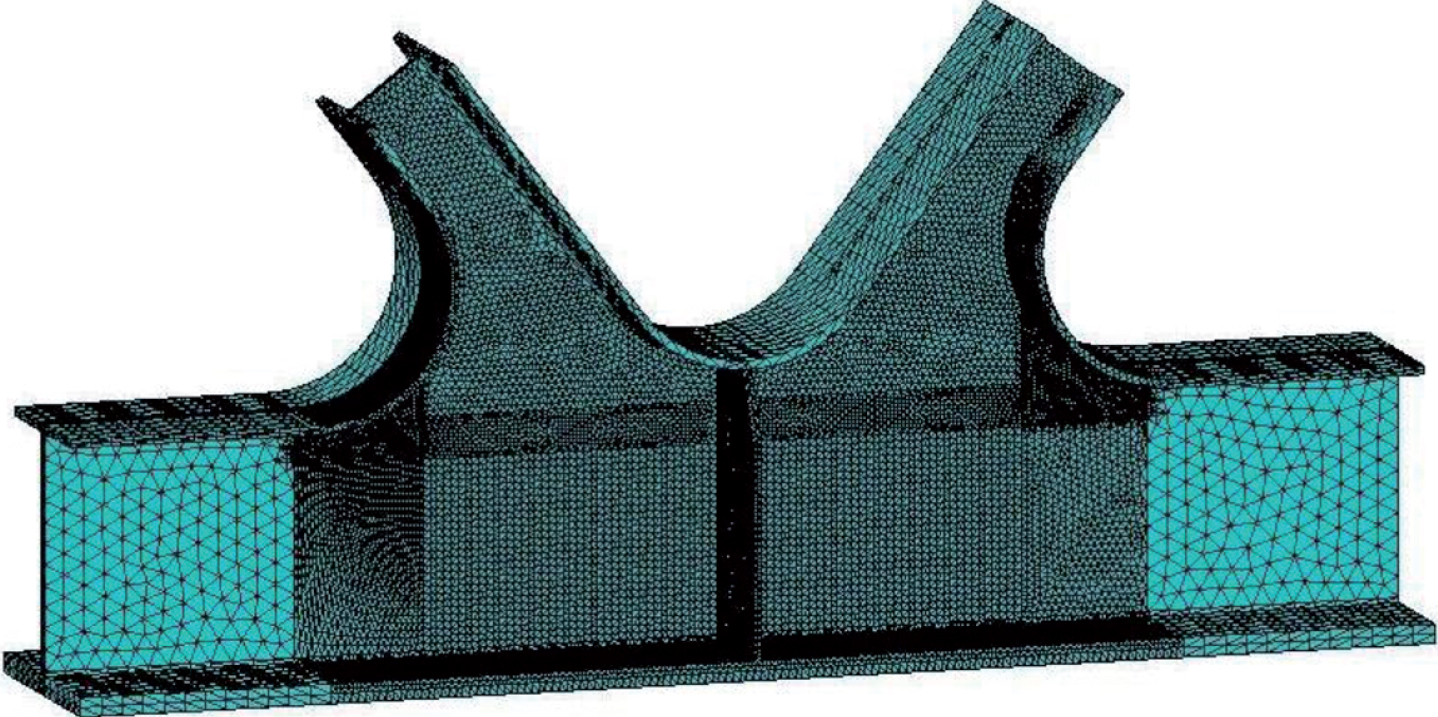
The sub-structure model of gusset-less connection at the Memorial Bridge in LUSAS.
Properties of the sub-structure and multi-scale finite element models
The accuracy of the developed model is required to be verified to apply the numerical responses for the fatigue assessment goal of this study. In this section, the verification of the developed FE model is performed through a designed load test with measured truck size and weight. The selected truck is a two-axle dump truck, weighting 255 MPa (103 MPa and 151 MPa axle loads). A total of twelve tests, including the dynamic and the pseudo-static load tests (with two stops) are performed at the northbound and southbound lanes of the bridge. The numerical results are achieved by applying the truck loads as the four-point loads, to the deck of the model. The model verification is performed through comparison of the numerical and field collected strain responses at the location of the strain rosettes of the gusset-less connection. Since the focus of the current study, is the performance assessment of the bottom gusset-less connection, only the verification results for this connection are provided.
In Fig. 7, the field collected and numerical responses of the five strain rosettes under the truck load (truck load test) are compared. The strain responses are expressed in the bar charts showing the responses under the static truck load (at the second stop of pseudo static load test) in the northbound. It can be observed that the results of the sub-structure model are slightly higher than the multi-scale global model.
The higher strain response of the sub-structure model can be due to the application of the solid elements that provides a lower stiffness as compared to the shell and beam elements. In addition, in the location of the strain rosette D, the field strain response is higher than the numerical results, which can be due to the difference between the applied load to the model and the field conditions. The acquired results indicate the verification of the global and the sub-structure FE models in predicting the desired stress responses, to be applied in this study.

Comparison between the numerical result and field data at the load test for model verification.
A more detailed comparison is provided between the strain contours of the models to understand the difference between the application of the global and local model as well as the shell and solid elements, respectively. As shown in Fig. 8, it can be observed that the models can represent the hot-spot locations at the curved weld toe. The higher stress concentrations, induced at the substructure model, can be due to the short length of the floor beam modeled in the substructure model. Since the truck load is directly applied to the floor beam, large bending moment is applied to the web of the connection. The illustrated difference between the results of the substructure to the field data and the multi-scale model notifies for modifications of the substructure model. Before applying the numerical results for the fatigue assessment purpose, the boundary conditions of the sub-structure model are calibrated to acquire the desired response. In the next section, the application of the models for fatigue assessment is explained.
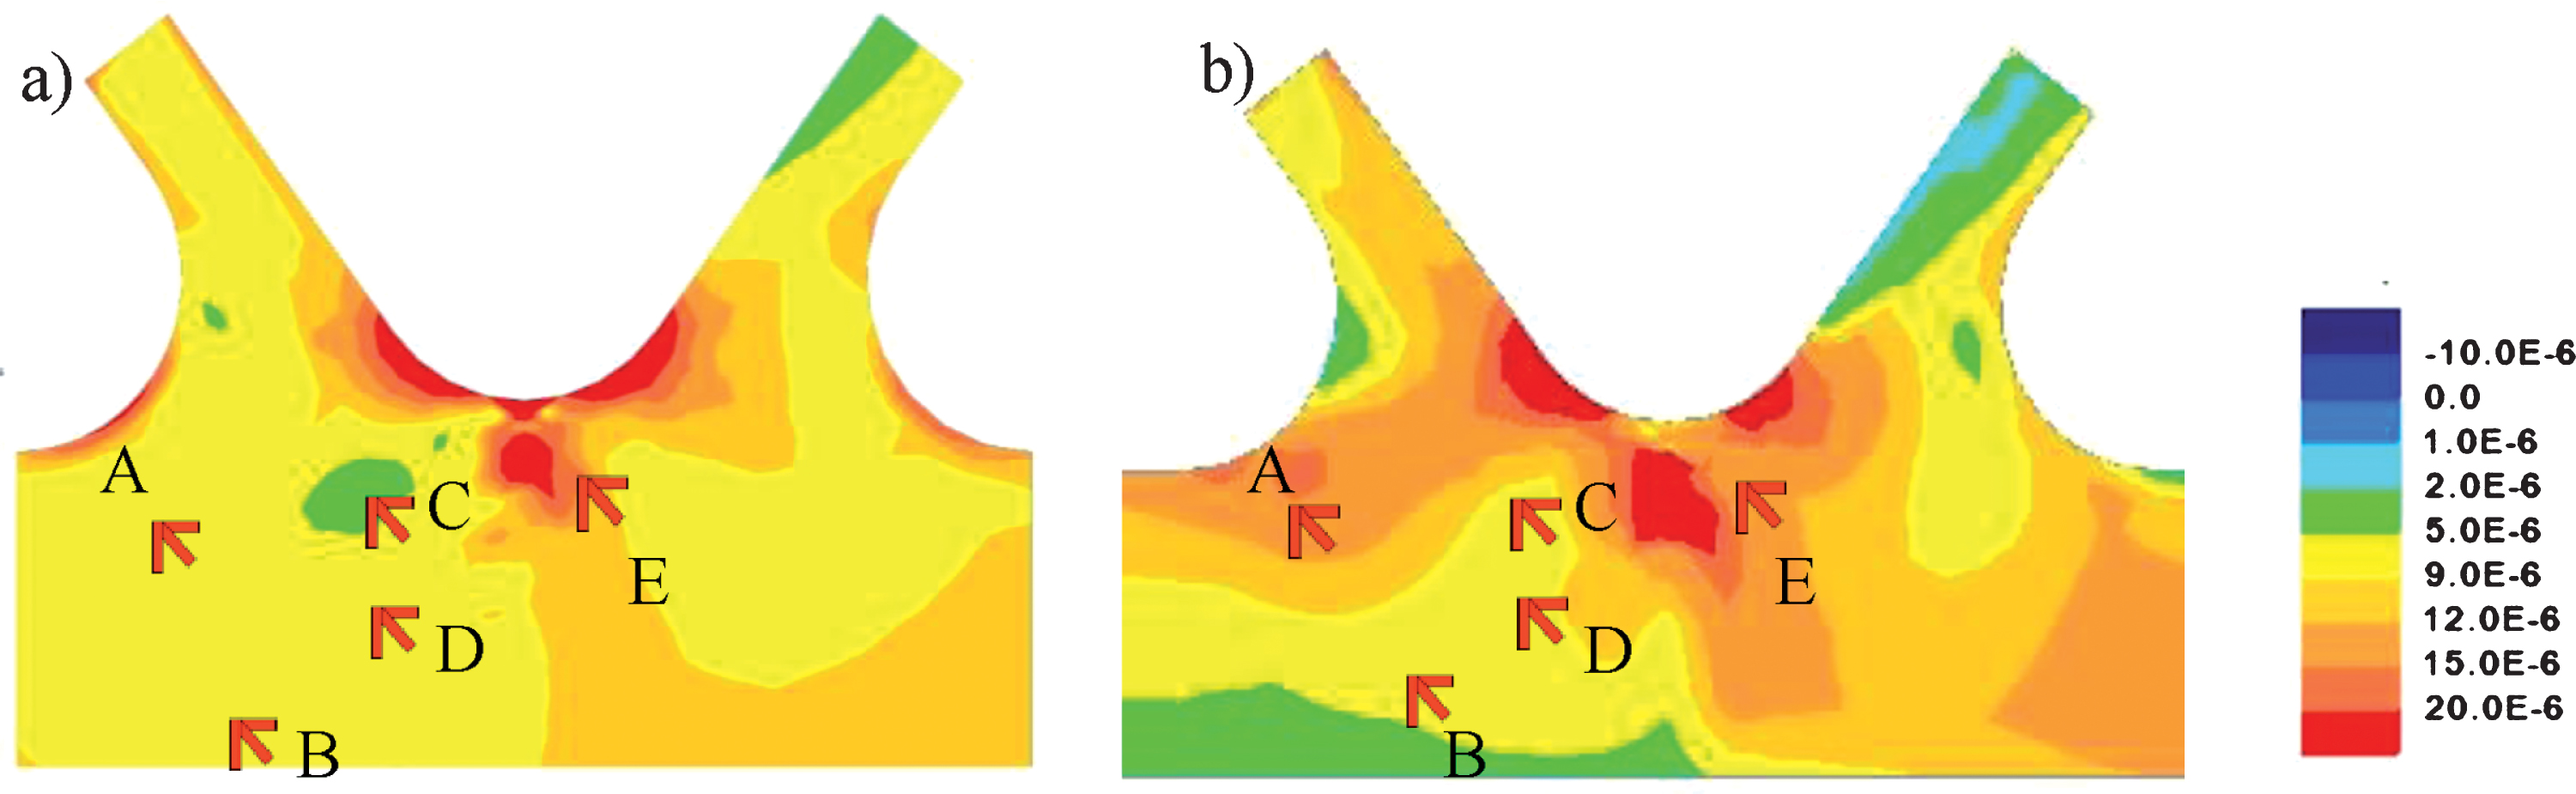
The strain contours of the gusset-less connection for the a) multi-scale model and b) the sub-structure model.
Using the field collected SHM data
For fatigue assessment of the gusset-less connection, one-year period of data is collected and post-processed. The long-term period of data collection ensures that the frequent experienced stress ranges at the bridge are considered for fatigue assessment. As shown in the instrumentation plan of the bottom connection in Fig. 2a, two strain gages are close to the curved welds, SG5A and SG5-E. In Fig. 9, the examples of the time-history stress response of the two strain rosettes are shown. In this study, SG5-A, which is located close to the curved weld of the gusset-less connection, is selected to investigate the fatigue performance of the gusset-less connection. In Table 2, the results, including the maximum recorded stress range, the average of the measured fatigue response, are provided for the four different seasons at the year of data collection. The less variability, observed in the recorded stress ranges for the four different seasons, results in the negligible difference in the measured averaged fatigue responses.
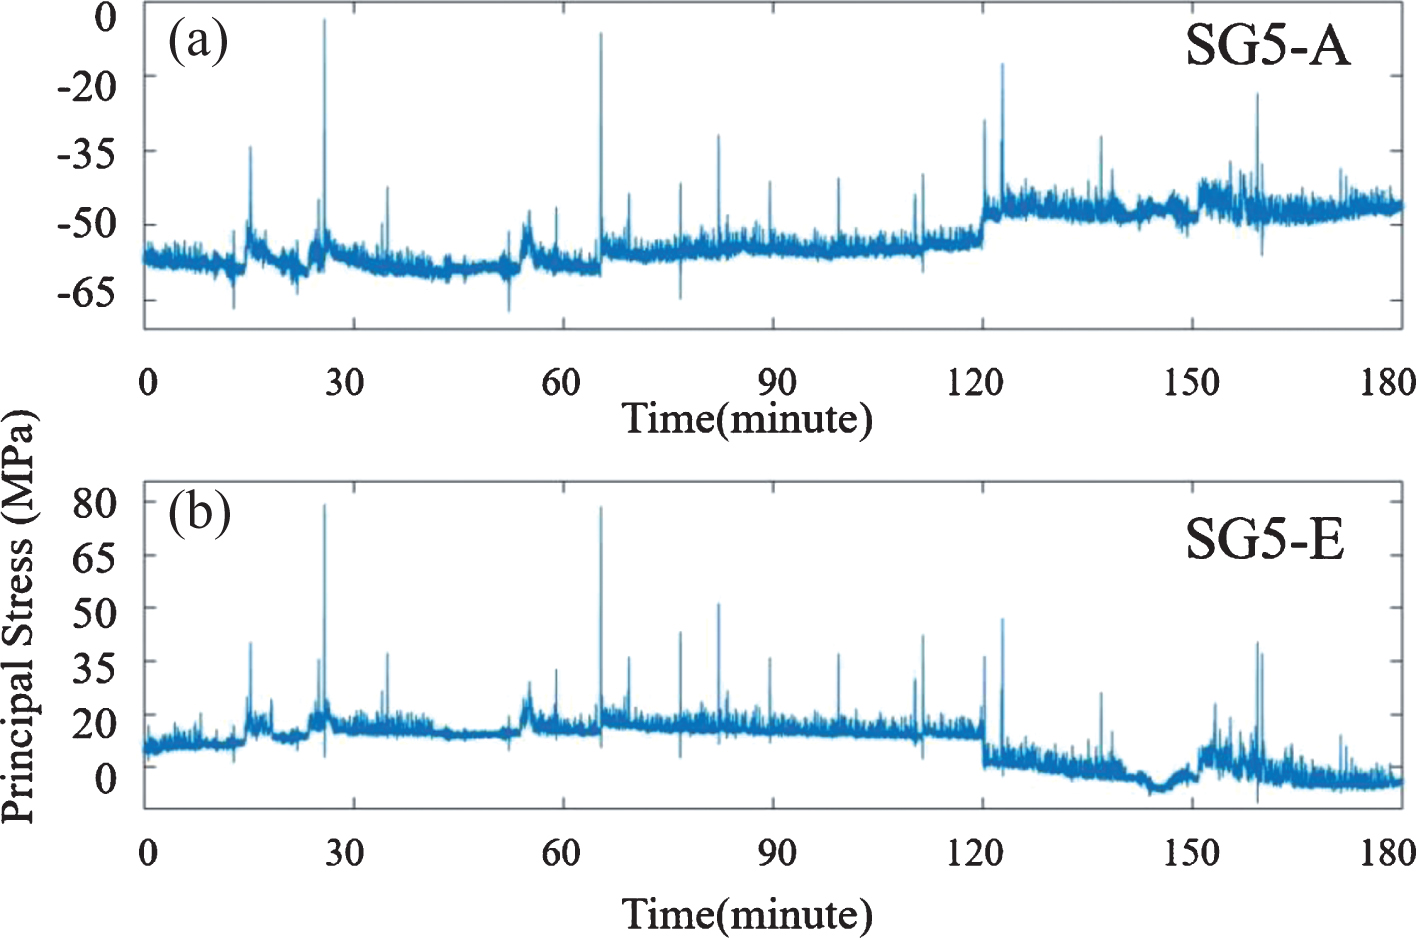
Examples of time-history responses (a) SG5-A, (b) SG5-E.
Recoded stress ranges and the measured fatigue response over a year
In this study the hotspot stresses are achieved through the application of a well-defined SCF multiplied by the field collected data. The numerical model is applied to determine the SCF. The variability of the SCFs due to the complex geometry of the weld and the variability of the loading conditions, is investigated in this study.
The static loading
For the longitudinally welded connections, less variability of the hotspot stresses and the resulting SCF along the weld toe can be observed. For the curved weld of the current study, the complex geometry of the weld can induce disparity between the hot-spot stress responses along the weld toe. Also, the geometry can influence on the rate of dissipation of stress response with the distance to the weld toe. In this section, six different paths that are perpendicular to the weld toe and have the specified locations of the reference points, are selected to study the variation of the measured hot-spot stresses along the weld toe, as shown in Fig. 10.
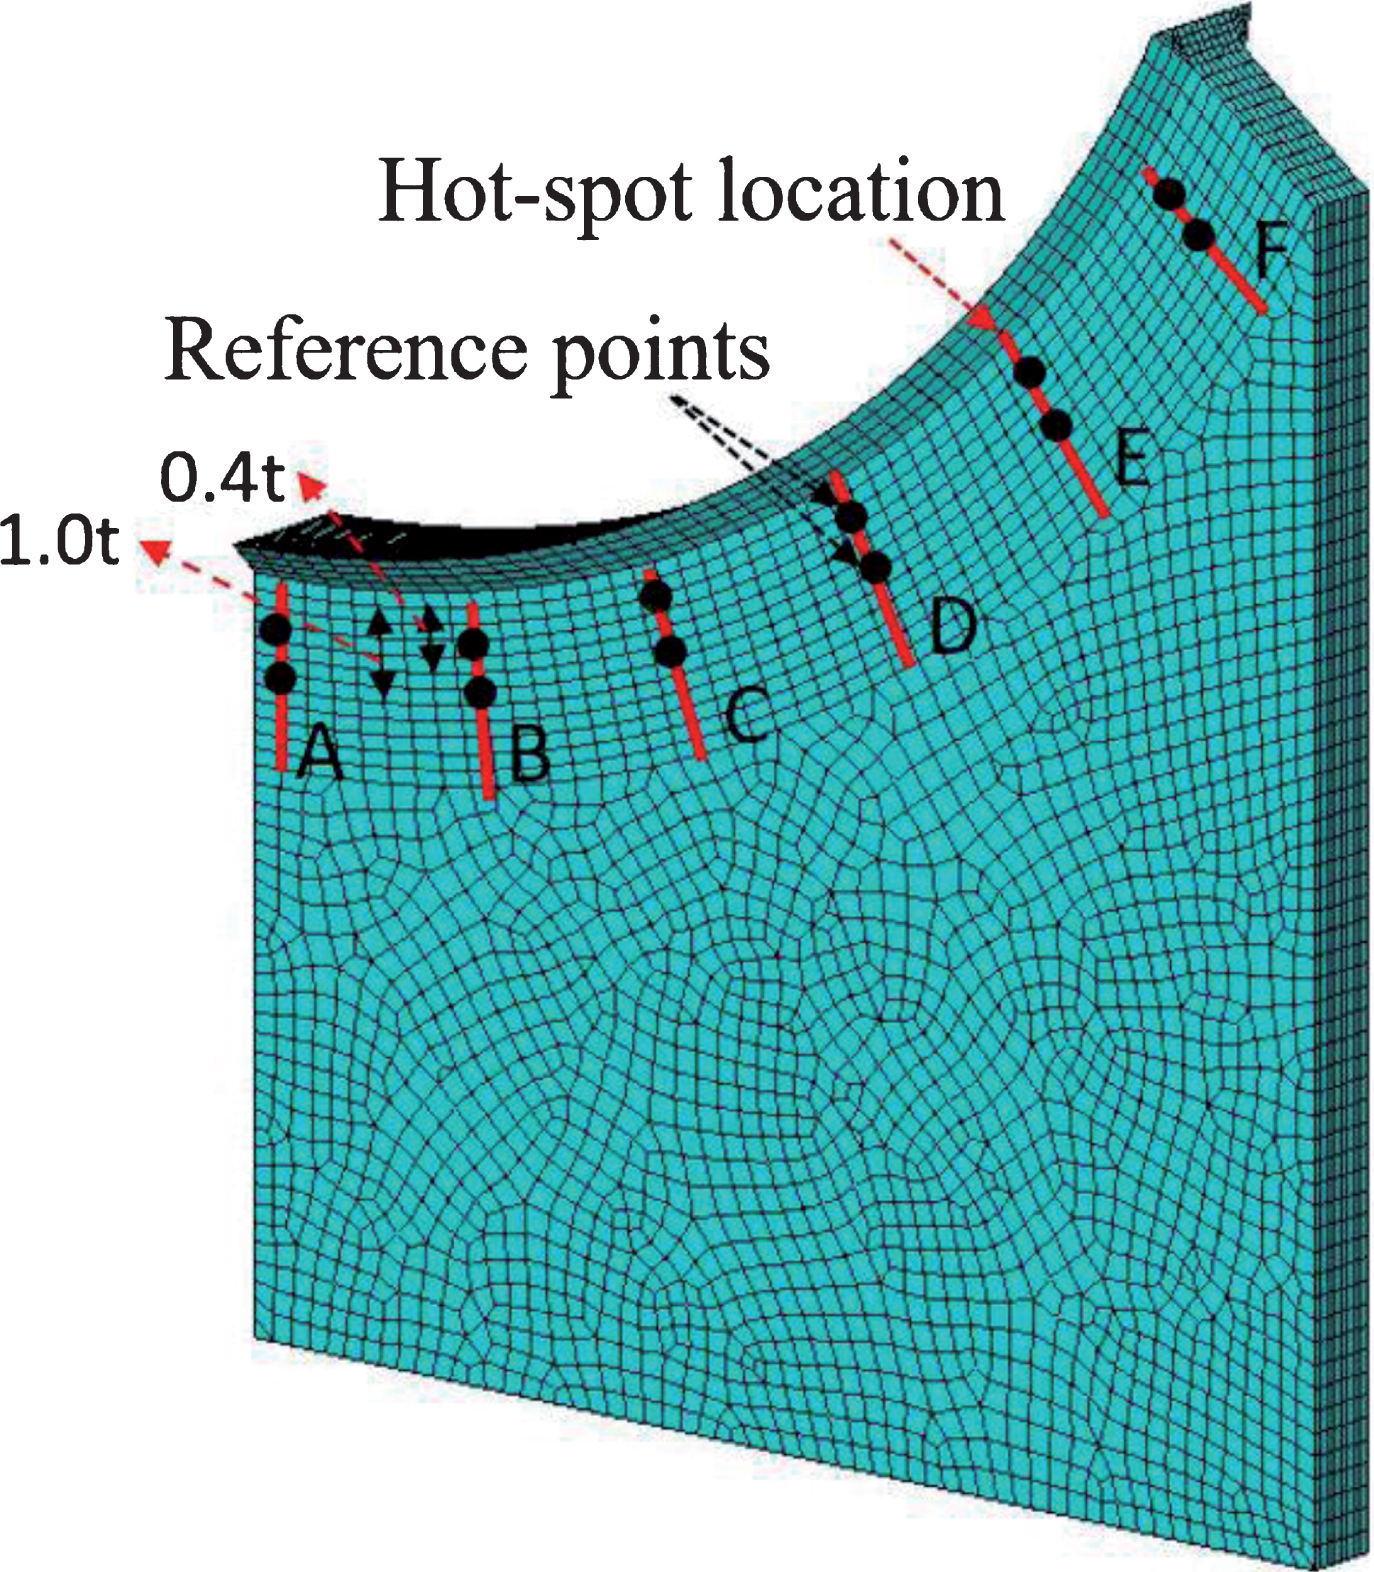
The selected paths along the curved weld toe for hot-spot stress measurements.
The decreasing trend of the strain response versus the distance to the weld toe for the six investigating paths are provided for two different load cases, shown in Fig. 11. The load cases are the second stop of the truck (during the load test) at the northbound and the southbound, respectively. Considerable agreement between the trends of the paths for the two loading conditions can be observed. However, the rate of stress reduction between the different paths along the weld toe is not identical. In addition, the path F, has a different strain variation as compared to the other paths for the two different loading cases. The path F that is closer to the diagonal as compared to the other paths, displays a different trend as compared to the other paths. It is investigated that this path can be more influenced by the transferred loads from the diagonal member than the bottom chord.
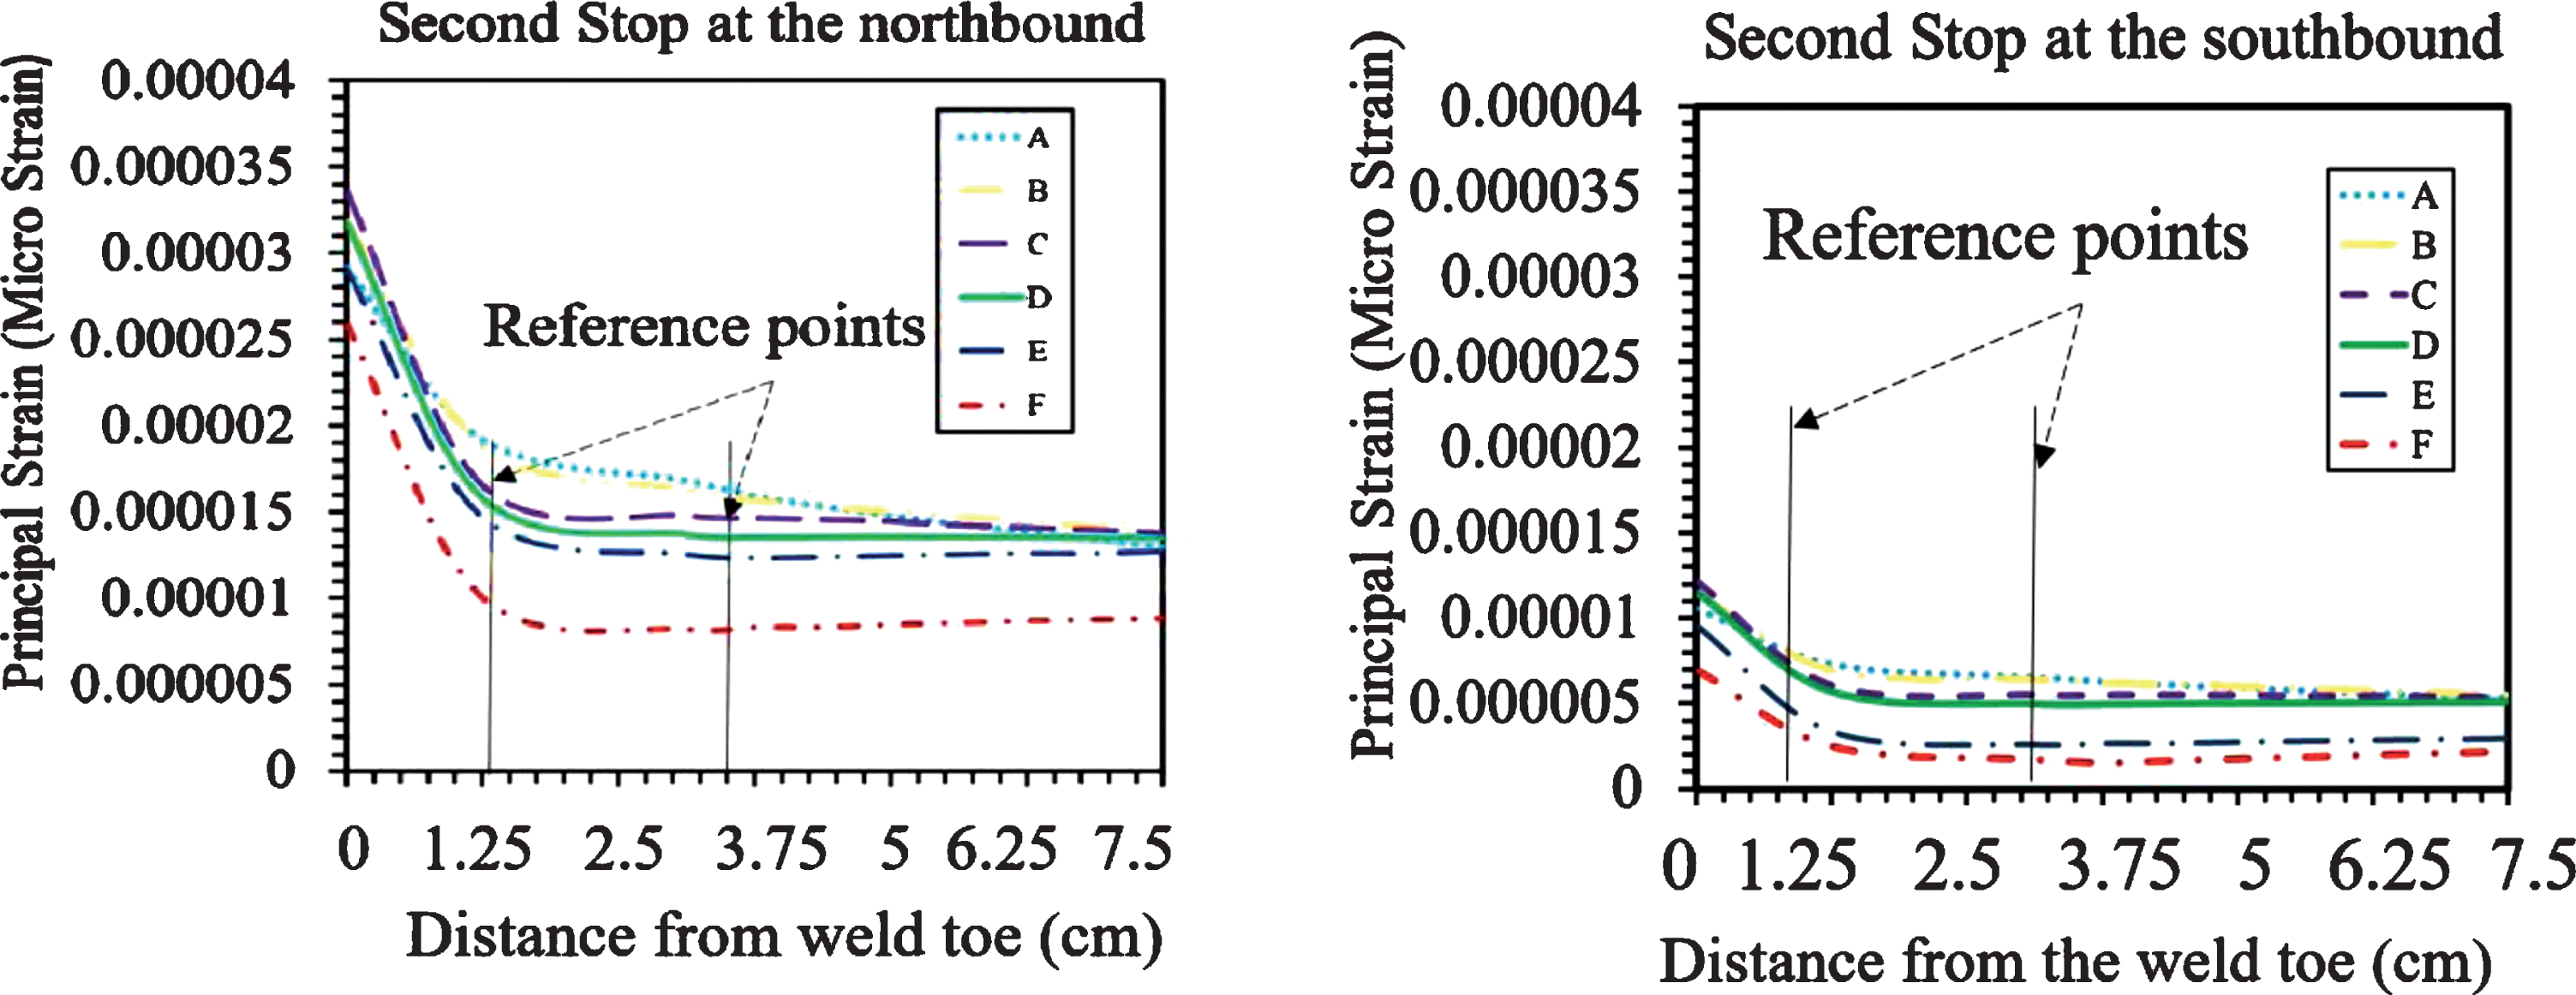
The strain variation with the distance from the weld toe under the static truck load at the northbound (left) and southbound (right).
The acquired results in Fig. 11 for the northbound and the southbound truck loads are applied to determine the SCFs for the investigating paths. In Fig. 12, for each path, the SCF ratios are measured for the two loading conditions, expressed as the north and south. It can be demonstrated that the larger induced stresses by the northbound truck loads, proportionally results in higher SCFs, as compared to the southbound loading condition. In addition, for the path B, the maximum SCF is acquired. The SCF responses for the paths C, D, and E, are similar, as previously indicted in Fig. 11. Consequently, for fatigue assessment of the connection, maximum, minimum or the average SCFs can be selected to be applied to the field collected nominal responses of the investigating strain rosette.

SCF under the static truck load at the northbound and southbound.
It is observed that for the variable amplitude traffic loads and the induced strain responses, the SCF can change regarding the loading conditions. It this section, the variations of the SCFs along the weld toe is investigated under the dynamic moving load. For the dynamic loading, the SCFs- are measured as the ratio of the hot-spot strain range to the nominal strain ranges for each path. The stress ranges are achieved through the numerical time-history stress response of the model at the desired locations. The time-history results of the global model to the substructure is transferred as multiple static loads, through a small step procedure. In Fig. 13, the SCF results for the dynamic truck load travelling at the northbound and the south bound, are shown. Compared to Fig. 12, it is illustrated that the variations of the results along the weld toe follows a similar trend for the northbound and southbound with a negligible difference. Consequently, the SCF results, achieved from dynamic loading, are multiplied to the nominal stresses for hot-spot fatigue assessment purpose.

SCF under the dynamic truck load at the northbound and southbound.
To measure the nominal and hot-spot fatigue response at the six investigating paths, the nominal and hot-spot stress ranges must be determined, respectively. For the six investigating paths, the acquired numerical hot-spot and nominal stress ranges under truck-moving load at the northbound and southbound of the bridge are expressed in Table 3. In addition, for the six investigating paths, the SCFs are measured for the two loading conditions. It can be observed that for the two considering loading conditions, the SCF results follow the same trend along the weld toe. The measured SCFs for the northbound are about ten percent higher than the SCFs responses for the southbound truck loads.
Hot-spot and nominal stress variations for six paths along the weld toe
Hot-spot and nominal stress variations for six paths along the weld toe
It can be concluded that the achieved SCF responses are more dependent on the geometry of the curved weld. For the curved welds, the trend of the SCFs along the weld toe can be dependent on the radius of the curve. Consequently, for hot-spot fatigue assessment using the field collected data, the appropriate SCF for the location of installed strain rosette has to be determined. The SCF can be determined through a perpendicular path, starting from the position of the strain rosette to the weld toe to measure the associated hot-spot stress.
In addition, due to the variability of the SCFs with the changes in the traffic patterns, more comprehensive responses can be achieved by measuring multiple SCF responses under multiple simulated traffic conditions that are experienced at the bridge. The resulting SCFs can be averaged to be applied as a single SCF for the variable amplitude field collected responses. The resulting acquired hot-spot fatigue responses through the averaged SCF can be conservative. Alternatively, a range of SCFs for the location of interest can be defined. Consequently, a range of hot-spot fatigue responses can be provided for the bridge manager to make the decisions about the maintenance program of the bridge. Defining an upper level and lower level fatigue responses can provide a broader view on the fatigue status of the investigating component. In consequence, the bridge manager can make a better decision for the inspection program of the bridge and prevent the excessive cost of unnecessary inspections.
In Table 4, the maximum, minimum and the average values of SCFs for the investigating strain rosette in this study (SG5-A) are determined. The expressed nominal stress response in the table is the average of the field collected principal stress responses for a limited period. The hot-spot stresses are measured by multiplying the nominal stress to the three different SCFs. The acquired fatigue responses are subsequently expressed as the maximum, average and minimum values.
Application of multiple SCFs for fatigue assessment using field collected data
The observed difference in the fatigue responses demonstrates the importance of reporting a range of measured fatigue responses. For the near threshold stress ranges, a slight change in the SCF can result in the prediction of either infinite fatigue life or limited fatigue life. Consequently, it is recommended in fatigue assessment of complex welded components of steel bridges using field data and hot-spot stress method, define a range of possible SCFs.
Novel-designed structural components of steel bridges that are not explicitly included in the documented details of the available fatigue design codes require a comprehensive protocol for the fatigue assessment. The protocol requires a thorough understanding of the local performance of the component under the global loading and boundary conditions of the structural components at the bridge. In this study, fatigue assessment of the novel gusset-less connection at the case study, the Memorial Bridge is investigated. The local performance of the connection under the global loading are provided using the field collected SHM data at the connection as well as an efficient global FE model. In addition, a more detailed information on the local performance of connection is provided through the local sub-structure model of the connection. It is demonstrated that, the numerical global model has a significant impact in determining the SCFs with regard to the global loading conditions. Consequently, in fatigue assessment of the welded structural components of bridges that have a complex loading conditions, it is recommended to determine the SCFs based on the global numerical model. In addition, in fatigue assessment of complex structural components, using the field collected data, it is essential to determine the SCF for the specific location of the data acquisition system. However, the result of this study illustrates the variability of the SCF responses with the changes in loading condition. Application of multiple SCFs acquired through multiple loading conditions can be timely inefficient. It is recommended to determine the dominant loading conditions and the induced stress ranges at the target data acquisition system of the bridge. Consequently, the measured hot-spot fatigue responses are reported as the maximum and minimum fatigue response showing the conservative and non-conservative conditions, respectively. As the future work it is suggested to apply the mathematical model to quantify the SCF responses for multiple loading condition.
Conflict of interest
None to report.