
Abstract
This paper describes a probabilistic approach to estimate the conditional failure probability of the existing bridges in Assam based on the present condition inspected data. The bridges are categorized considering Indian Road Congress (IRC) Bridge Maintenance Inspection manual and National Bridge Inventory System (NBIS), through implementing visual inspection method leading to condition assessment of the bridges available in the study area. Condition rating of the bridges considered mainly concrete decks and diverse roadways such as both rural and highways that helps in analyzing time-in-condition rating, reliability, and hazard function of the deck components. The Anderson-Darling (AD) test was adopted to find the suitable probabilistic models and shown that Weibull distribution becomes the best fit. However, the main importance is given on the maturity of the bridge which helps in evaluating the time-dependent probability of failure. These estimates would help researcher and practicing engineers in carrying out service life in long term analysis for bridge design, maintenance policy, and replacement decision of the study area in a cost-effective plan strategy with appropriate direction or solution in the bridge management system considering safety aspects in the study area.
Keywords
Introduction
Bridge infrastructure is the most vulnerable component in transportation system and may face structural difficulties/volatilities due to maturity, environmental conditions and natural disasters. In general, bridge failure is rare and happens by some unexpected circumstances generated essentially through man-made and natural calamities such as earthquake, flood and fire. However, it is also known fact that aging of in-service bridges becomes directly responsible for deterioration that makes these bridges more susceptible in failure or collapse. Alternatively, there are also other factors such as traffic load, increase in population/number of vehicles, and construction process defects. However, it is broadly recognized that social and economic growth in any area depends on the satisfactory performance of the transportation networks. The bridge infrastructure management evolved as a future predictor about the physical condition of bridge and finding key information about the reliability parameter of bridge components during its service life for smooth functioning and providing comfort to the passengers. Abundant number of research or studies carried out on the topic of deterministic and probabilistic mathematical models that result into condition prediction about the bridge deterioration. The bridge deterioration process contains immense uncertainties which specify that the probabilistic models are more realistic to capture the actual deterioration mechanism and suggested frequently in use. In recent years, the domain of probabilistic modelling is being used in finding the reliability of bridge deterioration by knowing the condition state as well as condition rating through various probabilistic distributions by several researchers.
[1] and [2] used probabilistic approach and evaluated condition states of bridges as well as damages with the help of Weibull distribution parameters. Indeed, a common probabilistic model, such as Markov series model is based on the concept of exponential distribution for several times in the case of a particular bridge state. Markovian modelling is a conditional state-based approach, and assessed from condition states and used to expect future conditions of bridges. Indeed, [3] considered serviceability features of bridge deck reliability by estimating long term deflection and corrosion-induced in deck deflections because of loading effects. [4] used the Markovian approach to unearth the transition probabilities from condition dataset; [5] used an expectation for maximization algorithm to estimate the probabilities to evaluate bridge failure in Serbia; [6] in their research, illustrated bridge deterioration pattern by using Weibull probabilistic distribution on the condition rating of in-service bridge over a particular period of time in the state of Florida. [7] reported their results based on the spatial time-dependent reliability study combining with visual inspection in order to forecast the likelihood of RC corrosion-instigating cracking. However, [8] estimated inspection intervals for bridges of the Oregon (United States) by using 20 years’ period of condition rating historical data with the help of statistical analysis and Weibull distribution approach, which leads to predict time-in-condition rating with probability of failure. Several other researches also presented considering mathematical modelling of bridge damage using failure lifetime and probabilistic distribution in bridge safety ([9, 30]). In many countries, in-service bridge conditions being inspected and evaluated individually essentially for the purpose of maintenance and safety. The probabilistic analysis and approach resulted to be immensely useful in calculating the deterioration and hazard characteristics of infrastructure. The bridge deck reliability assessment when handled in accurate manner could help to reduce the costs and increase effectiveness of deck maintenance and repair strategies [16, 29]. The assessment of bridge damage using probabilistic approach seen to be applied in countries such as Florida, Oregon, Serbia and Pennsylvania. This type of applications is lacking in India, therefore, such type of research is essential to monitor the health condition of in-service bridges surviving since many years.
In this paper, the probabilistic approach adopted to evaluate the reliability of in-service bridge decks considering the reliability function as well as hazard rate function by using the condition states and condition rating (CR) of the existing bridges taking into account in finding maturity of bridges and failure times considering their design life. However, bridge inspection procedure in United States carried out by experienced bridge inspectors assigned on regions selected and using the NBIS incorporated in Federal Highway Administration (FHWA-2005) or following appropriate condition assessment methods. In India, IRC: SP:52-1999) [11], and it’s Bridge Inspectors Reference Manual using this as a basic guiding principle in inspection and maintenance of bridges to organize inspection reports about bridge condition and take immediate action.
In order to merge/modify the bridge inspection manual considering both Indian road standard such as IRC and NBIS (FHWA) combined together to form a new format/guidelines that would helps in making inspection reports of bridges available in the region convincingly better and could be categorized in a more practicable sense into their condition states. However, after the combination of reference manuals, the condition of in-service bridges and their maturity level extracted. In this study, the visual inspection process is taken as the principle method (similar to NBIS), though the accuracy rates of the bridge safety becomes reasonable considering the visual inspection and their overall resulting condition states. However, the initial deterioration in deck component of bridges could be visually analyzed, with taking into consideration that no such studies have been carried out in this region. It would be the first step study by adopting visual inspection procedure that becomes well accepted at present by other countries. They arrived with the need of a model for forecasting performance of deteriorating bridge deck correlating with condition states and the duration (ages) of bridges. To establish the model for future conditions, the probability distribution fitting is used, and reliability theory model could be articulated, and analyzed to know about deck damage outlines in the study region.
The finding of this study would benefit to the Indian bridge management system (IBMS) and system health monitoring for the state of Assam. Indeed, bridge is very well-known important assets or structure and the study would provide the knowledge about the current scenario of the existing bridges in the region and its deck component status qualitatively and quantitatively. The time-based modelling as well as probabilistic approach would help in predicting the bridge deck deterioration juncture or bridge deck failure phase. Indeed, evaluation of bridge deck reliability and hazard functions would helps interpreting of in-service bridge and their damage pattern along with the reliability and future damage or failures in upcoming years. The above objectives would be very efficient for the bridge inspectors or the engineers in the region to take appropriate decision regarding the health monitoring process of these existing bridges.
Study area
Considering the current scenarios of India, several bridges that have been built decades ago becomes in damaged state considering their strength, durability and stiffness due to various reasons or factors. However, these bridges are built and designed for dead and live loads considering serviceable condition which seems to be severely changing with time and going through various levels of damage conditions due to problems such as increased traffic population with the passage of time leads to increment of the axle loads. Considering this as an opportunity created for the bridge management staff to implement condition assessment method by finding severity and strength of bridge deck, essentially to determine the actual residual structural strength which would help in knowing bridge safety and status. Indeed, considering the selection of study location (Assam), and according to the Indian government policy, the North-Eastern states of India would be very influential for connectivity purpose with other neighbouring South Asian countries such as China, Burma, South and North Korea, Taiwan, Malaysia, Indonesia, Singapore and Bangladesh via surface transportation network and would be vital in future growth of the country. Therefore, the necessity of bridge management and improvement arises which would result in knowing the condition states of the existing bridges in the location and make the region with lower risk for sudden collapse, uninterrupted and effortless transportation system that provides ease of bridge networking.
However, considering Assam, which becomes one of the important states in the north-eastern India, popularly known for the wildlife, archaeological sites and tea plantations. In the state of Assam, there are a number of old bridges built since the pre (British rule) and post-independence, the important existing bridges such as Saraighat bridges (long span) in Assam, Sadarghat Bridge in (Cachar district) Assam, large number of old Railway bridges (steel) constructed under NF Railways since British time, Pre-stressed bridges built by Border Road Organization (BRO) and Central Public Works Dept (CPWD). All these bridges are leisurely getting degraded due to improper maintenances and irregular inspection for a long time. Further, Assam has 32 districts and it accounts for about 60% of the total road length in the North-East India. However, the Cachar and Hailakandi, are the two districts in Assam emerging population state (increased traffic density) and connecting to national highways such as NH 53, NH 44, and NH 54. These two districts are taken as the study area, however, RC bridges exist at present in the study area are more than 140 in numbers (constructed since 1985–2018) excluding different types of bridges (steel, wooden and pre-stressed concrete). Conversely, in this paper the main aim is to examine and evaluate the deck condition status of the existing bridges through physical inspection, particularly RC Bridges constructed in bulk quantity in and around the study region (Fig. 1).
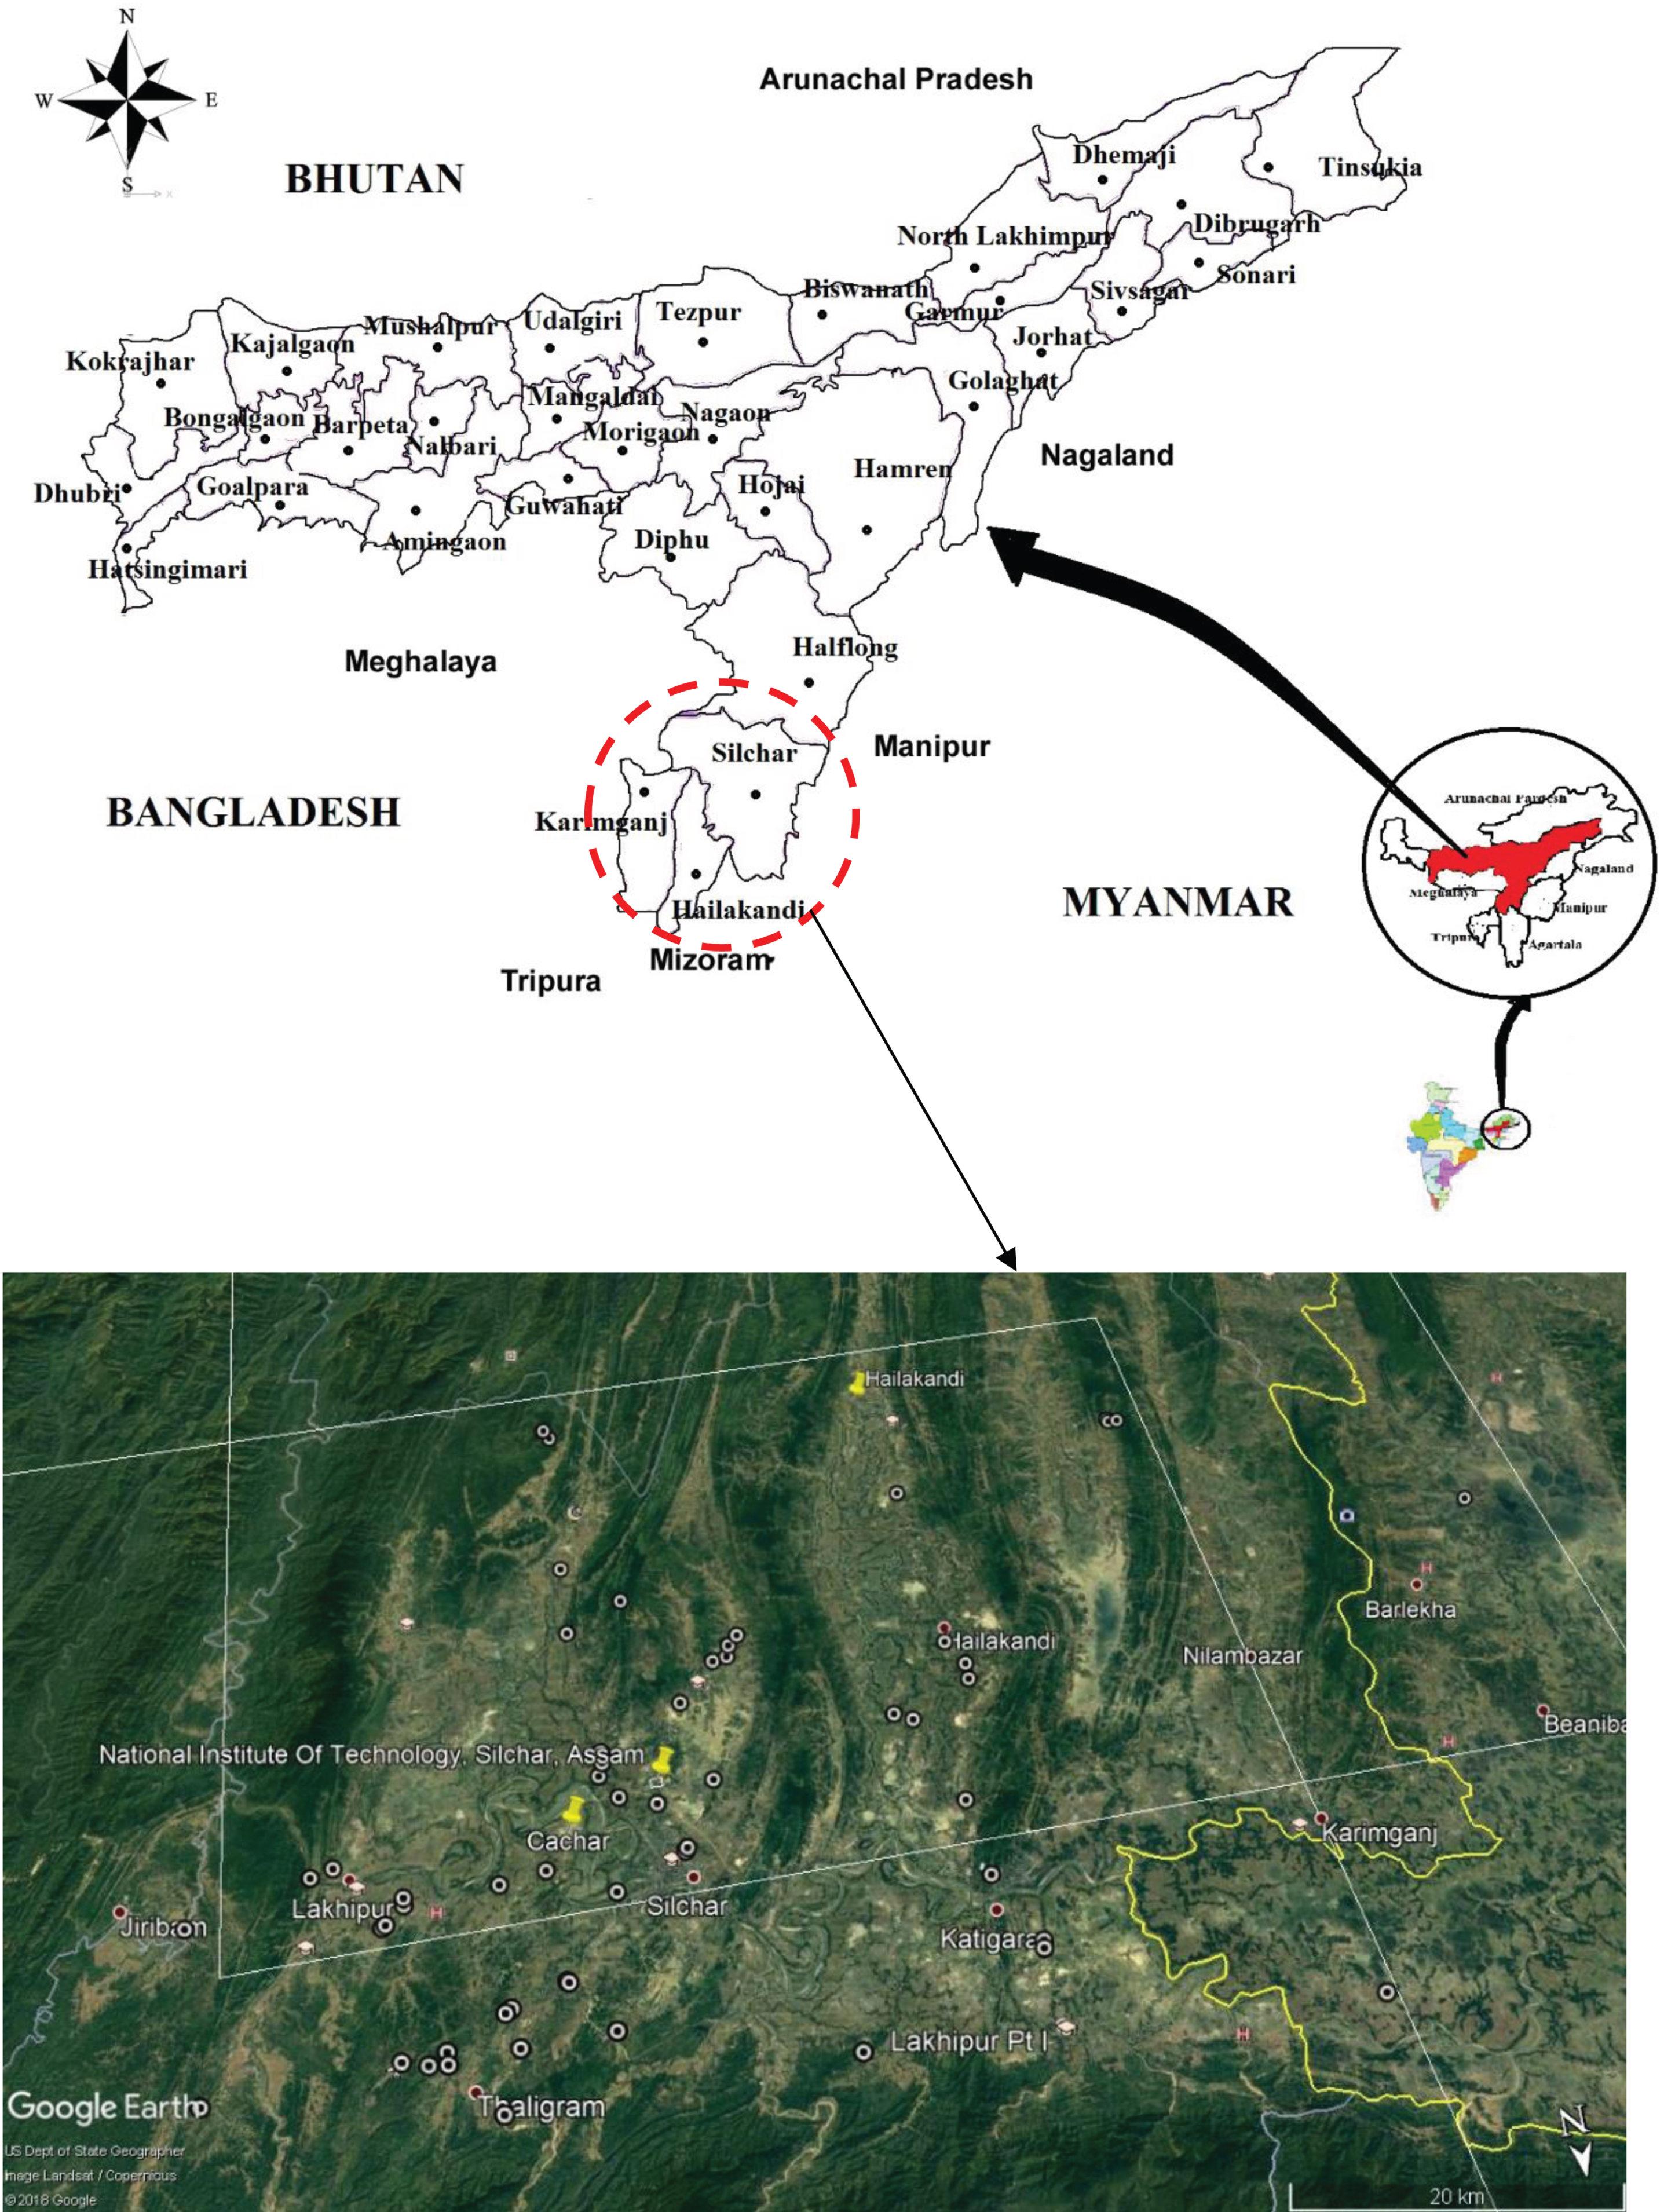
Location of the bridges available in the districts (source: Google Map).
In order to evaluate the reliability and hazard function with the condition dataset, the probabilistic approach has been implemented, indeed, a time-based model is developed using the knowledge obtained from the literature and the experts who have previously worked on such projects. The modelling based on continuous-time models for bridge deck damage condition shows that the time consumed by the bridge is important indicating that maturity (age) of the in-service bridge becomes the primary factor for each state of deterioration. Indeed, it is a theoretical based idea where the failure or damage described for the element of a structure becomes similarly connected to the industries that manufacture aeronautics items. However, assuming T is a positive and continuous random variable representing the failure time of a structure or an element, and therefore cumulative probability distribution (CDF), denoted by F (t) which could be given as:
Cumulative probability distribution, F (t) links to the term probability distribution functions denoted as f (t) used to define a particular probability distribution (PDF) given as:
Similarly, reliability could be illustrated as an item or a system which might work properly as required without malfunction under specified conditions for a specified period of time. The reliability (survivor) function could be denoted as S (t) in terms of the cumulative distribution which is given as:
The parameters of reliability (survivor) function could be very useful in the estimation of the system or structural health monitoring of bridge elements. Alternatively, considering/assuming the situation that bridges have not been gone through any major repairing process. However, taking ‘T’ is the maturity (age) of a bridge at which its range reaches the specified threshold condition could be taken as the “failed” condition, then F (t) is the probability that the bridge would attain this condition state by age t. For instance, consider F (t) time (in years) could be assumed when 20% of the bridges remain in the failure/deteriorated state. On the contrary, reliability or survival function S (t) is taken into account and used for evaluating the percentage of the bridge inventory (bridge component records) that would not fail in time t. This could be explained by taking an example, such as if the reliability of a system found to be 0.45 at 30 years of service which means that 45% of the bridge inventory would function in a satisfactory condition state, implication that it would not leave the condition defined as the threshold condition before 30 years of service. After 30 years, it could be said that reliability of 0.45 is the worth of the bridge inventory, which also means that without major repair after 30 years of damage, the bridge would have 45% (approx.) worth of its initial strength value. At time t = ∞ , S (t) = S (∞) = 0, as time (age) goes to infinity, hence, the surviving function/curve goes to zero.
Indeed, a hazard function could be well-defined as the function of the failure rate which changes the provisional predictions of failure. This instant failure or deviation rate has a fixed or specific time, the inventory of the bridge determined only by those bridges, which have not failed at that instant. For this reason, it is a conditional/provisional failure rate, for example, given some of the elements of existing population in a certain past time. Alternatively, hazard function is denoted by h (t) expressed as:
The consequence of maturity of the bridge on the deterioration of the bridge decks shown better by hazard function that cumulative probability function F (t) or probability distribution function f (t) could be expressed as:
Considering that there has been no repair for a long time, and bridge inventory has a rate of hazard say 0.5 after 50 years of the service life, represents that if the deterioration of bridges happens at this momentary rate up to 50-years, the frequency of bridges becomes (0.5 = 1/2), which implies one bridge would reach threshold condition state every 2 years subsequently. There is another parameter which is related to hazard function, such as cumulative hazard function or cumulative failure rate, denoted by H (t), given as:
However, the various functions such as CDF, PDF, survival and hazards relationships could be achieved based on the earlier given parameters as:
Here, H (t) represents the parameter which consider as the “accumulation of hazards over a precise time”. The parameter helps in computing average hazard rate of a structure or a system over a time or interval of time (assuming the time interval T1 and T2). It is denoted by AHR (T1 and T2), and used in finding average of population hazard rate within that time limit (NIST/SEMATECH 2007) [12] could be given as:
Now, if emphasis is on the time when bridge is constructed or time of origin then, T1 = O, and then equation for average hazard rate could be expressed in simplified version as:
Bridge deterioration models could be of different types such as deterministic, probabilistic and artificial Intelligence (AI). Many researchers used above methods to analyse damage and failure rate by using inspection data. However, it has been reported that probabilistic model becomes better than deterministic, because deterministic techniques helps in predicting short term conditions without accounting uncertainty and unable to predict the behaviour of structure that undergone with repair and may not give accurate reliability assessment with confidence. Alternatively, AI has disadvantages that it needs more dataset to standardize and also mathematical model related to AI becomes difficult to explain when it comes to input, output and knowledge procedure. In probabilistic distributions, there are many common distributions used for modelling deterioration mechanism or failure times such as normal, exponential, lognormal and Weibull distributions. For selecting the suitable distribution for the given type of dataset, goodness of fit test is necessary.
However, in determination of the distribution that fits the data best, the test statistics summarized briefly have been investigated using the present condition rating (CR) dataset extracted as per NBIS procedure from the study region. The goodness of fit tests is to measure the ‘distance’ between the data and the distribution that are used for testing, and comparing the distance to some threshold value. If the distance (known as the test statistic) is less than the threshold value (the critical value), the fit is considered/accepted as good. The reason of various goodness of fit tests such as Kolmogorov-Smirnov, Anderson-Darling and Chi-Squared tests is the alike, nevertheless, they differ in how the test statistics and critical values are intended. The critical values depend on the sample size and the significance level chosen. The significance level is the probability of rejecting a fitted distribution when it is actually a good fit. The significance level is indicated by the Greek letter α (alpha), and the most commonly used level is 0.05 or confidence interval (CI) becomes equal to (1- α) = 95%.
There are several literatures where these distributions are very well described and defined; these are discussed in a brief manner. The Weibull probability distribution is defined mathematically as follows [18]:
Where, t = time during bridge deck has a particular condition rating (CR); β= shape parameter; θ= scale parameter; δ= location parameter.
The Weibull distribution is a continuous probability distribution that helps in predicting the reliability of a system, further, it could also analyse the life time data helping in failure modelling of a system. The main advantage of using Weibull analysis is that it could be used with a very small sample for lifetime analysis. Depending upon the value of β, the Weibull distribution function could take different form/shape of the distributions. If β < 1 in that case, it gives a Gamma distribution; if β = 1 suggests an exponential distribution; if β = 2 then it develops a lognormal distribution; and if β > 3 it gives a Normal distribution (approximately). Because of the shape parameter of Weibull function model, it has its freedom of a widespread series of failure rates. It was originally anticipated to determine the amount and size of fatigue data, nevertheless it also used to study the time in occurrence in the “weak link” systems. The Weibull distribution function and the failure time characteristics could be defined by using the earlier used notation of reliability functions as:
Further, the lognormal distribution is a probability distribution that normally distributed logarithmically. The lognormal distribution is suitable for different failure degradation methods which include corrosion in bridge deck, cracking in deck, and rupture in bridges indicating and related to failure of a system due to chemical processes. It also used in estimating the property of the bridge material behaviour under various loads condition ([13]). Further, the exponential distribution becomes commonly and widely used distribution for the purpose of testing the reliability of a product but it mainly relates with the description of time between the events. It also used in failure model of time in different electronic and electrical products as well as other applications, however it becomes better in working when the failure occurs randomly without depending on the maturity or age as follows:
For t ≥ 0, then
Probability distribution function,
Cumulative distribution function,
The mathematical function of hazard or hazard rate for the exponential distribution becomes predictable as a constant in the middle age, that is:
It could be concluded that hazard rate shows independency with the maturity of the structure or an item (age). The cumulative hazard function could be expressed as:
In the reliability engineering, when hazard rate or hazard function or failure rate is described, the topic which essentially used to arise first becomes the “bathtub curve” shown in Fig. 2. The “bathtub” curve describes a certain type of hazard rate which has three types of deterioration/failure phases or situations (as shown in Fig. 3). The first phase is due to early failure (decreasing failure rate) also called “infant mortality phase”. The second phase is due to random failure (constant failure rate). And the third phase is due to wear-out failure (increasing failure rate) and that becomes the phase of failure where hazard rate tends to increase with increase in time (aging effects), that is, the state of damage increases with time. Further, the “bathtub” curve has a hazard rate pattern which essentially seen in human death. The human death also has infancy term, useful life term and wear-out term. It is observed that during childbirth many deaths (hazard) occurs as the time passes/extends, the death rate (hazard rate) decreases abruptly at early age, and during the human middle age life, the rate remains constant mostly or death becomes independent of time or ages. Alternatively, when the rate is constant, the death (hazard) happens random in nature and not related or depending on the age of the human. Indeed, when the life continues and old age comes to act, the death rate (hazard rate) increases with time (age) and there is a sudden rise in hazard rate. So, it means that human death is suitably related to “bathtub” curve theory. Indeed, in the bridge structure system, the case is not exactly similar, as there is no “infant mortality” phase in the bridges. When bridge is constructed (initial at its service life) there are few chances of bridge failure. The “wearing out” phase is present which could be considered from the “bathtub” curve. In the bridge deterioration process, the “infancy” phase is short term and it might be absent and the “wear-out” phase could be seen starting early, because of the corrosion, cracks, and other failures coming to act.
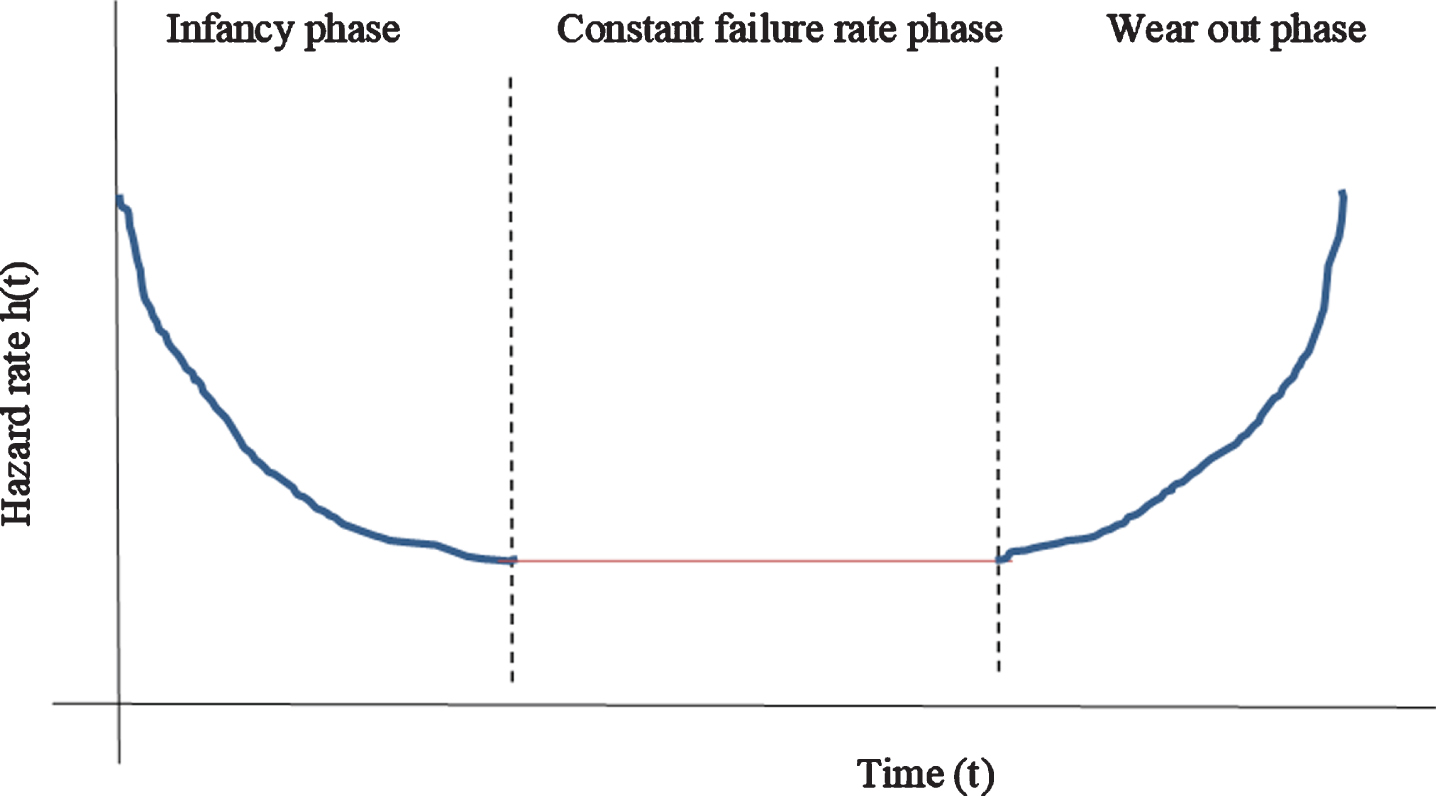
Typical “BATHTUB” model showing different phases of failure.
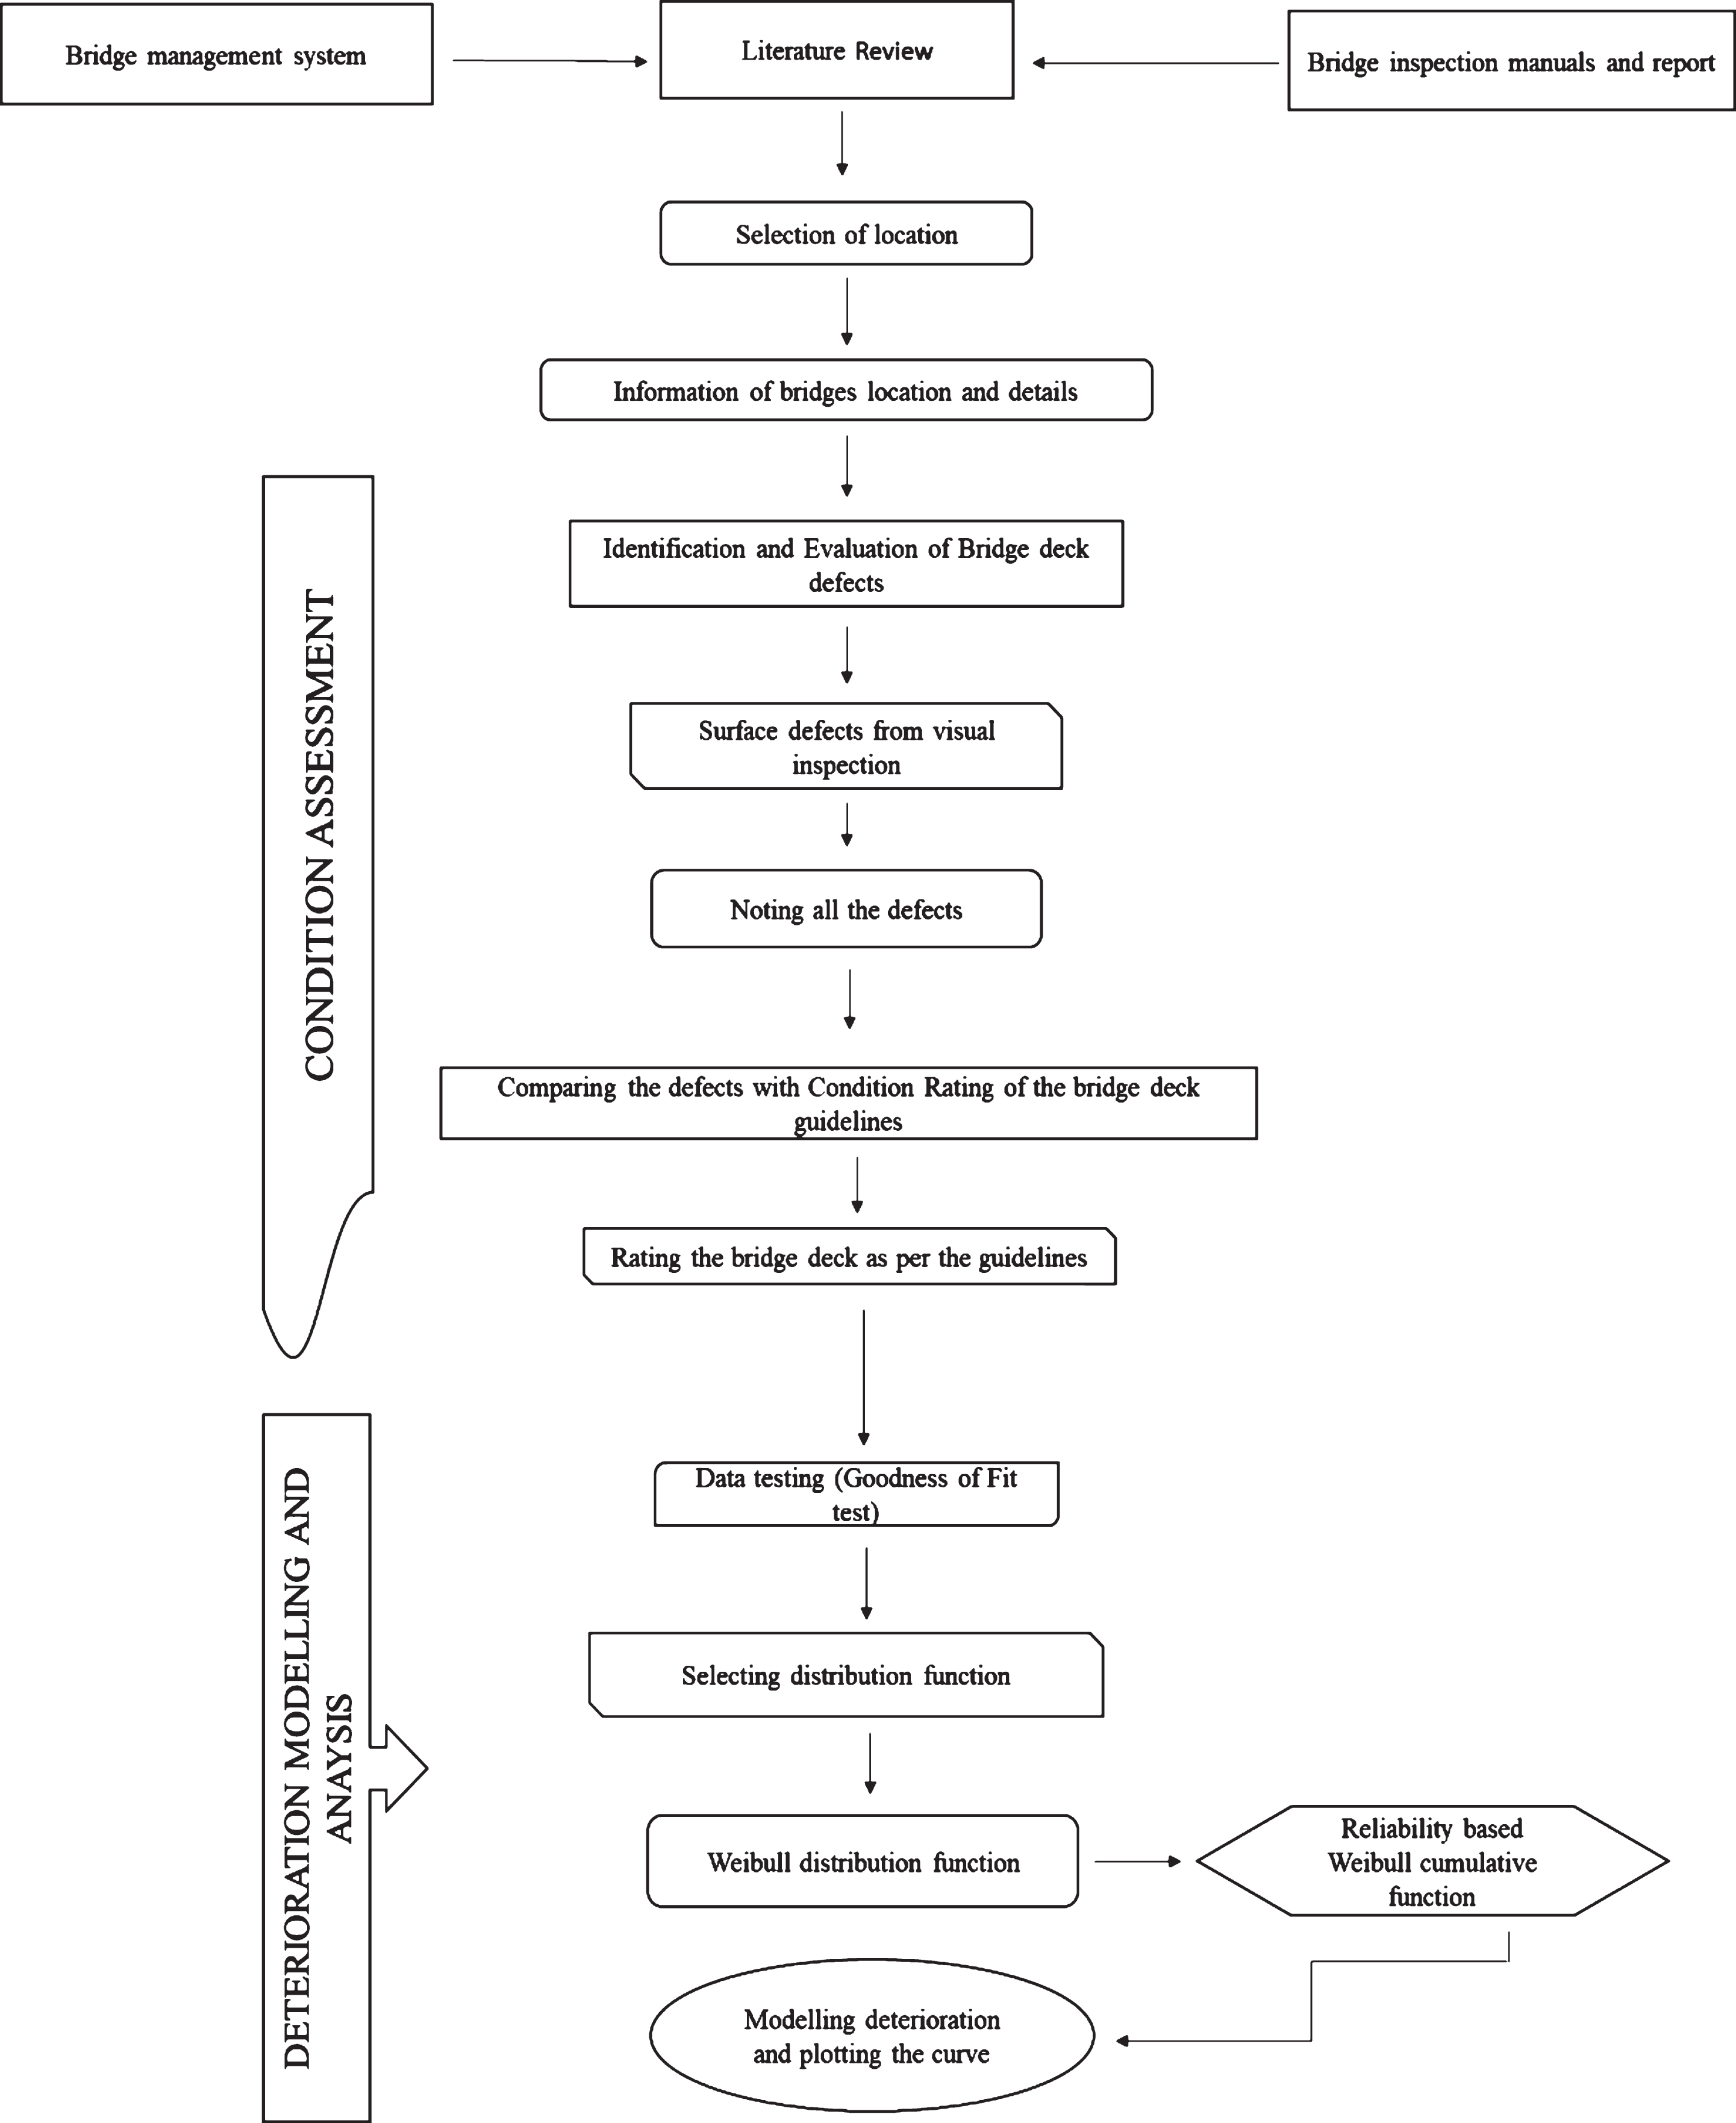
Schematic diagram of the methodology which is proposed here.
Alternatively, in the bridge reliability system, the expected failure rate or expected hazard rate should be mainly related to “wearing out” phase. Now, the issue appears that “bathtub” curve and hazard rate function becomes related with parameter that could be estimated with the suitable probability distribution. The Weibull probability distribution which would be supported by goodness of fit test having shape parameter, β, this would help in relating the curve and hazard rate. Further, from standard bathtub curve, it has been observed that, β < 1 indicates infant mortality; for random failures or constant failure rate β = 1; β > 1 specifies the wear-out phase (Abernethy for Weibull plots, 1996 [14]). Moreover, 1 < β < 4 it means that early wearing out phase has started and β > 4 meaning that old age or rapid wearing out phase becomes underway.
The bridge condition data and condition states are followed by the guidelines given in the Bridge Inspectors Reference Manual (IRC: SP:52-1999) [11], Manual for Highway Bridge Maintenance Inspection (IRC: SP:18-1996) [15], Bridge Inspector’s Reference Manual (FHWA:2012) and National Bridge Inspection Standards (FHWA: 2004). The proposed approach is the data of bridges restricted to bridge decks only. The condition report for the bridge deck formed after the inspection of bridge decks. The data collection procedures have many steps (Fig. 3). Firstly, estimate the number of bridges present in the study area selected, by the help of the Government agencies such as PWD of the selected Cachar and Hailakandi districts, in Assam. Secondly, visiting the location of respective bridges and assessing defects and damages using the modified condition assessment method (NBIS) proposed. Thirdly, noting down defects and configuring condition report referring the IRC manual and NBIS format which results finally the bridge CR.
Accordingly, the information of the bridges such as the location, types, name of bridges, length and width of bridges and year of construction completed, collected and noted in IRC format. There are different types of bridges such as box string girder types, RCC slab, PSC box girder, and RCC Pmt Bridge. The information is gathered from the HQ, Govt of Assam PWD of the selected districts recorded and maintained as dataset in tabulation form. Now, in second part, the inspection of identified bridges conducted visually as per NBIS guidelines. The visual inspection is a dynamic process while evaluating the condition of bridges; it shows an innermost character in preparation of the superior maintenance works. Indeed, during the inspection, it is observed that numerous weaknesses occur during life span of all structures, and hence they have to be improved and kept in good condition. Bridge condition, such as its degradation level must be determined, and then it’s additional life could be expected and appropriate maintenance activities might be proposed. Most decisions established on evaluation of bridge maintenance that essentially based on visual inspection conducted with the help of trained engineers, bridge inspector, methods and aids defined by bridge management system. However, in order to accurately measure bridge damage and faults, many countries have established special utilities related to bridge reviews, such as manuals, guidelines and calculation procedures. The notifying and visual inspection of states and condition of the bridge performed as well as contents of damage recorded. The recorded damage is taken for consideration and referred as per the NBIS guidelines, IRC and FHWA references. Indeed, mostly this (data analysis) section provides the idea about the quantitative and qualitative situation of bridge deck in the districts and this would provide preparatory work of modelling of the reliability and failure or hazard function.
However, considering IRC guidelines (both inspection manual and bridge maintenance manual) helps with the basic nature of inspection procedure, that allows to tabulate the bridge location alongwith smaller details (length and width of bridge, type of bridge, type of bridge deck, and year of construction) and it gives the idea about the defects which may present in the deck, during inspection. The guideline of IRC also brings the idea about the safety aspects during inspection and noting down the defects and problems observed in the bridge deck, footpath and wearing course surface.
The purpose of the present work is to put forward the probabilistic based approach for finding the reliability and hazard functions of the existing reinforced bridges of Cachar and Hailakandi districts with the NBIS technique/procedure. However, during the analysis of reliability and hazard functions of various CRs of RC bridges, some other significant finding are necessary to establish a proper methodology such as extraction of data from the inspection, suitable method of probability and best fitting probability distribution for the data. Moreover, Indian bridge management system (IBMS) remains outdated and the design code such as Indian road congress (IRC: SP 040 (1993), SP 018 (1996), SP 047 (1998), SP 052 (1999), SP 013 (2004) and SP 74 (2007)) suggests general procedure of inspection and maintenance guidelines and norms, however, it becomes silent about the Condition Rating of the existing bridges. Here in this situation, the auxiliary information is extracted from AASTHO (2001) of FHWA (1995, 2001, 2005 and 2012) and NBIS to fulfil the necessity of rating the bridge deck [20–22, 27]. Some challenges made it difficult to accomplish the objective, such as; in the state and district transportation department (PWD), no such inspection data were available as record. For this reason, the determination of systematic bridge inspection and condition assessment method as per NBIS applied in bridges present in the study area. Finally, concluding the work by determining reliability and hazard function of the bridges with various CRs. Moreover, probabilistic approach demonstrated by the study area would positively benefit the IBMS and structural health monitoring (SHM) sector, including bridge engineers concerned, to overcome the rehabilitation problem connecting to bridge prioritizing and adequate decision-making in upcoming days.
Further, FHWA of USDOT (United States department of transportation) published several guidelines (Table 1) about the highway bridges and reference taken from some of the guidelines which are very updated and useful in all aspects. The guidelines contain the evaluation and techniques of the different inspection method and importantly, this guideline helps in delivering the CR of the components and also the description of the each condition of the component. The NBI (National Bridge Inventory) coding guide has supported the study greatly, indeed according to the NBI code, “CR used to describe the existing, in-place bridge as compared to the as-built condition”. Condition codes gives description of the general condition of the entire deck component. The CR could be known or determined with the help of condition assessment methods and NBIS guidelines. For knowing about damage and defects in the bridge deck, there is a need of accumulation of the information from condition assessment method. In other words, assessing the condition of bridges implies that it is a physical inspection process and the rating of the resources of the road to determine the status of individual properties, road sections, or the overall road network. A condition assessment process involves business process which supports inspection that includes data usage including development of methods using in the process of bridge improvement, inspection methods, quality assurance process and other activities. In maximum circumstances, the only feasible method open to detect faults in a bridge member is visual inspection. It is noteworthy to recognize the faults early in the usual crack-development consequence. If the defect is recognized or identified, the service life of the member often could be reduced by more than larger percent (i.e. 80%). The visual inspection shows the condition of deck surface. The damage of deck surface which could be known visually: Undulation, damage of parapet and reinforcement outrage Potholes and Primary wearing coat damage Spalling and Honey combing Cracking and Abrasion Leaching and delamination
Standard CR System of Bridge [FHWA 2005]
Standard CR System of Bridge [FHWA 2005]
Table 1, is a standard CR for bridge deck which has different CRs according to the level of specified damages (description). Similarly, Table 2, presented the details of extensive/proposed NBIS version with respect to damage observed in visual inspection.
Extensive/proposed modified after combination of NBIS Guidelines for Bridge Deck CR [FHWA 2005] with IRC feasible/applicable for Indian condition
However, N is not applicable which means the bridge is just constructed and not required to inspect. However, CR 9 is an excellent condition which also means no damages observed in deck. Similarly, other CRs are described in a very detailed manner. The number of inspected bridges presents in the study area falling between CR 9 to 5 (Fig. 4).

Number of bridges exists as per the CR in the study area.
The first and foremost objective was to collect the data following NBIS procedure and model the natural damage of the bridge deck selected that has gone through without any maintenance performed. Indeed, with the help of visual inspection techniques specified in NBIS guidelines provides the CR and the age of the bridges recorded/noted. Subsequently, the age and CR of the bridges estimated and assembled in the form of database considering in each condition rating. The estimated data shows the maturity of the bridge and condition state presented in Fig. 4. From the data, it is found that the CR 9 has bridges with age 1–3 years, CR 8 has 4–9 years, CR 7 shows bridges with maturity 11–20 years, CR 6 with 22–25 years and finally CR 5 has bridges of ages between 15–33 years. It shows a pattern and helps in estimating a threshold value where there is transition of CR from higher condition to lower condition, it could be seen that CR 9 bridges tends to move in CR 8 at the 4th year of in-service condition. However, CR 7 tends to move in CR 6 when it reaches at age 22 years. Indeed, CR 5 would go to CR 4 (Poor condition) after it reaches 35 years. The bridges would reach poor condition so rapidly which must be avoided without any further delays. Further, it also gives the idea about how rapidly the damage is occurring and bridge condition states changes within a very limited time (Fig. 5).

Transition age of particular bridges from one CR to other states.
The irregularity observed when data estimation or data assembling was on process that brought a need of filtering. The work consists of duration-based type, the bridge at its initial stage would show CR 9 and with its maturity, it would show lower CR (meaning that with the natural deterioration CR 9, would go on declining its CR relatively to poor condition). However, it is seen that some bridges show higher CR with higher age, which doesn’t fit the model, for example, a 27-years bridge shows its characteristics similar to CR 8; this may give the stipulation that prior repairing is being done in this case. Such bridges were ignored from the dataset, however, the condition assessment completed which leads to data estimation and assembling done eventually and thereafter the process of data analysis performed systematically.
MATLAB, statistical tools are used to accomplish the parameters and the plot for reliability and hazard analysis. The data were analyzed by parametric analysis finding the best fit and suitable probability distributions, producing the survivor function parameters and hazard rate for the bridge deck data with respect to several CRs. The method of maximum likelihood estimation helped in finding the relevant parameters of survivor and hazard function parameters of the suitable probability distributions.
The data set is taken for modelling; in reliability tests the observation essentially becomes important which leads to censoring. Now censoring is of two types such as right-censored observation and left censored observation. There are type I censoring and type II censoring. The data set present here is practically relevant for Type I right-censored observations because the data becomes completely random and there is no fixed time for the occurrence of event. And uncensored process of data is also there which exhibits that dataset formed with complete observation and data taken from beginning condition to end of the worse condition (not happening in our case).
In the probabilistic or statistical analyses, there is an important role to choose/select which distribution becomes best fit for the available dataset. In this study authors have used statistical models such as lognormal, normal and Weibull. However, considering the best fit parameters, it has been found that one model is better than the other that basically depends on the characteristics of such mathematical functions and its best fitting with the observed dataset. Conversely, in analyzing any dataset statistically, the objective is to obtain the parameters and its mathematical functions, however many such functions could be fitted literally, but the aim is to obtain best fit model among all fitting functions to capture the realistic behavior from the available observed dataset for future prediction so that observed and simulated results perfectly matches with certainty or higher accuracy, here data or sample size plays a vital role for selecting such models. Therefore, various statistical tests known as goodness of fit tests showing their significance levels are carried out to select/identify the best fit model. In this study, authors have also conducted such tests. This is the common practice in scientific field that helps to model a physical phenomenon or characteristics of an event occurring in space with time and brings it into analytical form after mathematical modelling, because computation or simulation field fully depends on the mathematical modelling. Further, a probability plot shows how a specific distribution is fit for the dataset. If plotted points are not strongly linear and doesn’t fall close to the line of the distribution, then it is not suitable for data set (Figs. 3 to 5). The commonly used goodness of fit tests in statistics and probability are Chi-square test, Kolmogorov-Smirnov (K-S) test, Anderson-Darling (A-D) test, and Shipiro-Wilk (S-W) test. These have different attributes or characteristics for different data sample and distribution such as Chi-square test is related to discrete model whereas K-S test and A-D test are for a continuous distribution. However, S-W test is a process that signifies if a random sample dataset comes from a normal distribution. Here the present dataset is related to the continuous model distribution, so the choice of goodness of fit test is the Anderson-Darling test. A-D test is a modification of K-S test and it helps in measuring how well the dataset fits a specified distribution. Alternatively, goodness of fit test includes the observation with the help of probability plot and statistical hypothesis test (such as AD test). The AD test statistic measures how well and good the data monitors a particular probability distribution [17]. The AD test shows that the distribution which becomes best fit for the dataset would have smaller values of AD statistics (Table 3). Thus, the probability distribution with the lowest AD values would be the closest and best fitting for the dataset present. Sometimes there is a similar value of AD statistics, and then its decision comes from experience and better judgment, as well as the closest fit of the data chosen.
Anderson-Darling (AD) statistics value for all the condition with different probability distributions
Anderson-Darling (AD) statistics value for all the condition with different probability distributions
In the present study, the testing is done in MATLAB and Minitab [25] that provides similar values, however, considering statistical tools, essentially used for the verification of data as well as results and best fit statistical models based on the data sets identified and considered for further analysis such as Weibull, normal and lognormal. Further, the statistical significance level (α-level) value is taken to be 0.05 as well as p-values also calculated (by the help of MLE method) which helps in finding whether to accept or reject the null hypothesis that data set follows a specified distribution. The null hypothesis is accepted when p-value becomes greater than the significance level (α-level). The selected best fit models such as Weibull, normal and lognormal presented considering dataset extracted shown in Figs. 6, 7 and 8 respectively.
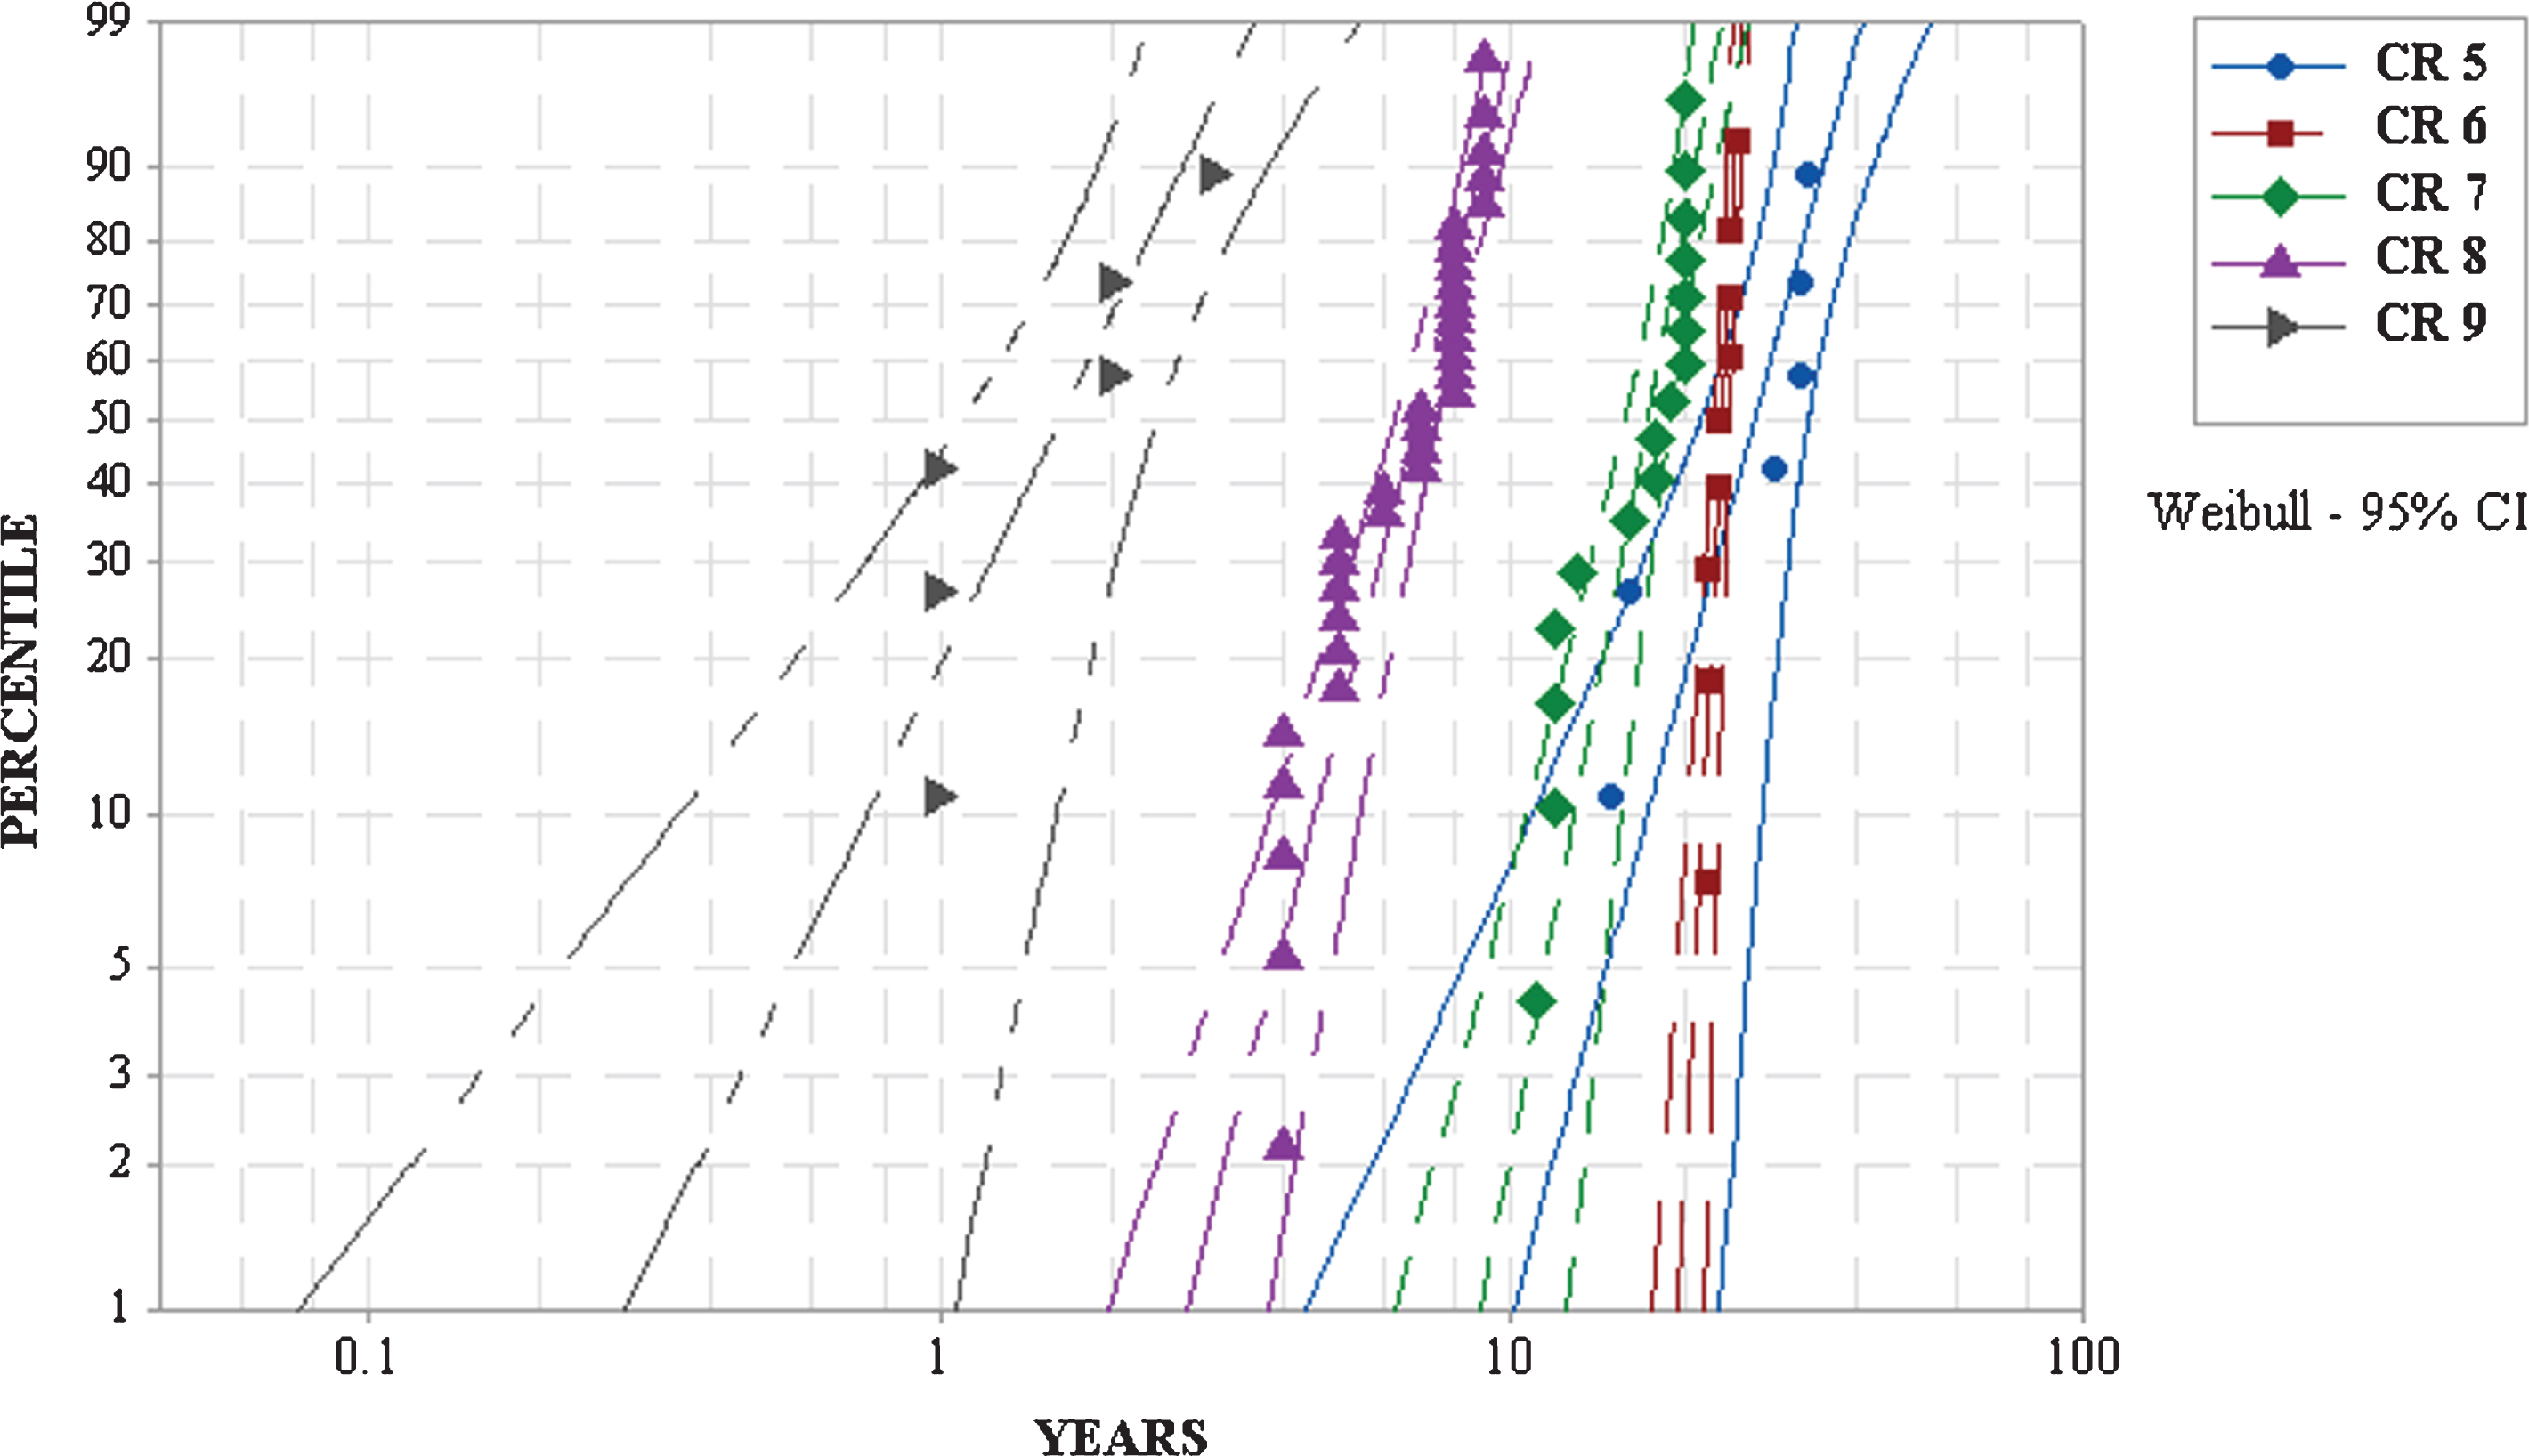
Weibull probability plots for all the CR of the bridge deck.
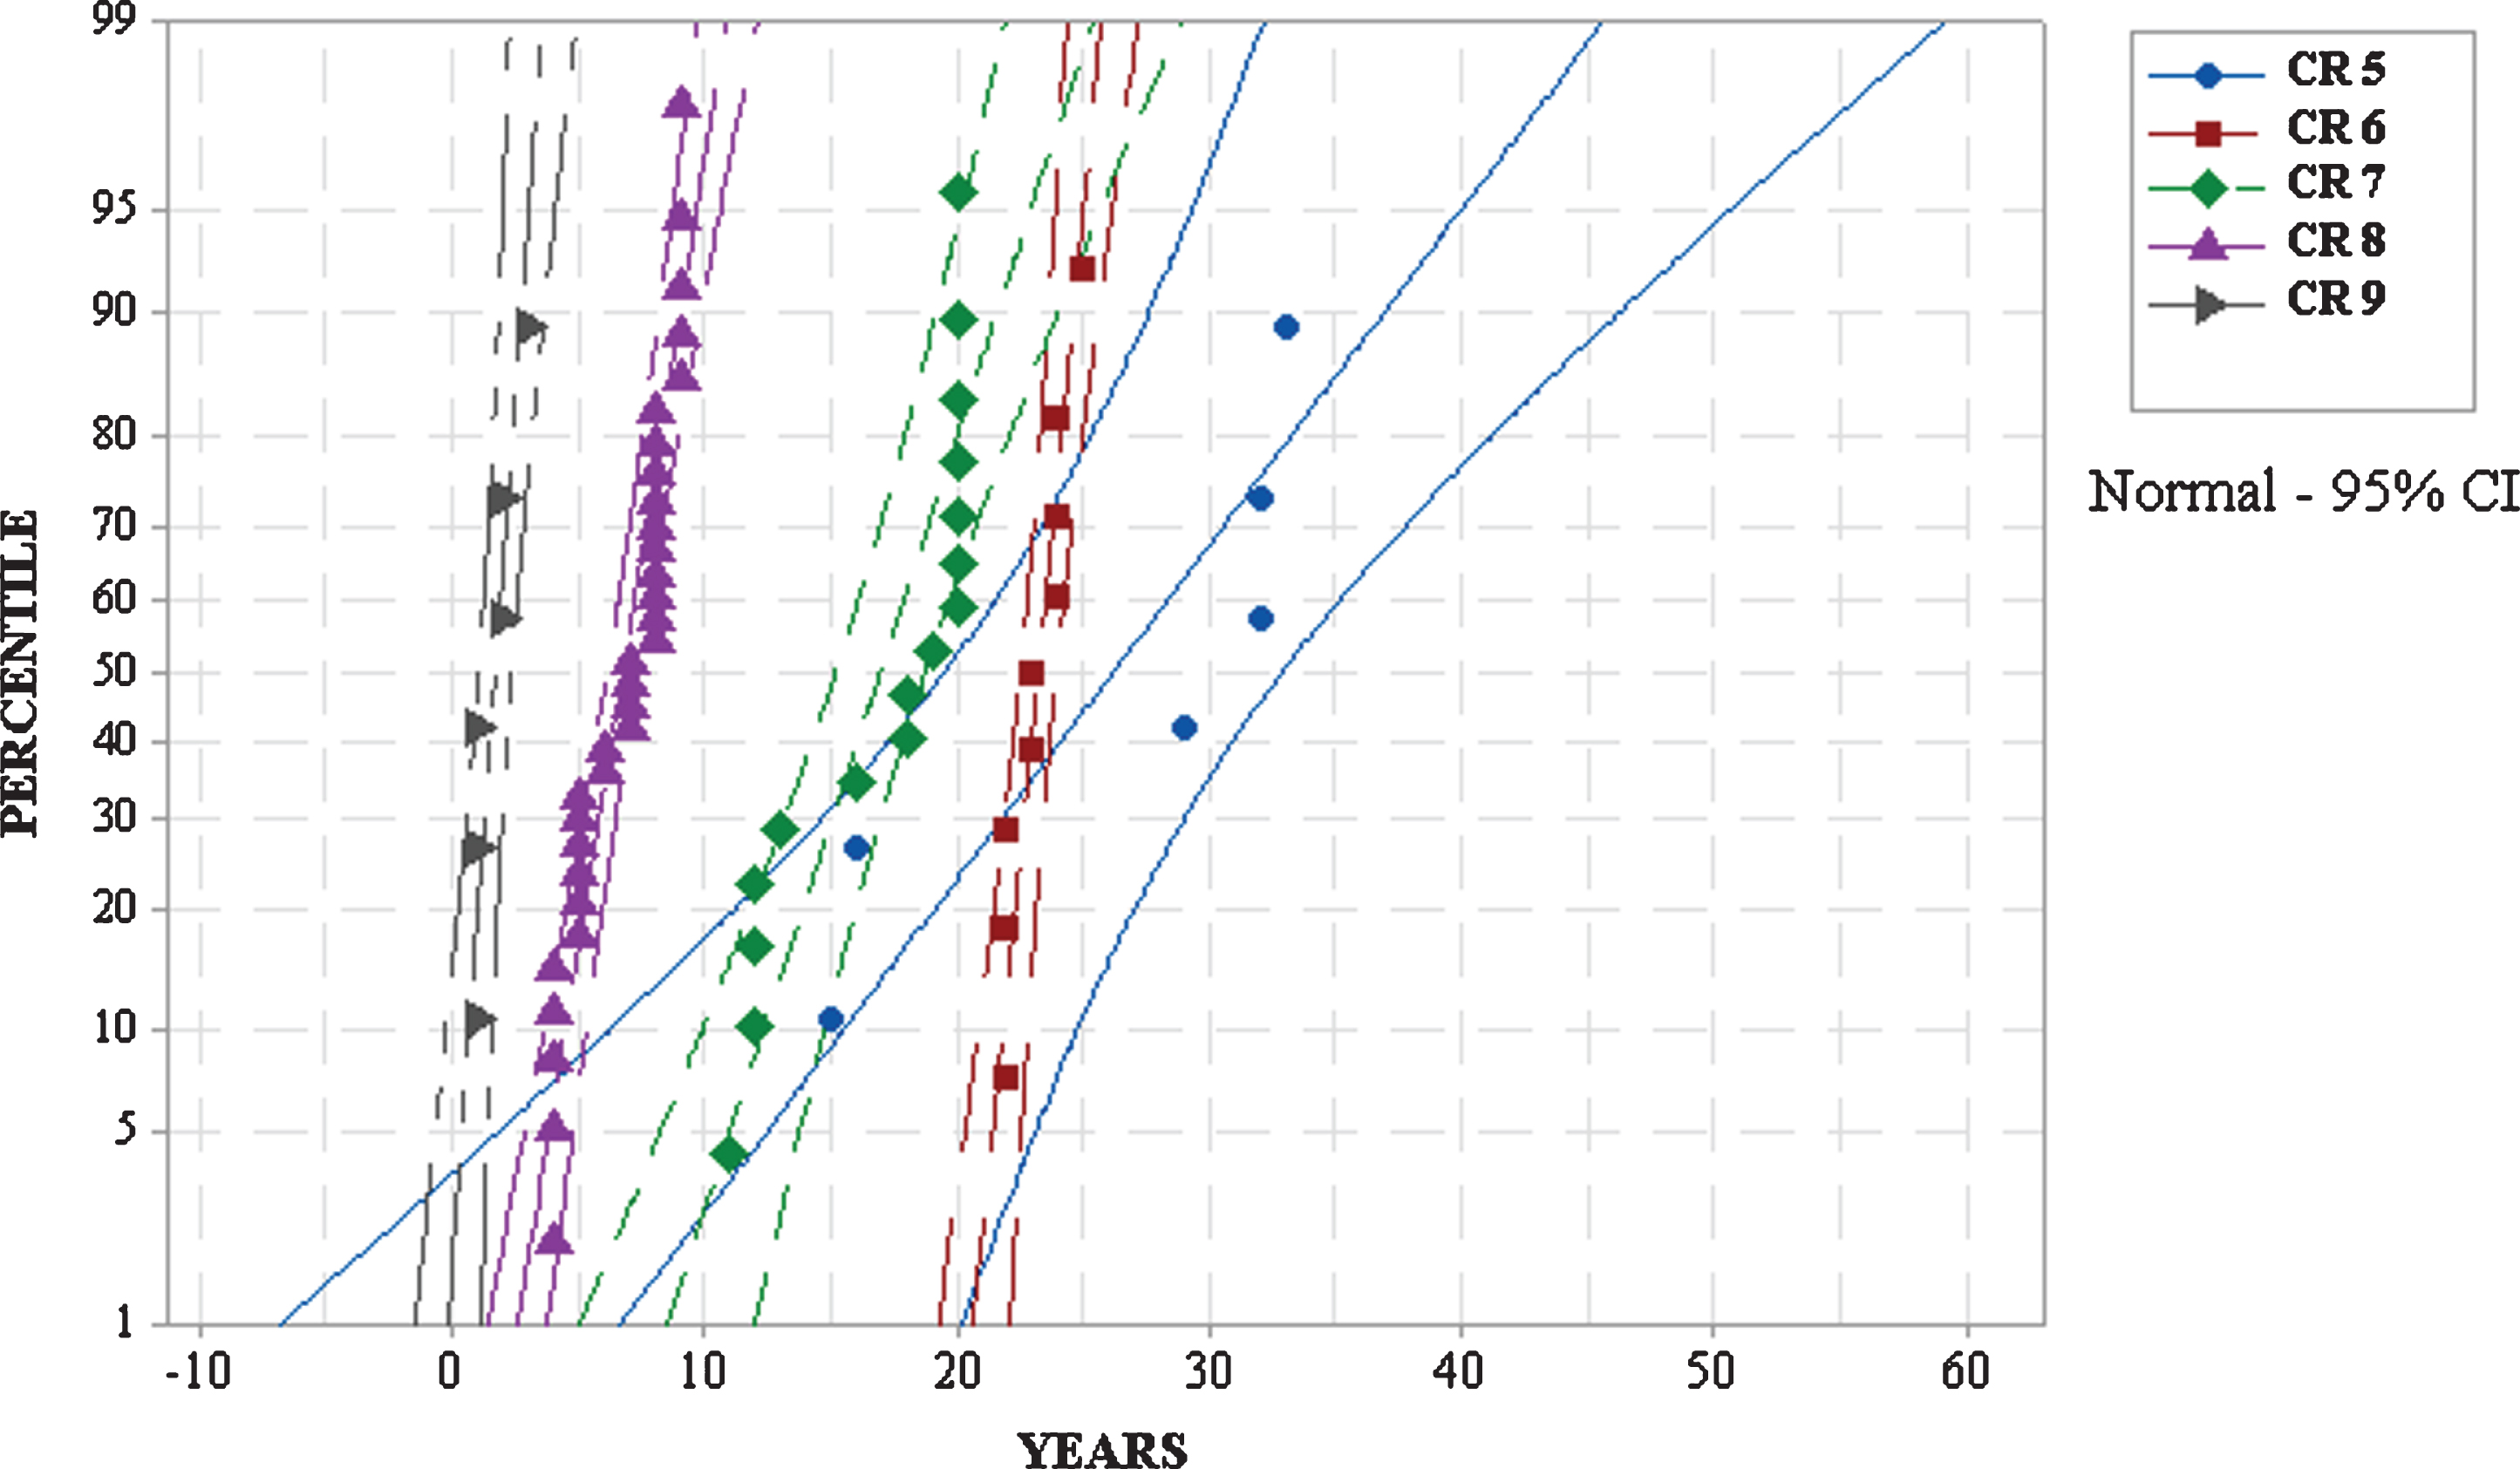
Normal probability plots for all the CR of the bridge deck.
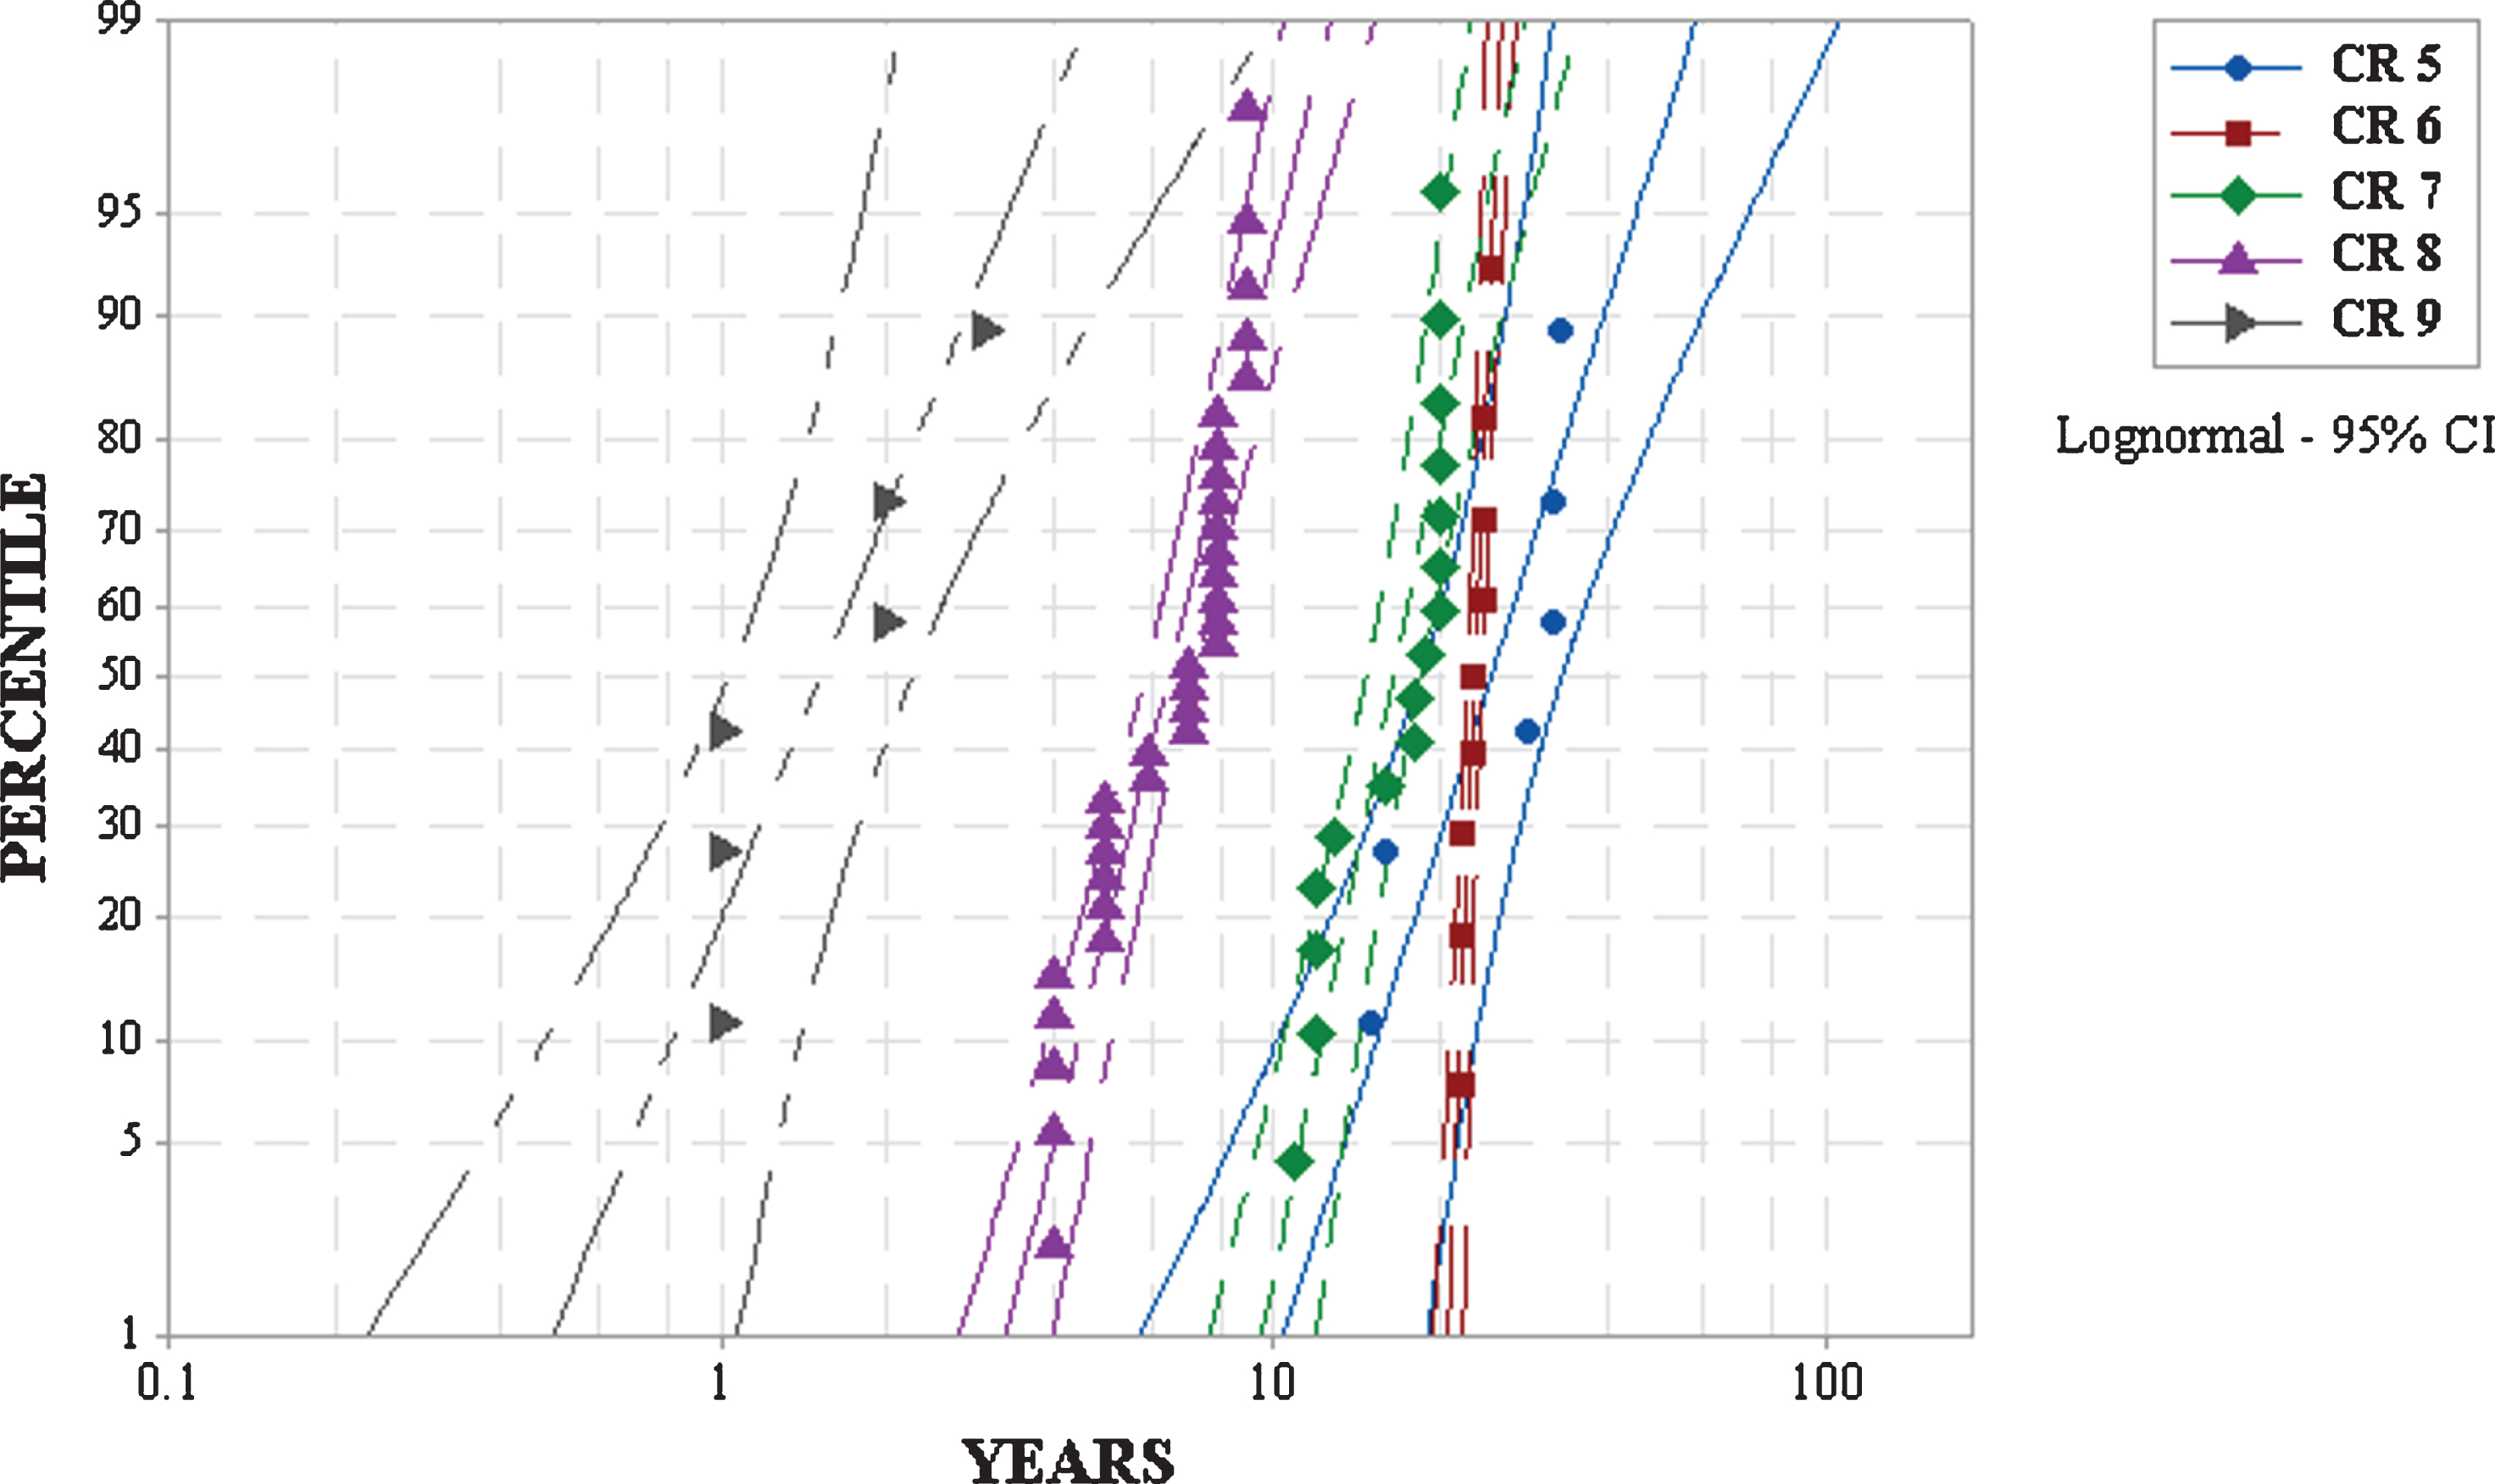
Lognormal probability plots for all the CR of the bridge deck.
The analysis shows that among the (probabilistic distribution) models considered such as normal, Weibull and lognormal, the most suitable fitting distribution/model comes out to be the Weibull distribution. The Weibull distribution gives lesser AD statistics value having close range in probability plots. However, from Table 3, it has been observed that the normal distribution has some close encounters, however Weibull finally considered among the best fit for the dataset and used for the whole analyses respectively to find the condition states in all CRs of RC Bridges in the study area.
Table 4 shows the result found from the data analysis of RC Bridges. It has been observed that the average life spent by bridges having CR 9 becomes about one or two years, with standard deviation less than one. Bridges with CR 8 spent about six to seven years averagely with a standard deviation less than two years. Conversely, CR 7, CR 6 and CR 5 spent average service life of 16-17 years, 23-24 years and 26-27 years respectively. The scale values indicate the characteristics life of bridges in that condition rating. Indeed, scale parameters show the highest ability of staying or spending time in that CR. The CR 9 shows nearly two years, CR 8 has capability about eight years, CR 7 has about 19 years, CR 6 has 24 years nearly and CR 5 has around 29 years. Nevertheless, it could be seen that the average life spent (mean values) becomes less than scale values. The scale value also has an effect on the probability, if the scale value increases, peak value of the PDF curve decreases. The shape value is mostly significant as it indicates slope of the graph, here shape value is greater than one, which means failure rate would increase with time (explained above in bathtub curve portion). Indeed, p-value should be greater than 0.05 to accept the null hypothesis. From the parameters of Weibull, the sample probability distribution function and cumulative distribution function for the duration as per different CR for concrete deck, presented in Figs. 9 and 10 respectively. Alternatively, survivor functions, cumulative hazard functions and hazard rate curves also plotted in Figs. 11, 12 and 13 respectively. Reliability or survivor function is the probability that bridge in that condition would survive beyond a specific time. From the plotted Fig. 11, it has been observed that if taken specific time as 25 years, then some of the CR has not yet reached to that time and some of the CR has reached and showing their surviving value (%). In case of CR 5, 6, and 7 their probability of surviving values are 58.86, 13.08 and 0.198, which means that after 25 years, CR 5 has a tendency to continue in that condition and CR 7 and 6 are on less surviving mode, that is, these bridges have tendency of transitioning to the lower states such as CR 7 would move to CR 6 and CR 6 to CR 5 respectively.
Weibull fitted probability distribution parameters for different CR of RCC bridge deck
Weibull fitted probability distribution parameters for different CR of RCC bridge deck

Probability distribution function for a duration in CR for RCC bridge deck.
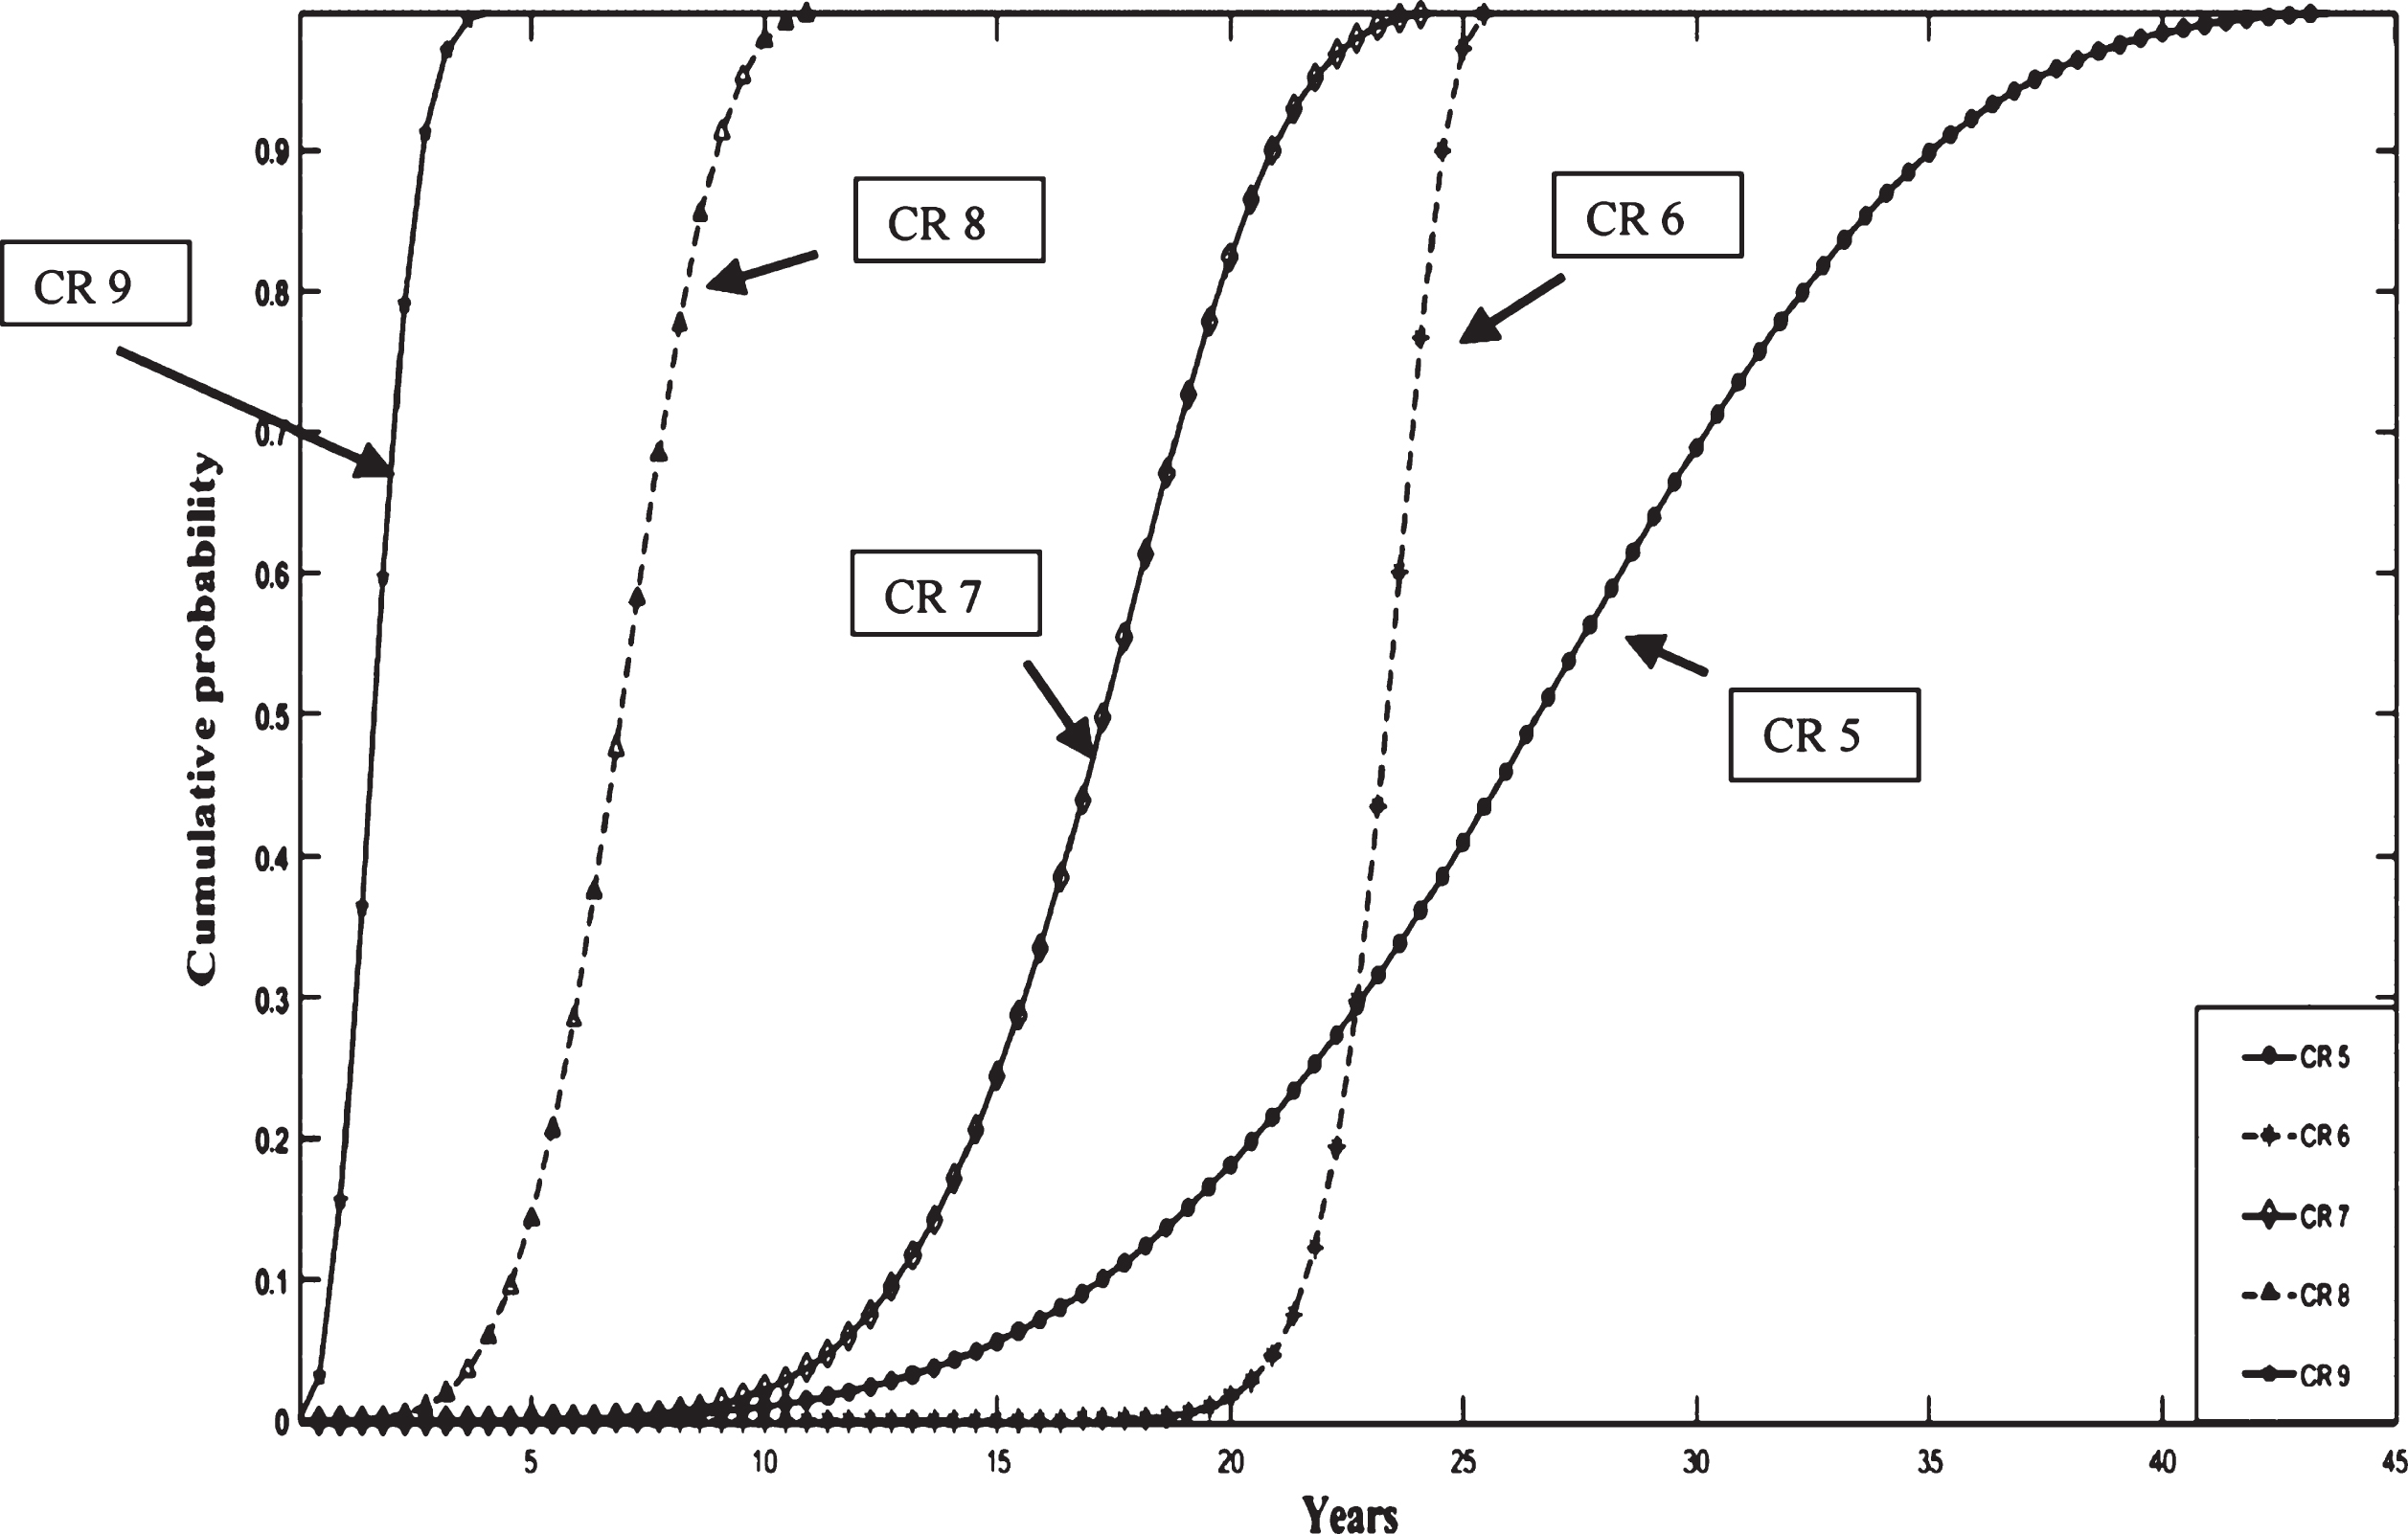
Cumulative distribution function for a duration in CR for RCC bridge deck.
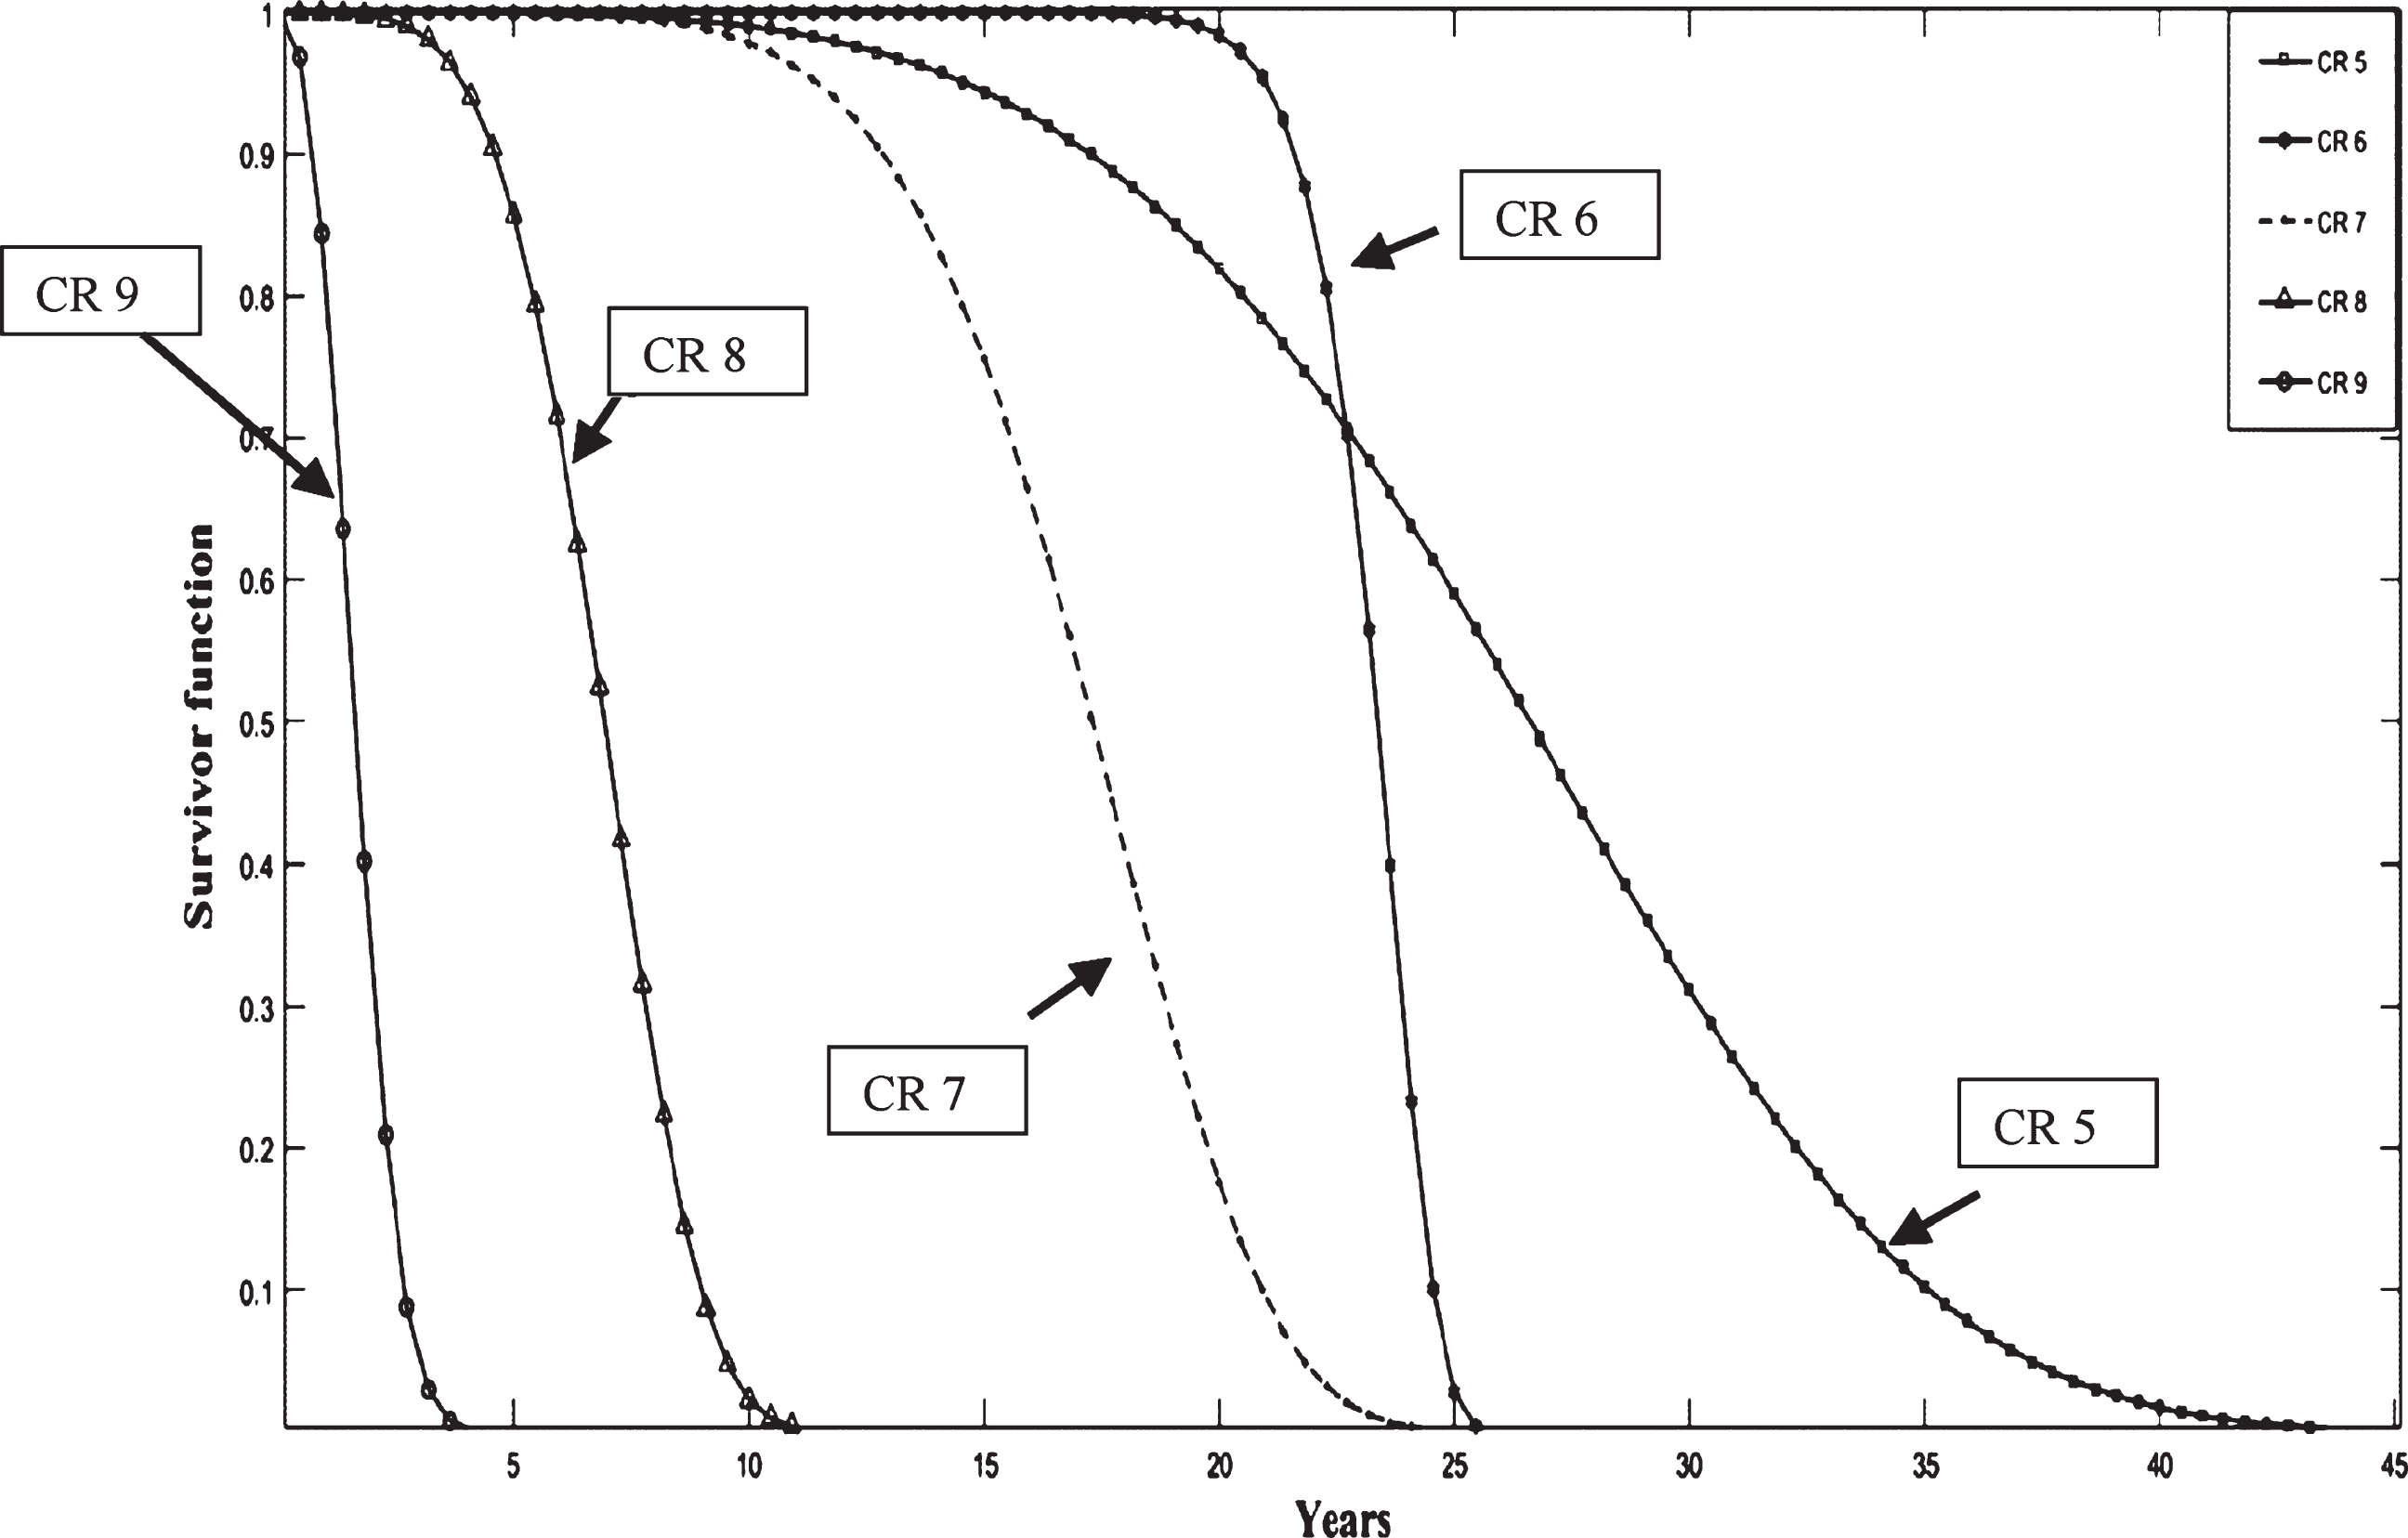
Reliability (Survivor) functions for CR of RCC bridge deck.
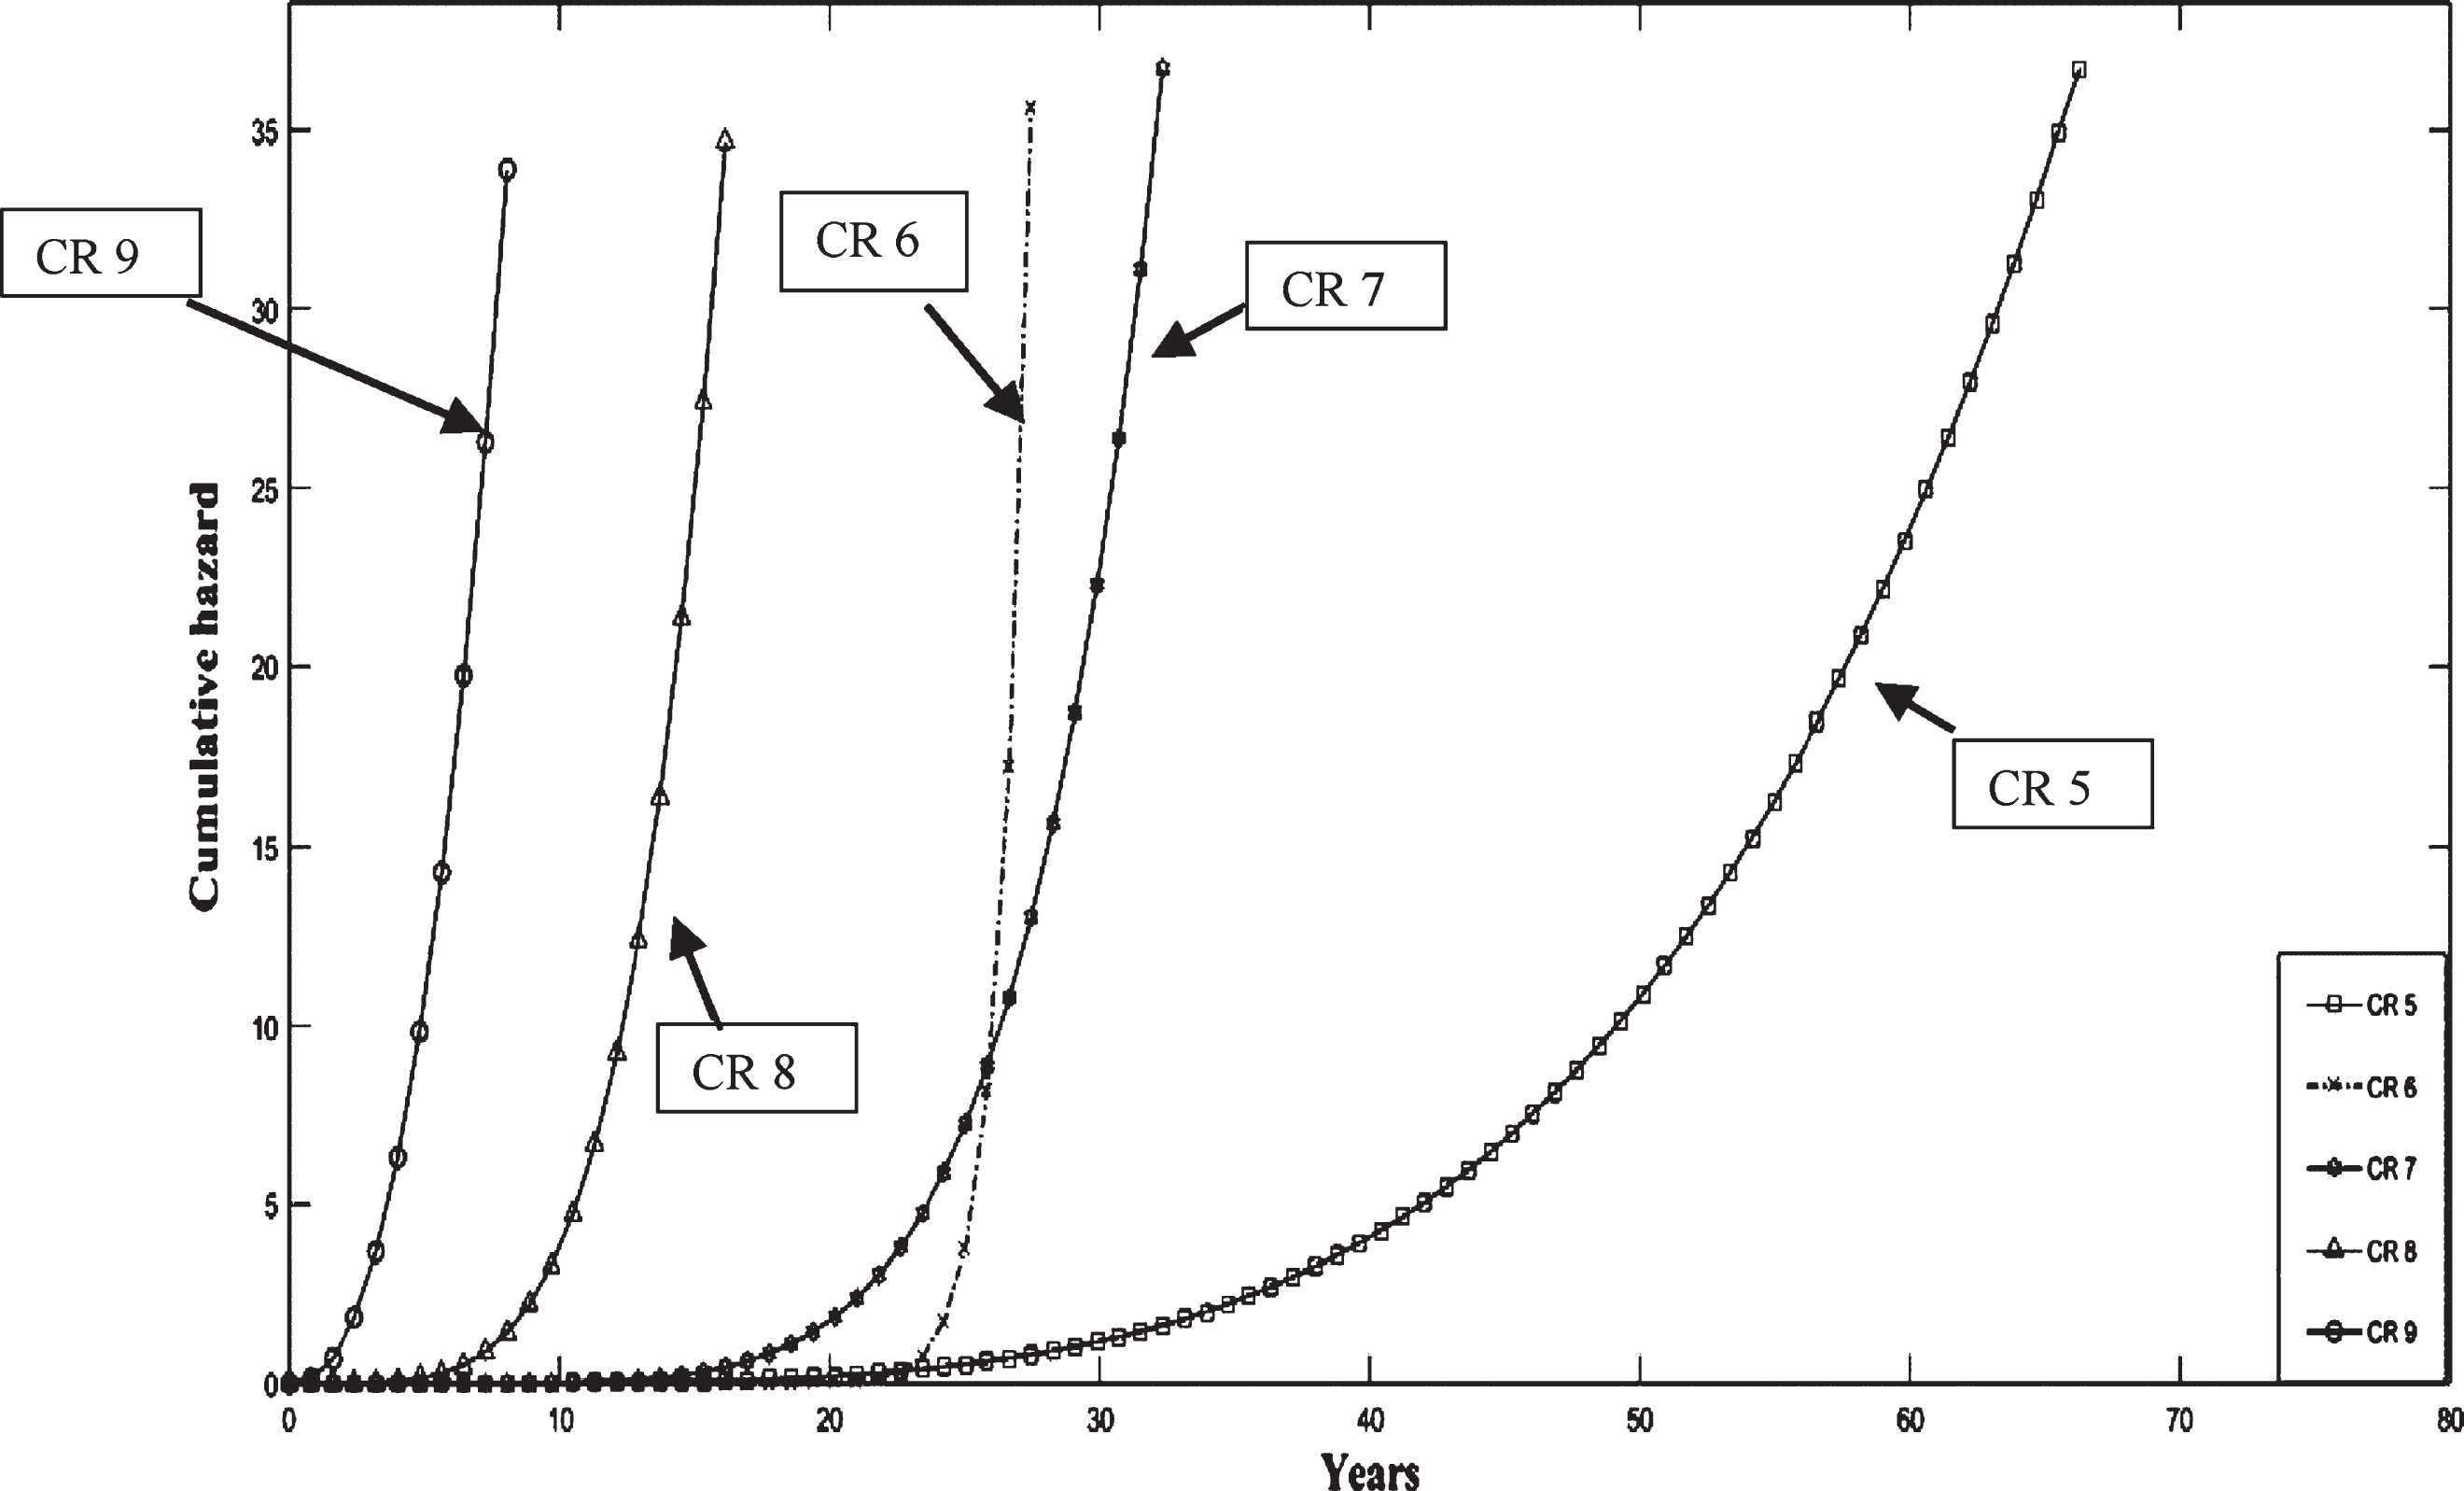
Cumulative hazard functions for CR of RCC bridge deck.
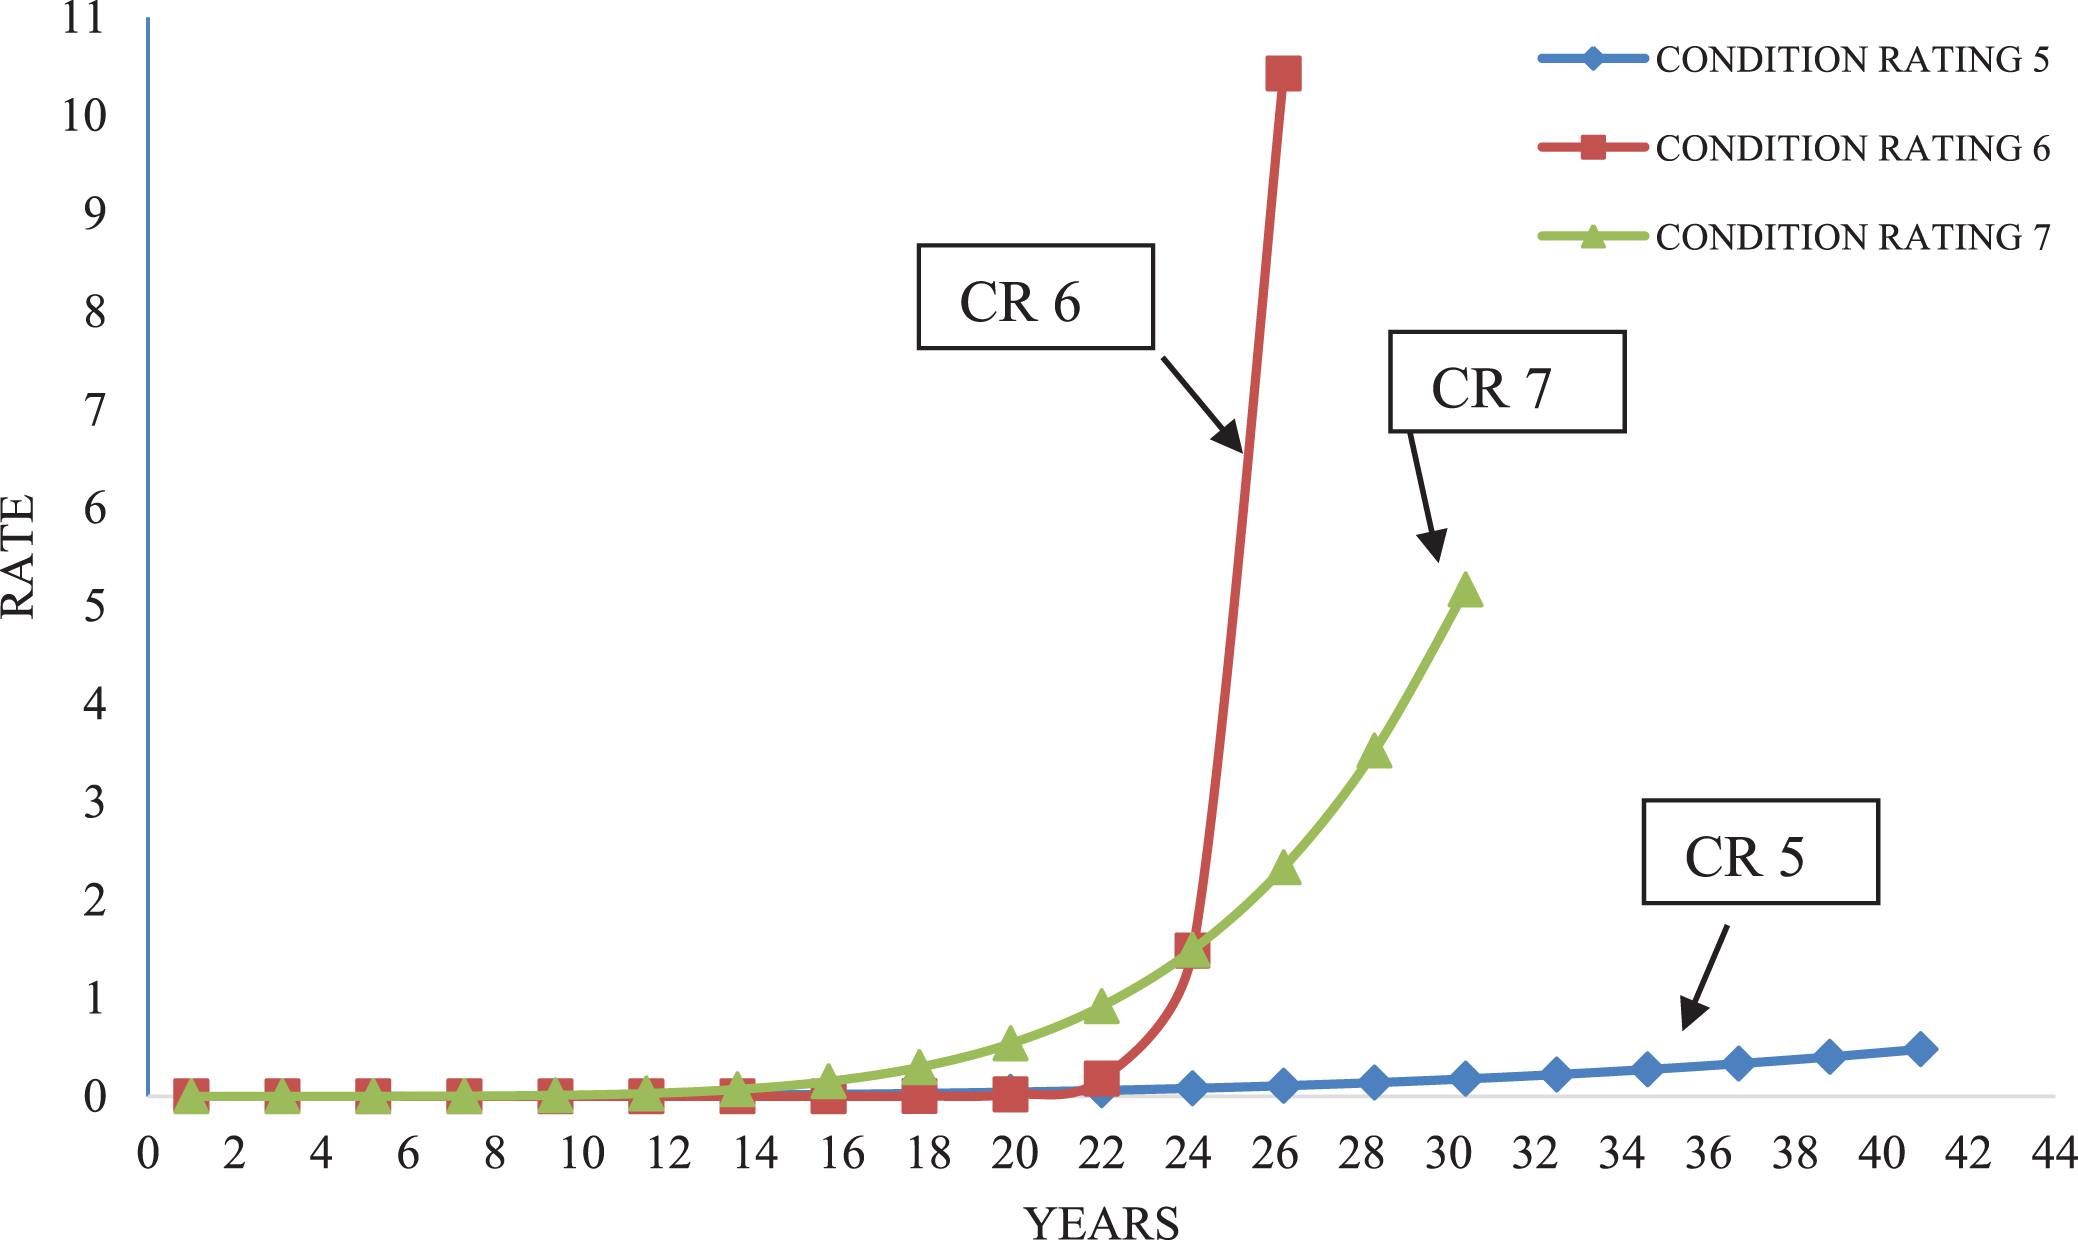
Hazard rate curve for CR of RCC bridge deck.
Further, it has been seen from the above discussion on the hazard function that bridges tend to start deteriorating mode in the wear-out period, and the infancy phase and constant failure phase becomes absent (Fig. 12 and 13). From Weibull plots, the shape parameter (β) of the Weibull distribution could be useful in predicting type of deterioration or damaged state (Abernethy, 1996) [14]. In Table 3, shows that Weibull fitted probability distribution parameters for different CR of RC bridge deck. Further, it could be seen that the shape parameter (β) for CR 5, 6, 7 and 8 have values more than 4 which means the bridges with such CRs are in rapid wear-out phase of failures or it has already initiated. Only, CR 9 have shape parameter (β) value between 1 and 4 which indicates that these bridges are in early wear-out phase of failures.
Further, from Figs. 12 and 13, it has been observed that hazard functions of CR 8 and 9 does not participate because it shows zero failures at initial stage. In actual case CR 8 and 9 have not reached the duration of 24 years and hazard functions having CR 5, 6 and 7 reached the duration of 24 years. Indeed, it’s resulting hazard values such as 1, 2 and 2, that means, at about 24 years in-service, the “failure or deterioration” rate is about 1 (one) [at least one bridge would tend to reach the condition threshold every year afterwards] and in case of CR 6 and 7, the rate is about 2 (two) [at least two bridges would likely to reach the condition threshold every year thereafter]. Therefore, in future days, this hazard rate would surely make the situation of such bridges more drastic and extreme. The hazard function specifies the effects of maturity or aging of the bridge decks leading to damaging condition of bridge. As a result, the plotted curve and the values came up, could be concluded that the CR 6 and 7 deteriorating faster than other CR of bridges. Also CR 5 bridges are on the edge of transition (slowly) to CR 4 (fair condition to poor condition). It is also important to mention that the “failure or deterioration” condition discussed here becomes not the physical failure of the bridge. It is the transitioning of a bridge condition from a better condition to worse condition (which reaches the threshold condition).
In this paper, condition assessment, reliability and hazard analysis made on the existing RC bridge decks located in the state of Assam essentially for the districts Cachar and Hailakandi area. The approach is adopted to determine or predict the tendency of surviving and damaging of the RCC bridge deck and assess the bridge condition of the study area. The procedure begin with collection of data (bridge location along with other details) obtained from the PWD and other reputed agencies available as per the districts considered for this study. The condition assessment method adopted through visual inspection as per NBIS procedure taken into consideration for categorizing the bridges as per their specified CR. The CR results in the current situation of in-service bridges and the defects present in the bridge decks. The bridge inspector’s reference manual (IRC: SP:52-1999) [11], the manual for highway bridge maintenance inspection (Indian Roads Congress), the bridge inspector’s reference manual (FHWA: NHI 12-049) and the national bridge inspection standards (FHWA) helps in categorizing the bridges and its respective CR. As our main objective is to evaluate the natural weakening (damage) and reliable functions (without prior improvement) of the bridges, this could be achieved after the formation/extraction of dataset and censoring the data. In this study, the data set is Type I right-censored. The analysis done with the help of Microsoft Excel sheet and statistical tool such as MATLAB suggested that the need of estimating uncertainty through probability distribution function for the dataset reliably. The AD test statistic (Goodness of fit test) indicated that the Weibull probability distribution becomes the best suitable fit for uncertain and time-based approach. However, with the help of Weibull probability distribution, the relevant parameters are obtained resulted by maximum likelihood estimation. The parameters found are scale parameter (which enlighten about the characteristic life of the bridge deck), shape parameters (which shows the type of deterioration state of bridge decks at present) and mean (average life spent by decks).
From the extracted results of the Weibull fitted parameters, average life spent by the different condition ratings of bridges shows that CR 9 bridges have less time 1 to 2 years to change from it’s current states. Similarly, CR 8 averagely spent about 6 to 7 years, CR 7 spent 16-17 years, CR 6 spent 23-24 years and CR 5 spent averagely 26-27 years. All CR average life spent values seemed to be less than the characteristics value (scale parameters). Indeed, considering survivor function, it has been observed that CR 5 exhibits susceptibility of enduring in that condition, whereas CR 7 and 6 exhibits less endurance in that condition. This may be due to tendency of transitioning to the lower states such as CR 7 would move to CR 6 and CR 6 to CR 5 becomes more. Hence, the discussion about hazard functions essentially related with the shape parameters that emerges from the concept of typical bathtub curve (theoretically). On the other hand, hazard function which signifies the failure rates of bridge decks gives the idea about the state of deterioration of bridges available at present. Further, it has been observed that the bridges (deck component) of CR 9 show in early wear-out phase of failures. The CR 5, 6, 7 and 8 are in rapid wear-out phase of failures. Aftermath of hazard rate values, it could be concluded that, in upcoming days, bridges (deck) of CR 6 and CR 7 would have faster deterioration. However, CR 5 bridges (deck) with calculated rate would be slowly going to the poor condition state, whereas, CR 8 and CR 9 have not shown any early deterioration. Hazard and early deterioration issues are emerging because of the heavier traffic exceeding (leading to the abundant of axle loads on bridge deck) the performance limits of CR respectively. The analytical case study presented here could be supportive and beneficial for the bridge engineers who become interested in bridge maintenance and system health monitoring process.
It should be significantly noted that data used such as condition data and other reliability parameters determined depending on the inspection (done on the specific year 2018) and CR could vary with the increase in time and improvement. There could be more improved and extensive level of findings by using other upgraded technical bridge condition data evaluation technique and new method of inspections. Thus, our presented approach of finding the reliability and hazard function of RCC bridge deck in the state of Assam (where, Cachar district and Hailakandi district taken into consideration) is done and could be helpful for bridge management system and bridge health monitoring and would help in taking rational decisions for bridge inspection, restoration and maintenance during service life of bridges in study area.
Footnotes
Acknowledgments
The authors acknowledge the support of SERB-DST (ECR/2016/001329) to carry out the research studies.