
Abstract
BACKGROUND:
Since the molecular mechanisms of cervical cancer (CC) have not been completely discovered, it is of great significance to identify the hub genes and pathways of this disease to reveal the molecular mechanisms of cervical cancer.
OBJECTIVE:
The study aimed to identify the biological functions and prognostic value of hub genes in cervical cancer.
METHODS:
The gene expression data of CC patients were downloaded from the Gene Expression Omnibus (GEO) database and The Cancer Genome Atlas (TCGA) database. The core genes were screened out by differential gene expression analysis and weighted gene co-expression network analysis (WGCNA). R software, the STRING online tool and Cytoscape software were used to screen out the hub genes. The GEPIA public database was used to further verify the expression levels of the hub genes in normal tissues and tumour tissues and determine the disease-free survival (DFS) rates of the hub genes. The protein expression of the survival-related hub genes was identified with the Human Protein Atlas (HPA) database.
RESULTS:
A total of 64 core genes were screened, and 10 genes, including RFC5, POLE3, RAD51, RMI1, PALB2, HDAC1, MCM4, ESR1, FOS and E2F1, were identified as hub genes. Compared with that in normal tissues, RFC5, POLE3, RAD51,RMI1, PALB2, MCM4 and E2F1 were all significantly upregulated in cervical cancer, ESR1 was significantly downregulated in cervical cancer, and RFC5 expression in CC patients was significantly related to OS. In the DFS analysis, no significant difference was observed in the expression level of RFC5 in cervical cancer patients. Finally, RFC5 protein levels verified by the HPA database were consistently upregulated with mRNA levels in CC samples.
CONCLUSIONS:
RFC5 may play important roles in the occurrence and prognosis of CC. It could be further explored and validated as a potential predictor and therapeutic target for CC.
Keywords
Introduction
Cervical cancer (CC) is currently the fourth most common malignant tumour in females worldwide [1]. Although cervical cancer vaccines, radical surgery, radiotherapy, and chemotherapy have been used to prevent and treat cervical cancer, the incidence is still increasing. According to statistics, there were 570,000 new cases of cervical cancer worldwide in 2018, and the number of deaths has exceeded 310,000 [2, 3]. Persistent high-risk human papillomavirus (hr-HPV) infection is the main factor in the occurrence of CC, and the current preventive vaccines for HPV are mainly bivalent, quadrivalent, and nine-valent [4, 5]. At present, the treatment of cervical cancer is mainly surgery and radiotherapy, supplemented by chemotherapy. Although the treatment of early-stage cervical cancer can reach clinical cure standards, the prognosis and survival rate of patients with advanced cervical cancer is poor. Therefore, screening and identifying the Hub gene that are related with the progression of cervical cancer is of great value for the early diagnosis of cervical cancer, discovering new therapeutic targets, and improving the survival rate and prognosis of patients with cervical cancer.
With the rapid development and promotion of microarray and high-throughput sequencing technologies, bioinformatics has provided a richer platform and data foundation for research on the mechanisms of tumour occurrence and development. The relationship between the expression of tens of thousands of genes and the occurrence of cancer can be studied simultaneously to find key genes in carcinogenesis and to identify biological markers for cancer diagnosis or prognosis.
In this study, the mRNA expression data of cervical cancer patients obtained from the GEO and TCGA databases were analyzed by differential expression analyses of genes and WGCNA to obtain differentially co-expressed genes, i.e., core genes. Functional annotation and signaling pathway analysis of the core genes were conducted to further understand their functions in the occurrence of cervical cancer. The final hub genes were obtained through protein-protein interaction (PPI) analysis. Then, the expression levels and prognostic value of the hub genes were verified.
Materials and methods
Acquisition of cervical cancer gene expression data
The gene expression data of cervical cancer (CC) patients were downloaded from the Gene Expression Omnibus (GEO) database and The Cancer Genome Atlas (TCGA) database. In the GEO database, the gene expression profile of cervical cancer, GSE9750, including 43 tumour samples and 19 normal samples, and the platform file GPL96 were obtained. Based on the gene information of platform file GPL96, the gene probes of GSE9750 were converted into the name of the gene, and 12548 genes were finally obtained. In the TCGA database, gene expression data (TCGA-CC) and clinical information of cervical cancer were screened and downloaded, and a total of 309 cervical cancer samples were obtained, including 306 tumour samples and 3 normal samples, as well as 19600 genes.
WGCNA identifies key co-expression modules
Weighted gene co-expression network analysis (WGCNA) mines genes with similar expression patterns based on differential gene expression patterns and places them in what is called a module. The module features and hub genes within modules were identified, and each module was associated with other modules or external sample features to screen core genes in modules for biological markers. The WGCNA package in R software was used to construct the weighted gene co-expression network of the TCGA-CC and GSE9750 datasets [6]. To further select the functional module in the co-expression network, the correlation coefficients between the modules and the phenotype of interest were calculated to obtain the correlation between the modules and clinical features, and the module with a high correlation coefficient was selected for subsequent analysis. This module was considered to be a functional module related to clinical features.
Differential expression analysis of genes
In R software, the CPM value of the edgeR package was used for correction, the genes with low expression in the sample were filtered, and the genes with RPKM values were output using the RPKM function for the next analysis [7]. We obtained 14,744 genes with RPKM values from the TCGA-CC dataset. The differentially expressed genes (DEGs) in the TCGA-CC and GSE9750 data sets were identified through the limma package in R software [8]. Genes meeting the cut-off criteria of
Identification of core genes
The overlapping genes between the DEGs and the co-expressed genes in the functional modules obtained by WGCNA of the TCGA-CC and GSE9750 datasets were taken as the core genes. In this paper, the core gene acquisition was performed using the VennDiagram package in R software to construct the Venn diagram [9].
WGCNA of the TCGA-CC dataset. A: Module clustering tree and module division of co-expressed genes in cervical cancer. B: Correlation between clinical and traits.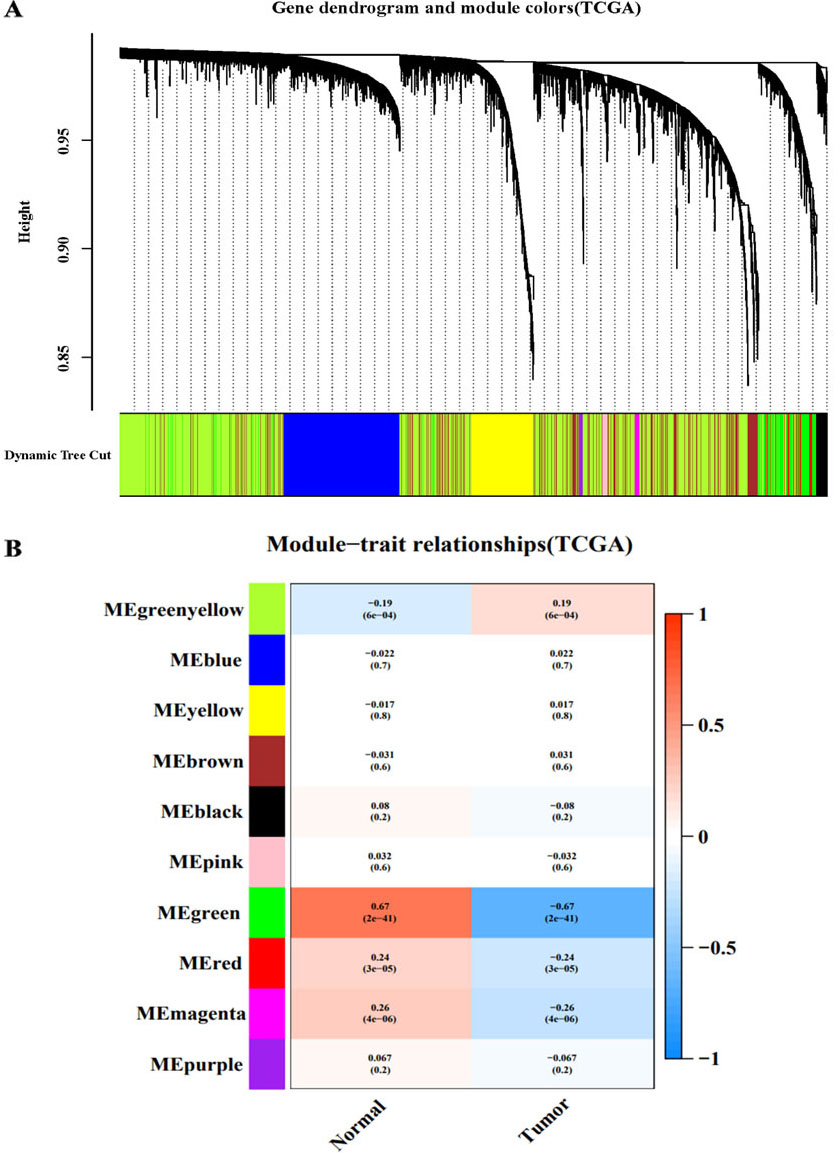
Gene Ontology (GO [10] and Kyoto Encyclopedia of Genes and Genomes (KEGG) [11] analyses of the core genes were conducted to study their main functions and participation in signalling pathways. In this paper, the clusterProfiler package [12] and the enrichplot package in R software were used to explore the functions between the core genes and the involved signalling pathways, and the ggplot2 package was used to visualize the output results.
PPI network construction of the core genes and selection of hub genes
In this paper, the core genes were searched in the STRING database [13] (
WGCNA of the GSE9750 dataset. A: Module clustering tree and module division of co-expressed genes in cervical cancer. B: Correlation between clinical and traits.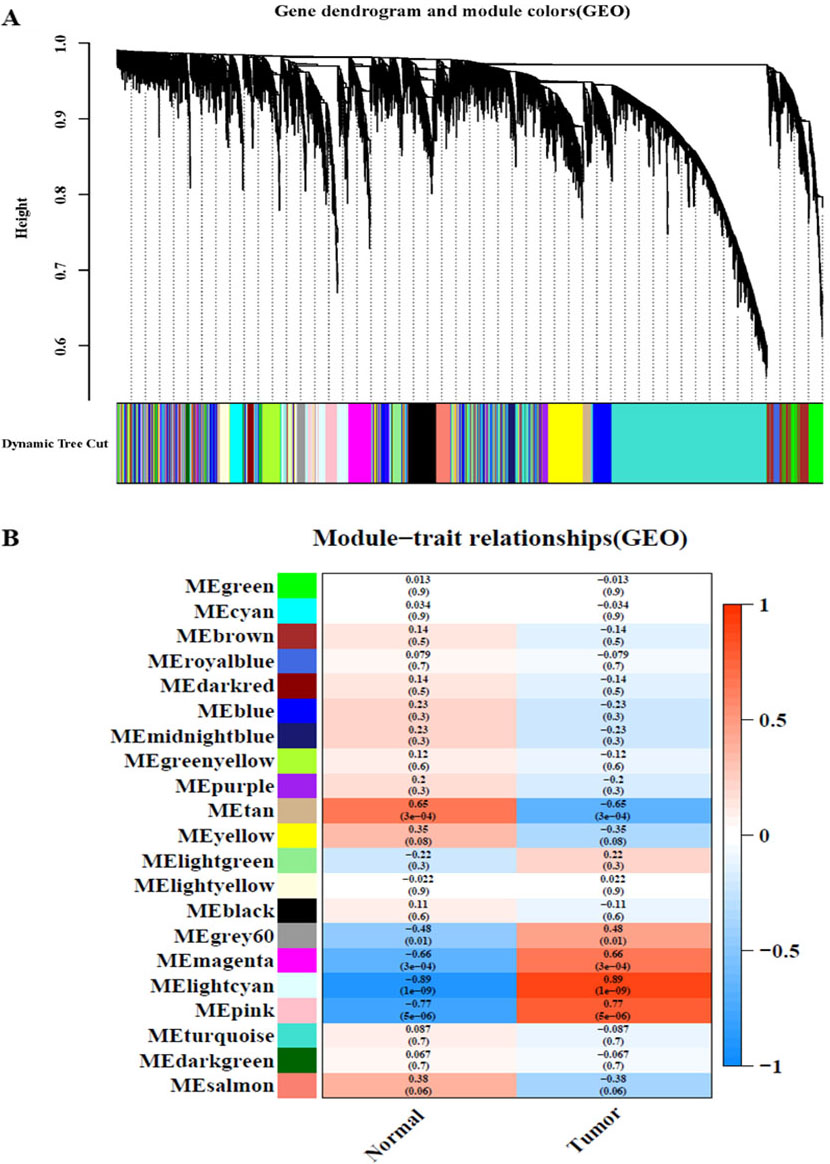
Gene expression profiling interactive analysis (GEPIA) is a public database for gene expression profiling analysis of cancer tissues and normal tissues [16]. In this paper, the GEPIA online tools were used to further verify the expression levels of 10 hub genes in tumour tissues and normal tissues and to determine the relationship between disease-free survival (DFS) and the hub genes. In addition, the survival and survminer packages in R software were used to analyse the correlation between the overall survival (OS) of patients and the hub genes.
Acquisition of core genes in the TCGA-CC dataset and GSE9750 dataset. A: Analysis of DEGs in the TCGA-CC dataset. B: Analysis of DEGs in the GSE9750 dataset. C: Venn diagram analysis of DEGs and co-expressed genes.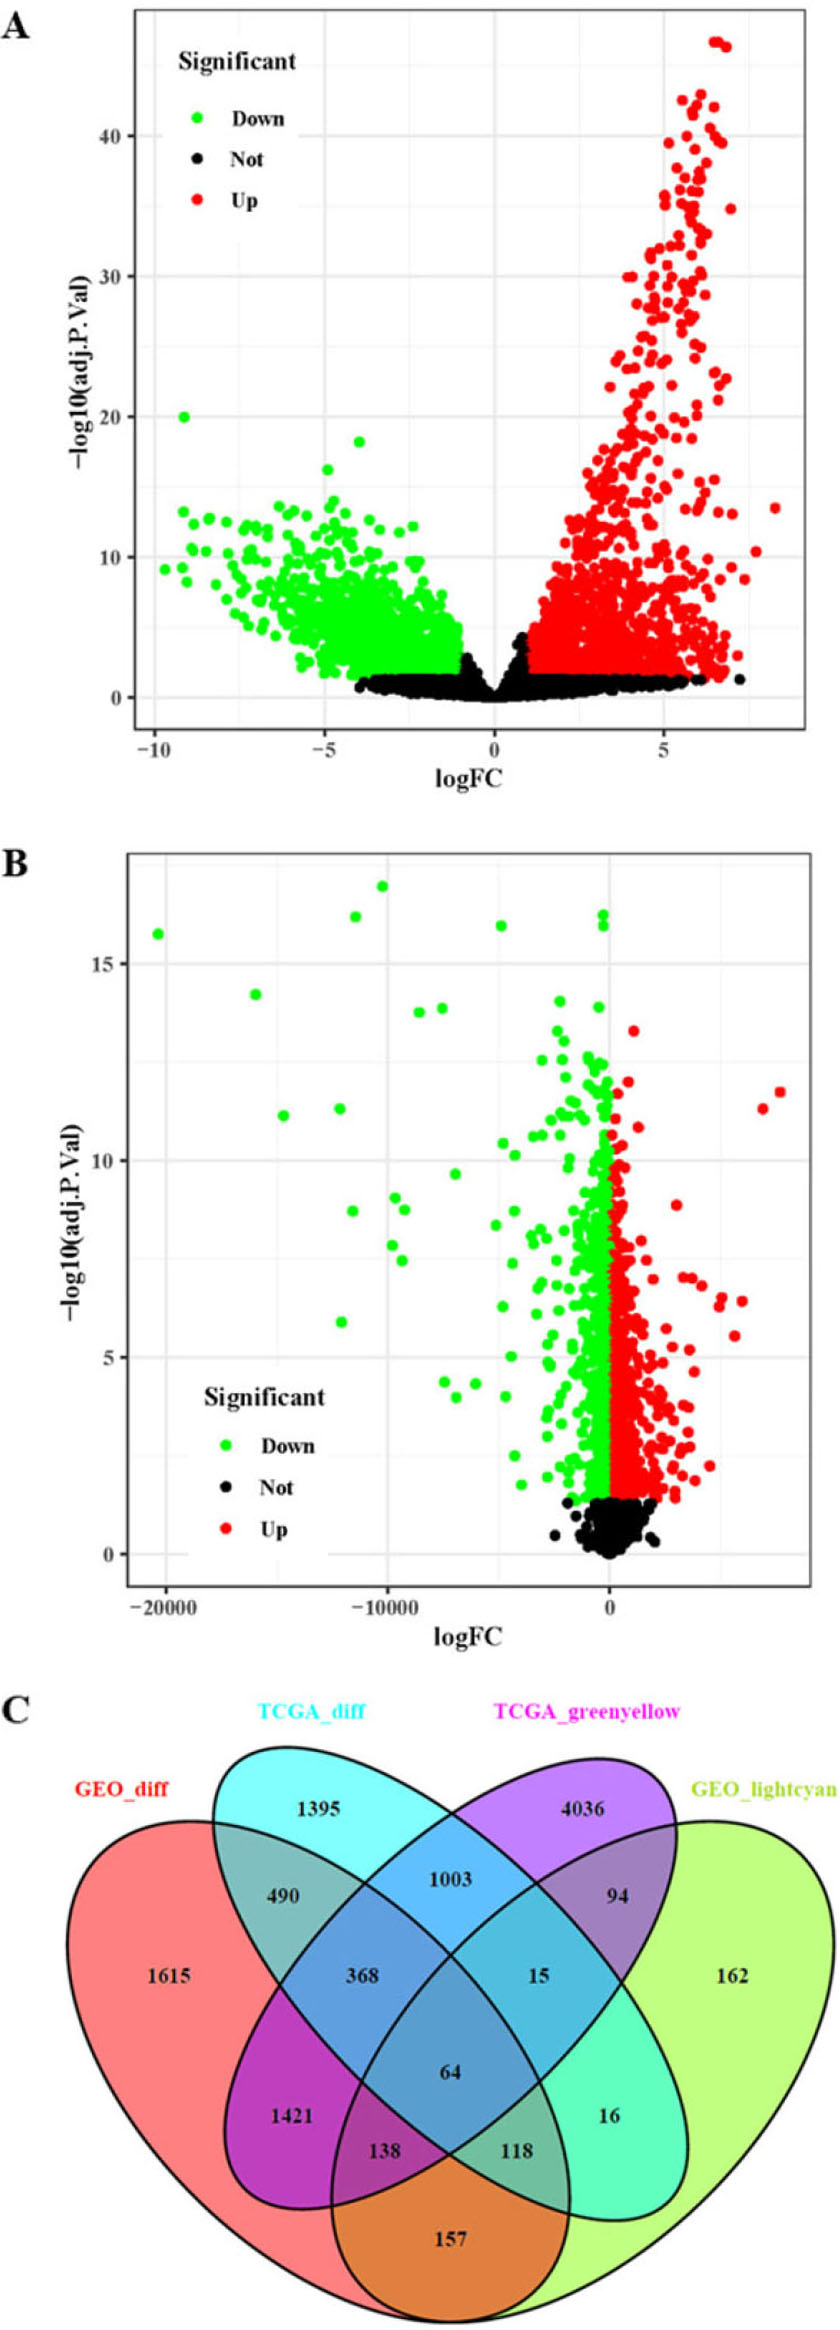
The Human Protein Atlas (HPA) database is an online analysis software that explores the expression of protein coding genes in normal and tumour tissues/organs [17]. In this study, the protein expression and distribution of the survival-related hub genes in cervical cancer tissues and normal tissues were verified by the immunohistochemistry analysis tool in HPA. Then, through the GEPIA database, differential expression analysis of the survival-related hub gene mRNA in all tumours and corresponding normal tissues was performed.
Results
Construction of a weighted gene co-expression network
After analysing the TCGA-CC and GSE9750 datasets by WGCNA, the minimum module size parameter was set to 50 by using the dynamic cut-tree method, the obtained modules were subjected to clustering analysis, and the modules that were close to each other were merged into new modules. Finally, 10 gene modules were obtained from TCGA-CC (Fig. 1 A), and 20 gene modules were obtained from GSE9750 (Fig. 2A). Different colours represent different modules, each leaf node in the tree diagram represents a gene, and densely connected branches represent close genes. Then, a heat map of the relationship between modules and traits was drawn to assess the association between the two clinical features (tumour and normal) and each module. From the results of the relationship between the module and the traits, it was found that the green-yellow module of TCGA-CC (Fig. 1B) and the light cyan module of GSE9750 (Fig. 2B) have the highest positive correlation with tumour tissues (green-yellow:
Functional annotation and signal pathway analysis of 64 core genes. A: GO functional annotation analysis of 64 core genes. The vertical axis indicates the signalling pathway, the horizontal axis indicates the number of genes enriched in the signalling pathway, and the colour indicates the significance of enrichment. B: KEGG signalling pathway analysis of 64 core genes. The size of the black circle represents the number of enriched genes, and the colour of the circle represents the significance of gene enrichment.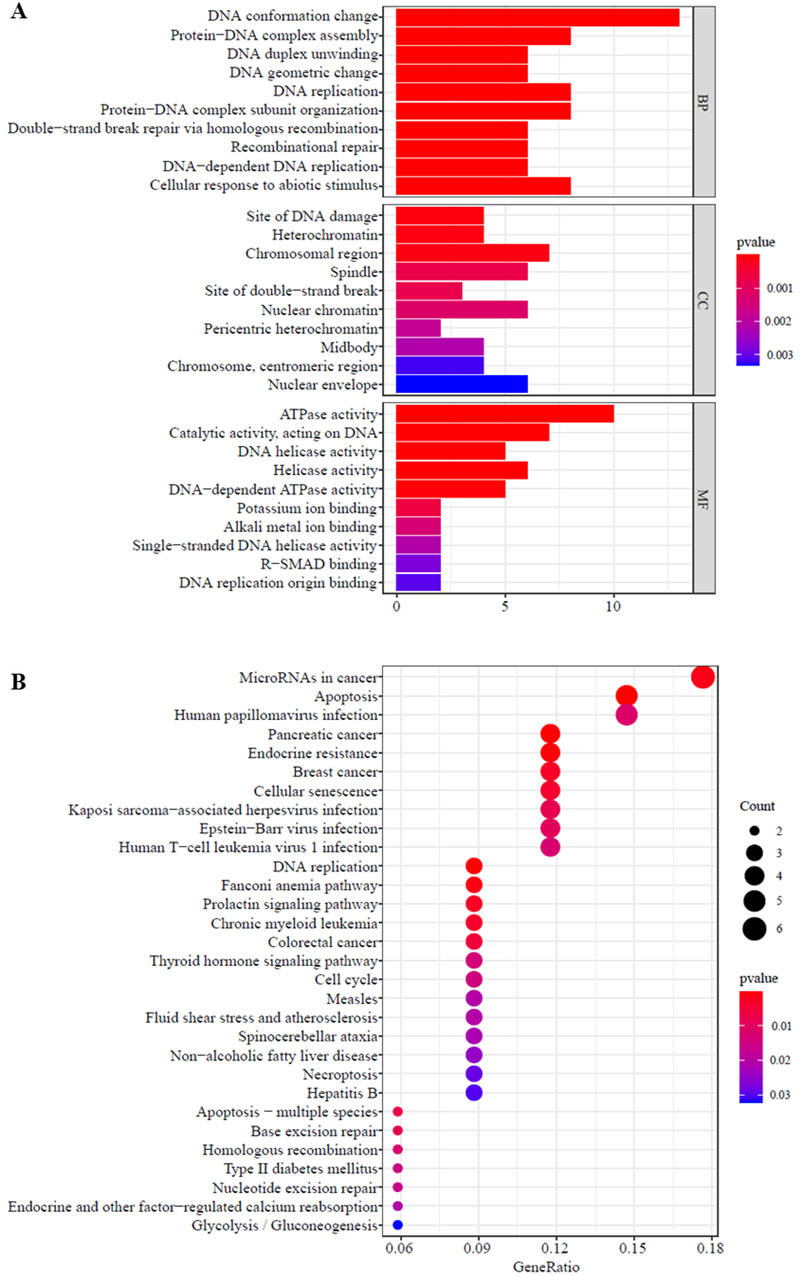
The DEGs in the TCGA-CC and GSE9750 datasets were identified by the limma package in R software. A total of 3469 DEGs were identified in the TCGA-CC dataset (Fig. 3A), and a total of 4371 DEGs were identified in the GSE9750 dataset (Fig. 3B). Then, a Venn diagram of the co-expressed genes in the light cyan module of GSE9750 and the green-yellow module of TCGA-CC containing overlapping DEGs in the TCGA-CC and GSE9750 datasets was constructed (Fig. 3C). A total of 64 overlapping genes were obtained as core genes for further analysis.
Obtaining the hub genes from the PPI network. A: Construction of the PPI network based on the core genes. B: Ten hub genes were screened out, among which red, orange, jacinth, and yellow represent MCC values of genes that decrease in sequence.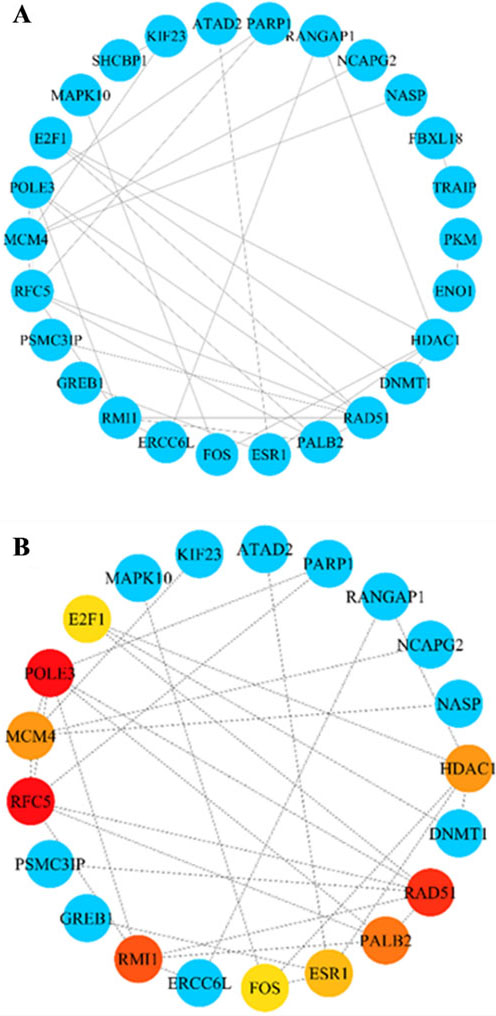
The 64 core genes were analysed for GO functions and KEGG signalling pathways to identify related biological functions and signalling pathways. The results of GO functional enrichment analysis using the clusterProfiler package in R software show that the core genes were mainly enriched in biological processes (BPs) such as DNA conformation change, cellular response to abiotic stimulus, protein-DNA complex assembly, DNA replication, and protein-DNA complex subunit organization; cell components (CCs) including the chromosomal region, site of DNA damage, and heterochromatin; and molecular functions (MFs) such as ATPase activity, catalytic activity, acting on DNA, and helicobacter pylori activity (Fig. 4A). The KEGG signalling pathway enrichment analysis with the R package enrichplot shows (Fig. 4B) that the core genes are mainly enriched in signalling pathways such as microRNAs in cancer, apoptosis, human papillomavirus infection, and pancreatic cancer.
PPI network construction and hub gene identification
The PPI network was constructed based on 64 core genes by the STRING database (Fig. 5A). Through the MCC algorithm of the CytoHubba plug-in in Cytoscape software, the top 10 genes with high MCC scores were selected from the PPI network as hub genes (Fig. 5B), including RFC5, POLE3, RAD51, RMI1, PALB2, HDAC1, MCM4, ESR1, FOS and E2F1.
Prognostic value and expression levels of hub genes
The expression levels of the 10 hub genes in normal tissues and tumour tissues were further verified by the GEPIA public database (Fig. 6). Compared with that in normal tissues, RFC5, POLE3, RAD51, RMI1, PALB2, MCM4 and E2F1 were significantly upregulated in cervical cancer tissues, while ESR1 was significantly downregulated in cervical cancer tissues. The survival and survminer R packages were used to explore the correlation between overall survival (OS) and the hub genes (RFC5, POLE3, RAD51, RMI1, PALB2, HDAC1, MCM4, ESR1, FOS and E2F1) (Fig. 7). Among the 10 hub genes, RFC5 expression was significantly correlated with the OS of cervical cancer patients (Fig. 7I) (
The expression levels of the hub genes in normal tissues and cervical cancer tissues. Expression level of E2F1 (A), ESR1 (B), FOS (C), HDAC1 (D), MCM4 (E), PALB2 (F), POLE3 (G), RAD51 (H), RFC5 (I), and RMI1 (J) in normal tissues and cervical cancer tissues.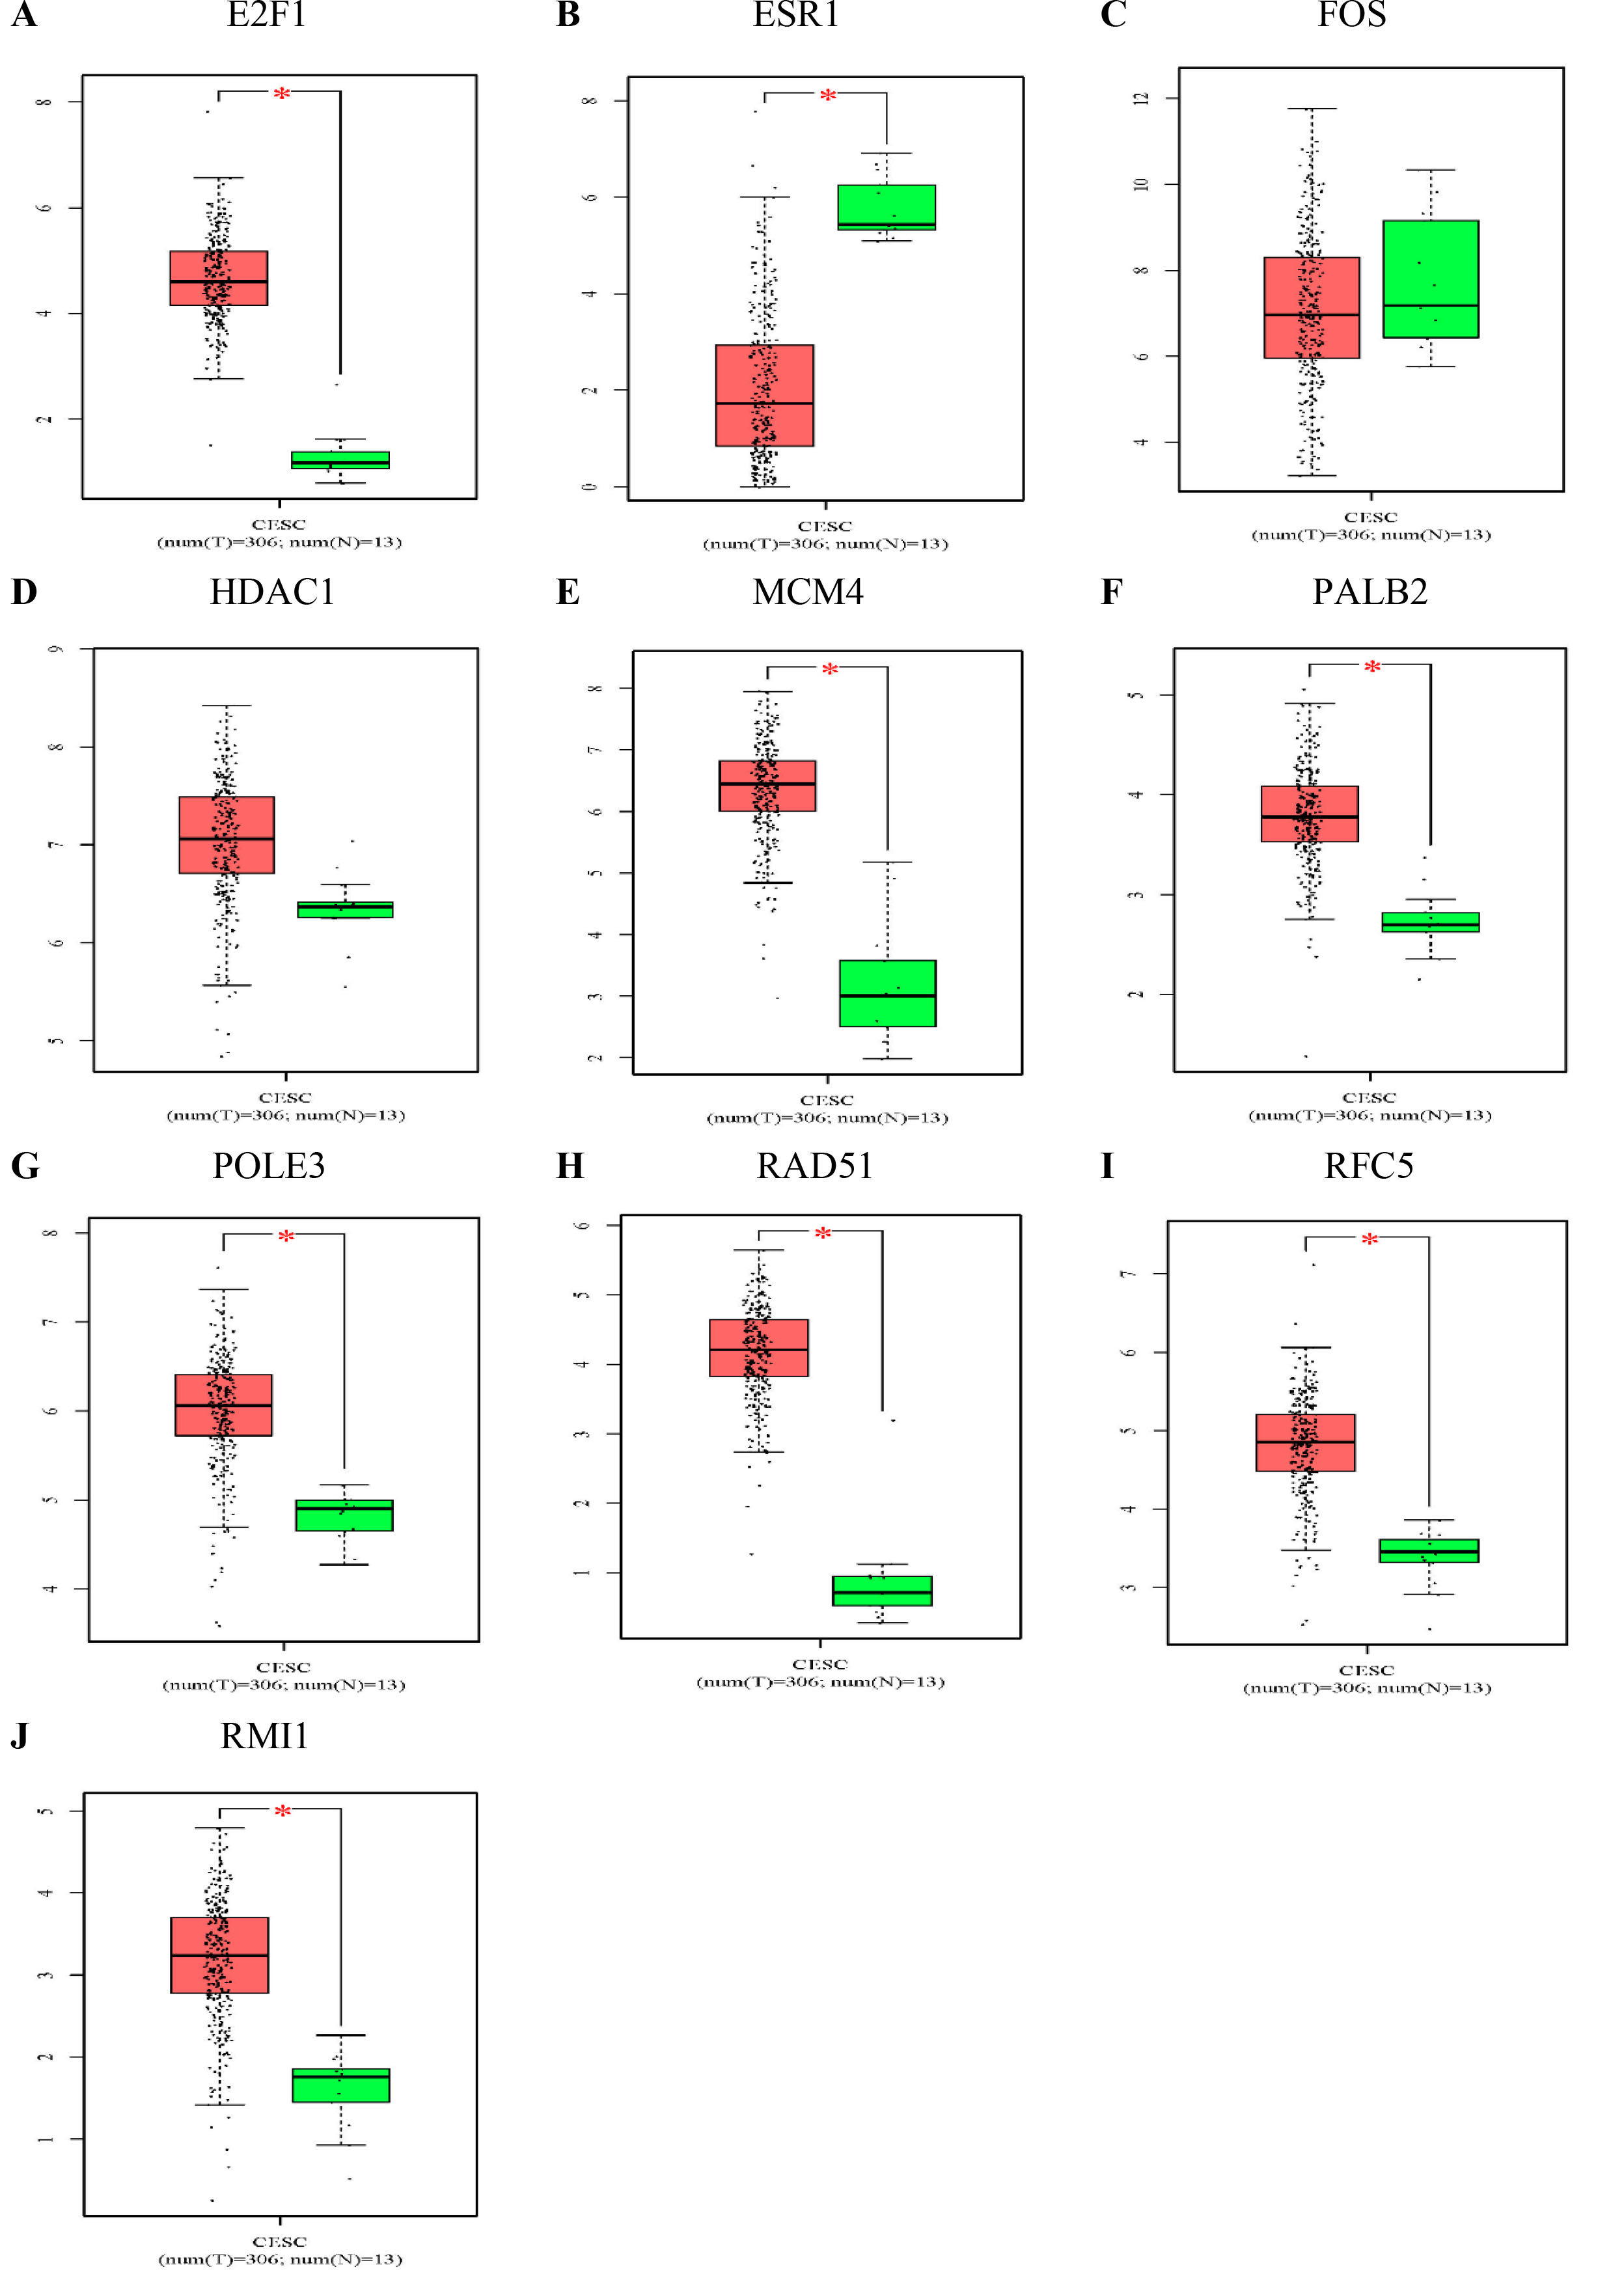
Overall survival (OS) analysis of 10 hub genes in cervical cancer. OS of E2F1 (A), ESR1 (B), FOS (C), HDAC1 (D), MCM4 (E), PALB2 (F), POLE3 (G), RAD51 (H), RFC5 (I), and RMI1 (J) in cervical cancer tissues.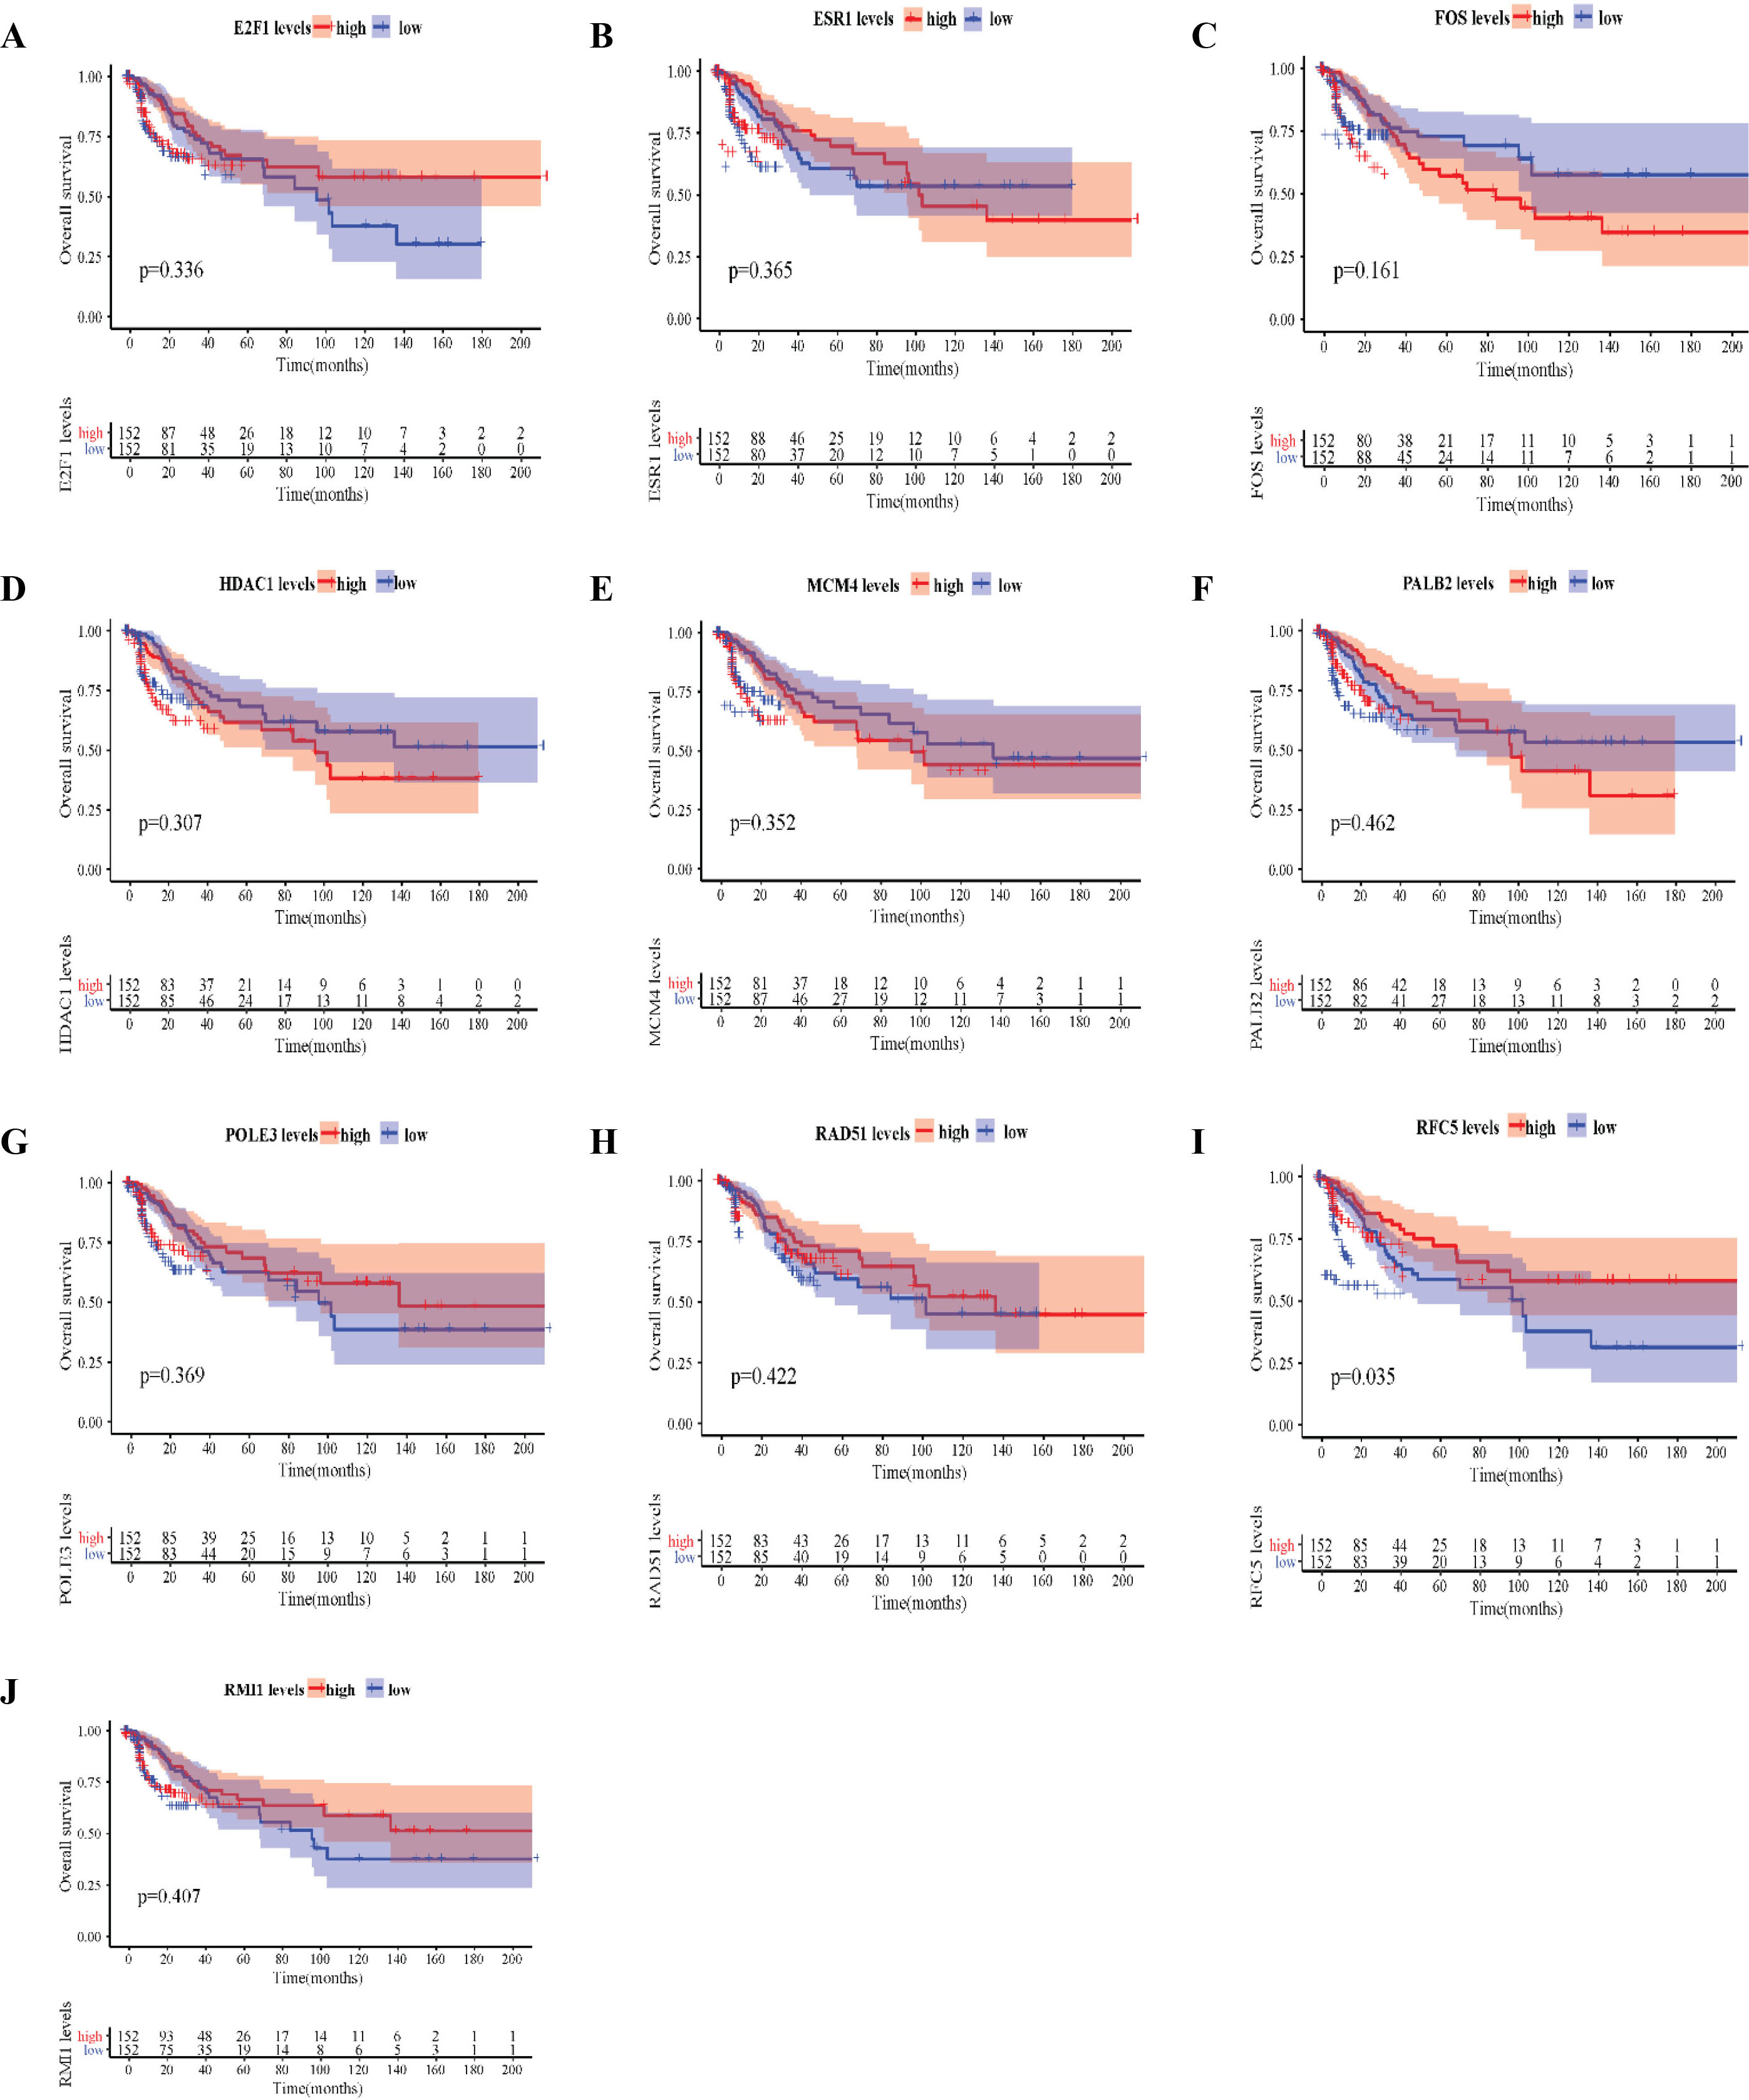
Disease-free survival (DFS) rates of the hub genes in cervical cancer. DFS of E2F1 (A), ESR1 (B), FOS (C), HDAC1 (D), MCM4 (E), PALB2 (F), POLE3 (G), RAD51 (H), RFC5 (I), and RMI1 (J) in cervical cancer tissues.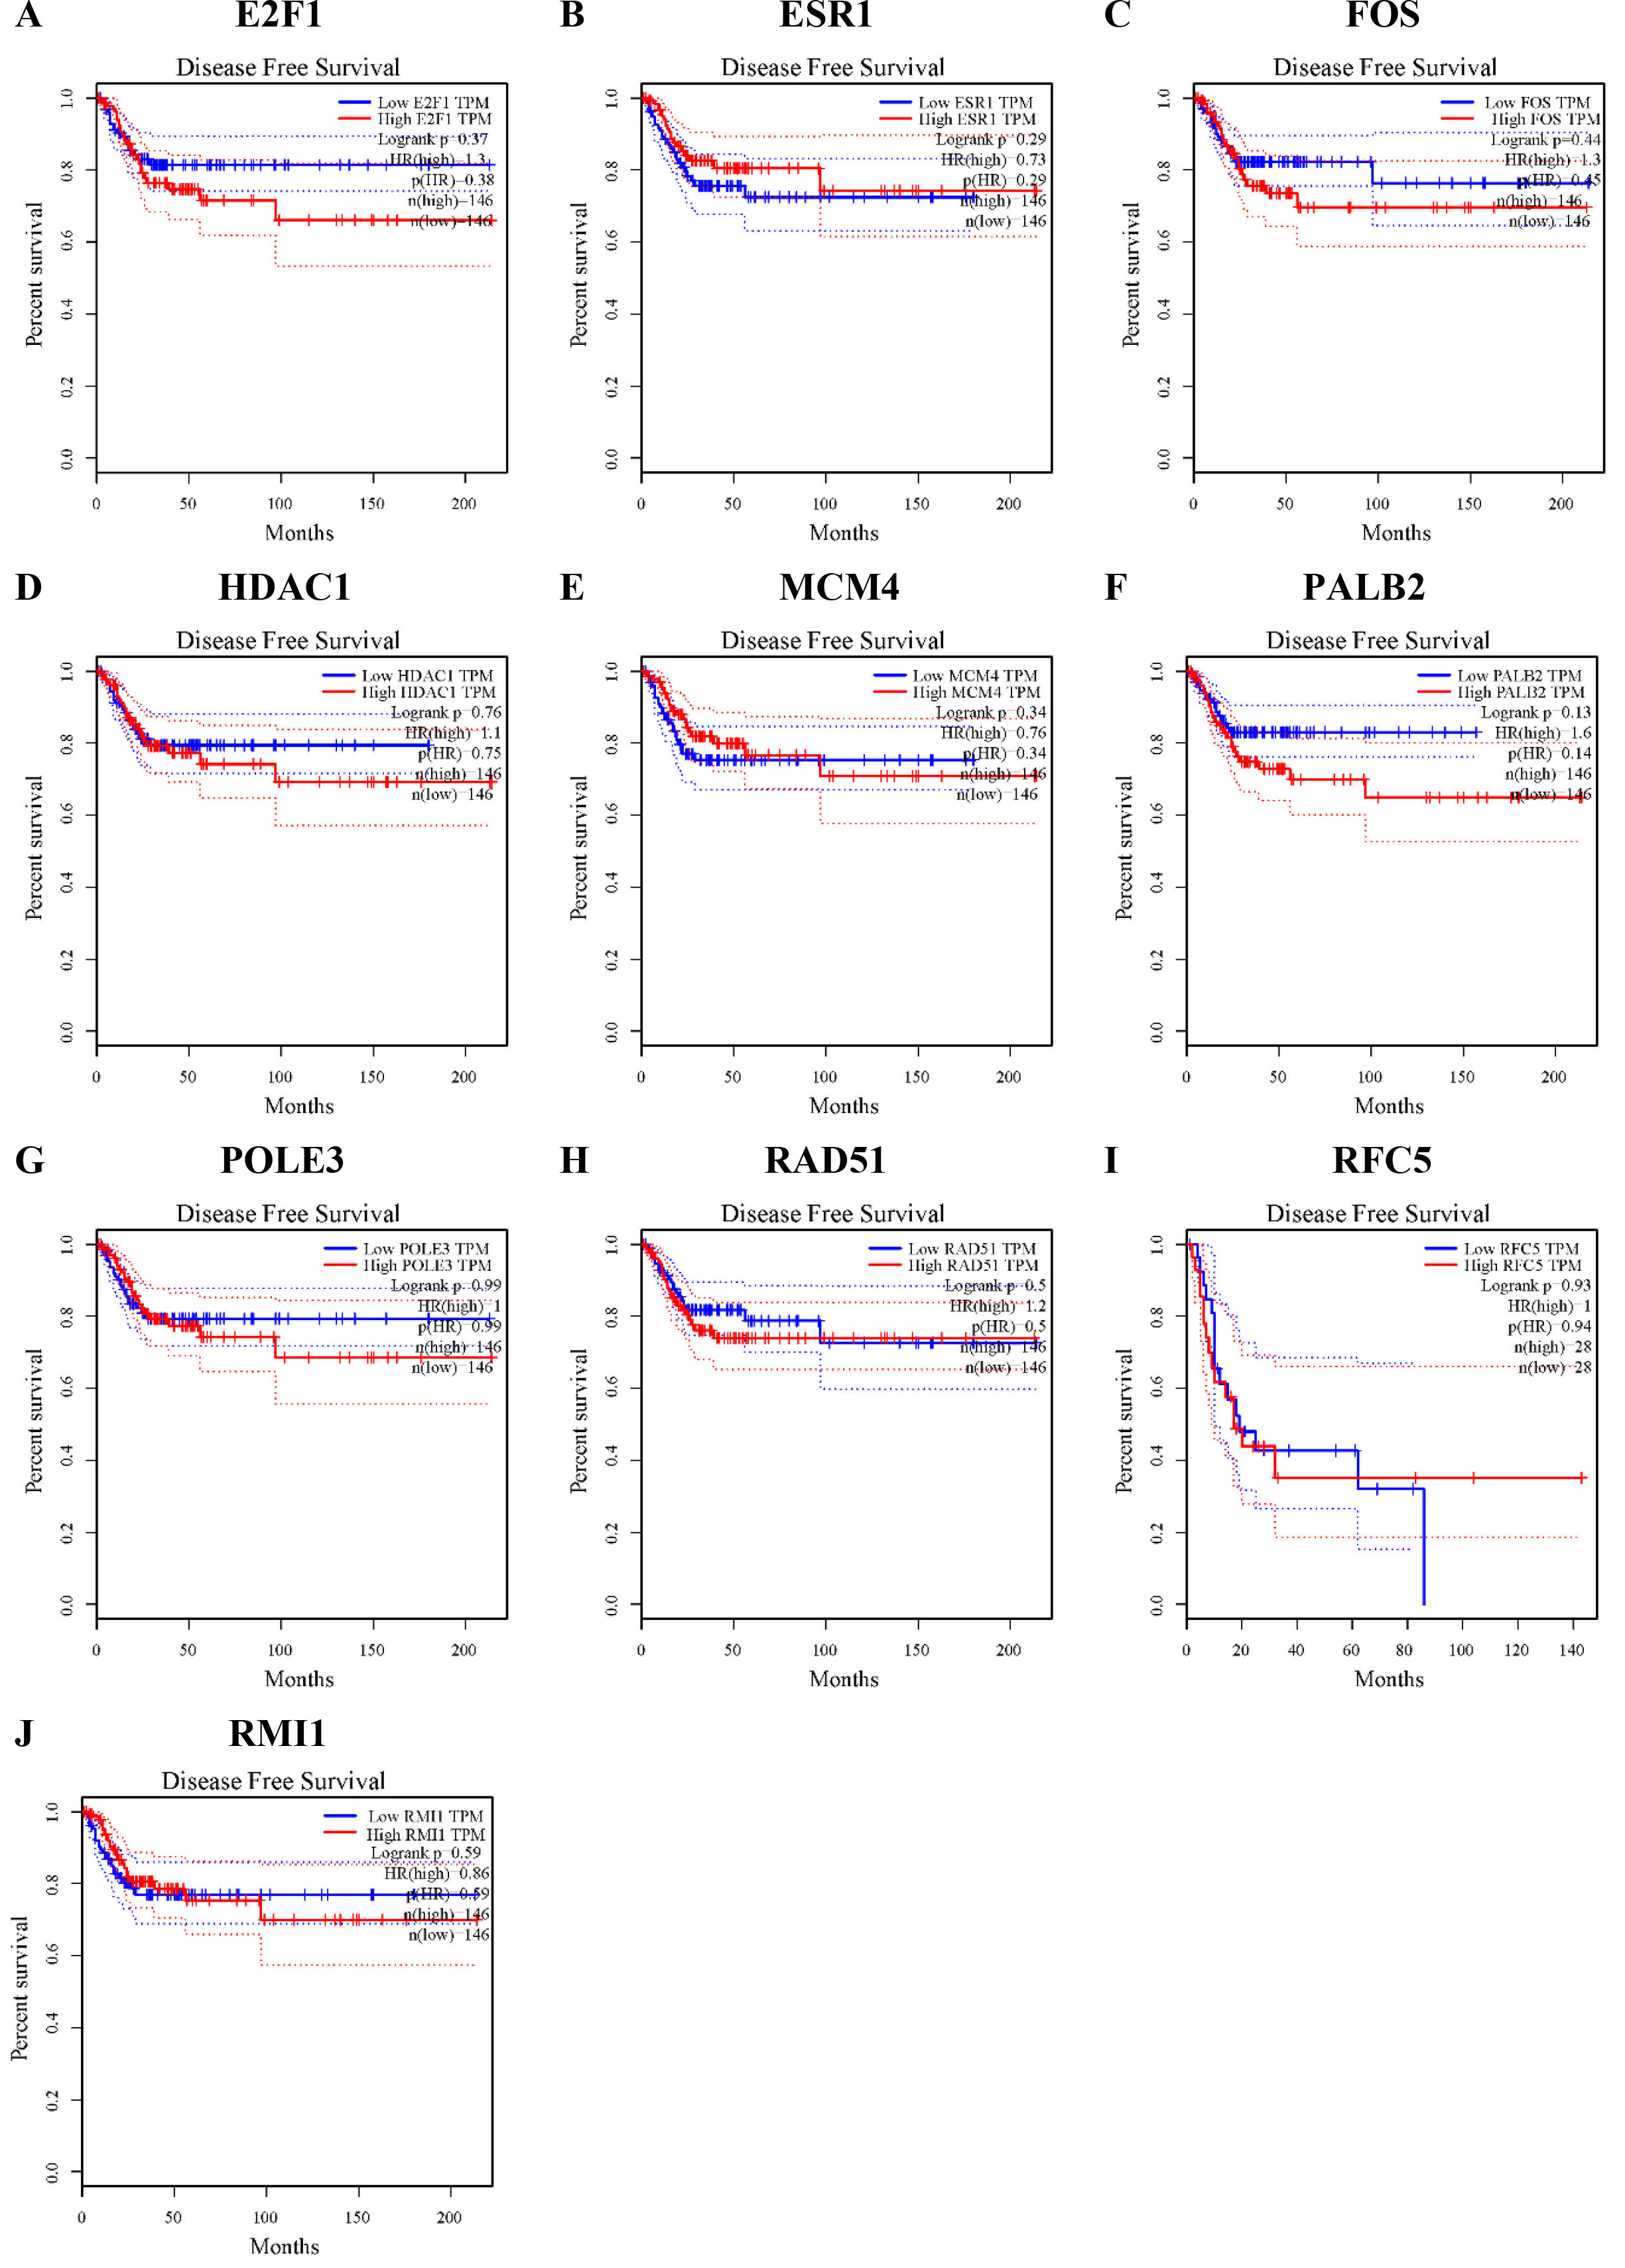
The immunohistochemical staining levels of the survival-related hub gene RFC5 in cervical cancer tissues and normal tissues were verified by the HPA database, and pathological maps were collected (Fig. 9). Compared with that in normal tissues, the protein level of the RFC5 gene in cervical cancer tissues was significantly increased.
RFC5 immunohistochemical staining levels in cervical cancer tissues and normal tissues. A: RFC5 protein level in normal tissues. B: RFC5 protein level in cervical cancer tissues.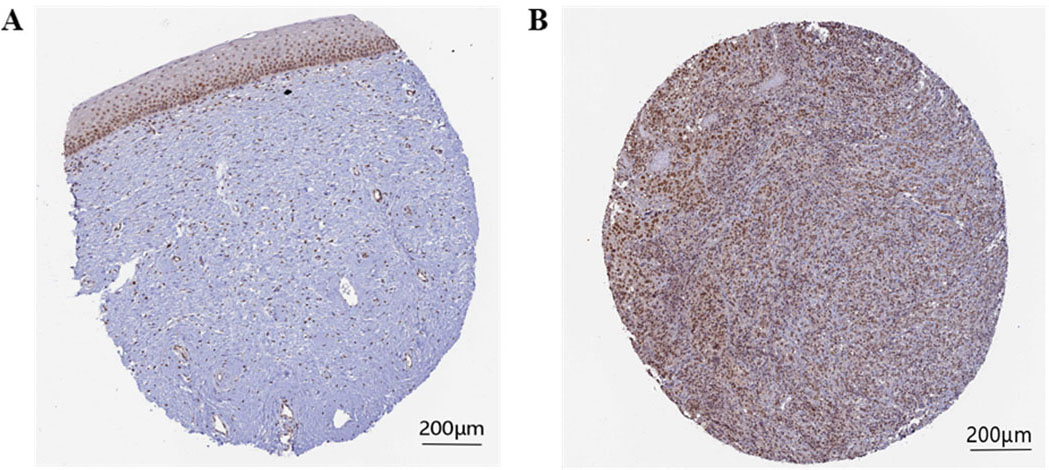
The expression of RFC5 in a variety of tumours. Red represents the increased expression of RFC5, and green represents the decreased expression of RFC5.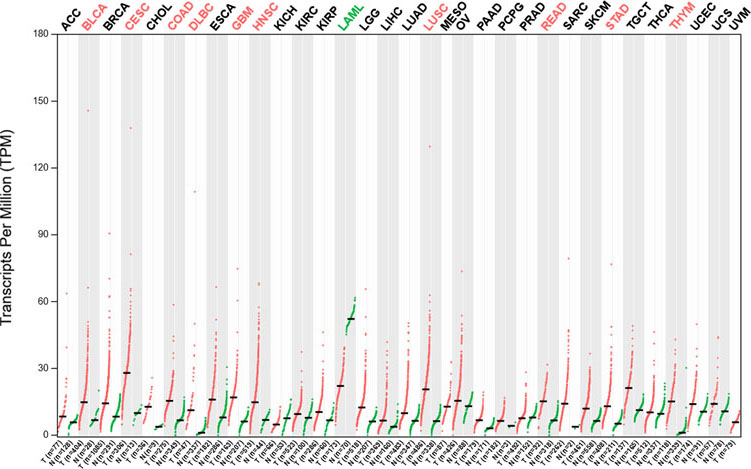
The expression of RFC5 in various tumours was analysed in the GEPIA public database (Fig. 10), and it was found that RFC5 had a higher expression level in various tumours than in normal tissues, such as bladder urothelial carcinoma, cervical cancer, lung squamous cell carcinoma, and rectum adenocarcinoma, and the highest expression level was in cervical cancer.
Discussion
Cervical cancer is a malignant tumour whose incidence is second only to breast cancer in women. Although the prevention and treatment of cervical cancer have been greatly improved, the prognosis and survival rate of patients with advanced cervical cancer is poor. Therefore, the screening significant biomarker is critical as an indicator of cervical cancer progression or prognosis in a medical examination. In our study, a total of 64 differentially co-expressed genes were screened from the TCGA and GEO databases. It was found that these 64 core genes were mainly enriched in DNA conformation changes, chromosomal regions, and ATPase activity, as well as signaling pathways such as microRNAs in cancer, apoptosis, human papillomavirus infection, and pancreatic cancer. Using the CytoHubba plug-in in Cytoscape software, 10 genes, including RFC5, POLE3, RAD51, RMI1, PALB2, HDAC1, MCM4, ESR1, FOS, and E2F1, were selected as hub genes. Their expression levels were further analysed, and it was found that compared with that in normal tissues, RFC5, POLE3, RAD51, RMI1, PALB2, MCM4, and E2F1 were significantly upregulated in cervical cancer tissues, and ESR1 was significantly downregulated in cervical cancer tissues. The expression of RFC5 in CC patients was significantly correlated with the overall survival (OS) rate, but there was no significant difference in the expression level of RFC5 in cervical cancer patients in terms of DFS. The RFC5 protein level verified by the Human Protein Atlas (HPA) database was upregulated in line with the mRNA level in CC samples. Compared with other tumours, RFC5 has the highest expression level in cervical cancer.
RFC5 is a subunit of replication factor C (RFC), and RFC is a protein complex composed of 5 subunits with different sizes and structures. RFC was first purified from human cervical cancer HeLa cell extracts [18]. RFC mainly plays a role in eukaryotes. The RFC complex is a structure-specific DNA binding protein on the replication fork, and its main function is to load proliferating cell nuclear antigen (PCNA) onto the DNA chain in the process of DNA replication and ensure the accurate and efficient extension of the DNA replication chain under the action of human single-stranded DNA binding protein [19, 20]. Human RFC5 is bound to the C-terminus of PCNA, which is also necessary to open the DNA replication folder PCNA, and RFC5 plays an important role in mismatch repair, DNA double helix damage, nucleotide excision, and cell cycle regulation [21]. At present, RFC5 is significantly upregulated in tumour tissues or cells and is positively correlated with the degree of tumour development. Compared with HPV-negative squamous cell carcinoma of the head and neck, the expression of RFC5 is significantly upregulated in HPV-positive squamous cell carcinoma of the head and neck [22]. Compared with normal prostate tissue, RFC5 is significantly expressed in prostate cancer tissue [23]. RFC5 is also relatively highly expressed in the multidrug-resistant leukaemia cell line HL-60R [24]. It has also been found that RFC5 overexpression is significantly associated with the poor prognosis of tumours; for example, its overexpression in tumour tissues prior to isolated hepatic perfusion is significantly related to prognosis [25]. Previous reports have shown that overexpression of SIX1, which plays a major role in regulating DNA replication in cervical cancer, can upregulate the expression of RFC5 [26]. In our study, it was found that compared with normal tissues, RFC5 was significantly upregulated in cervical cancer tissues and was significantly related to the OS of cervical cancer patients.
The present study investigated the prognostic value and the potential biological functions of RFC5 in cervical cancer. A large number of studies have proved that RFC5 play a critical role in DNA replication and gene recombination repair and even the tumorigenesis of many cancers [19, 21]. Our study also demonstrated that RFC5 was closely associated with the prognosis of cervical cancer. RFC5 could be further explored and validated as a potential predictor and therapeutic target for cervical cancer.
Footnotes
Acknowledgments
This study was supported by the National Natural Science Foundation of Liaoning Province (No. 201601048) and Fundamental Research Funds for the Central of China (No. DUT16QY28).
Author contributions
Conception: Simei Tu
Interpretation or analysis of data: Simei Tu, Hao Zhang, Xiaocheng Yang, Wen WenKangjing Song, Xinyi Yu
Preparation of the manuscript: Simei Tu
Revision for important intellectual content: Simei Tu, Xinjian Qu
Supervision: Xinjian Qu