



Abstract
We aimed to evaluate hemodynamic parameters in the cutaneous microcirculation during recovery to graded dynamic exercise performed on a cycloergometer by using two distinctive methods: high-frequency ultrasound Doppler flowmetry (UDF) and laser Doppler fluxmetry (LDF). Regarding UDF, the medium linear blood flow velocity (Vam) was estimated, expressed in absolute units (cm/s) whereas blood flow assessed by LDF was registered in arbitrary perfusion units (PU). We compared the corresponding perfusion values obtained by UDF and LDF, respectively, every 20 s during recovery period to physical exercise. Three types of microvascular blood flow dynamics were recorded: blood flow with an occasional paroxysm, a pulsatile blood flow pattern, and a shunting-type blood flow pattern. In the first type, the reaction time of registration and the direction of changes of UDF and LDF values coincided in 77.7%, exhibiting high correlation (r = 0.77; p≤0.001). In the second type, the direction of changes of UDF and LDF showed 85.0% similarity and a moderate correlation (r = 0.66; p = 0.0015), whereas in the third type, there was also a moderate correlation (r = 0.53, p = 0.0024). Our pilot experiments have shown that UDF could be regarded as a comparable substitutional method to LDF for studying skin microcirculation.
Keywords
Introduction
An accurate assessment of both qualitative and quantitative parameters of regional blood flow represents an unmet clinical need as clinical course of many diseases is tightly correlated with microcirculatory function. Microvascular blood flow is continuously adjusted to metabolic requirements of the tissue by means of different regulatory mechanisms, including myogenic, endothelial and metabolic responses [2, 23]. Assessment of microcirculatory function is crucial for better understanding of the mechanisms underlying the progression of cardiovascular diseases [8], systemic sclerosis [26], endocrine and metabolic diseases [1], critical illness [10], etc. Therefore, it is essential to obtain the dynamic values of tissue blood flow, which implies real-time monitoring of microcirculatory function in the clinical settings.
However, non-invasive evaluation of microvascular blood flow in patients is technically challenging due to several reasons. First, the direct observation of microvasculature is only possible in the skin, fundus of the eye, conjunctiva and mucosal layers of certain organs [14]. Second, the microvascular bed is characterized by complex architecture and functional heterogeneity, which complicates the registration process and might affect the reproducibility of the data obtained in different physiological and pathological states.
Laser Doppler fluxmetry (LDF) is one of the most commonly used techniques for non-invasive assessment of microcirculatory parameters [22]. The use of high-frequency ultrasound Doppler flowmetry (UDF) represents an alternative approach based on Doppler phenomenon. The wavelengths of LDF and UDF lie in the same range and are equal to 550 and 600 nm, respectively [3, 5]. The use of these wavelengths provides an opportunity to study blood flow at the tissue level and, very importantly, microcirculatory blood flow. There are numerous reports on the use of UDF in clinical medicine, particularly in dentistry [18, 20]. There are a lot of studies about blood flow measurements e.g. in transplanted flaps using contrast enhanced ultrasound [7]. At the same time, different physical properties of the waves that are used in these two methods determine significant differences between them.
The measurement of cutaneous blood flow at rest provides only limited information about the microcirculatory function and should be complemented by functional tests which stimulate blood flow changes. Functional tests are therefore aimed to investigate changes in vessel reactivity and potential adaptive mechanisms [11, 15]. One of the commonly used functional tests is graded physical exercise, which results in increased heat production and cutaneous vasodilation [4, 16]. The study of cutaneous blood flow during and after physical exercise is an important issue because exercise testing is very often used in cardiology in order to determine the patient’s tolerance to physical work. In this regard, the use of additional non-invasive technique of vessel reactivity assessment would be of great interest.
In this study, we aimed to compare the data on cutaneous blood flow obtained by LDF and UDF in healthy volunteers subjected to exercise testing.
Materials and methods
Ten healthy volunteers (3 women and 7 men aged from 19 to 27 years) were enrolled in the pilot study which was conducted at Institute of Physiology, Medical Faculty, University of Ljubljana, Slovenia. Informed consent was obtained from all patients. The study was approved by the Slovenian National Ethics Committee. Hemodynamic parameters were recorded in the sitting position of the participant, prior to cycloergometry testing and continuously for the subsequent 20 minutes in the recovery period (RP) to exercise. Cycloergometry test was performed 30 minutes after an adaptation period in the laboratory with a temperature range 23–25°C. Graded protocol on the cycloergometer was used according to our previous studies [21] with an initial exercise load of 40 W and a stepwise (50 W) load increment with each step lasting for three minutes. The test was stopped when the submaximal heart rate (85% of the maximal predicted heart rate according to the formula: ‘220 – years of age’) was achieved. During the test, the following parameters were simultaneously recorded: standard electrocardiogram (ECG), brachial artery blood pressure (measured every three minutes), and the cutaneous blood flow simultaneously with skin temperature over the corresponding measuring sites.
The parameters of the microvascular blood flow were registered simultaneously by LDF and UDF techniques. During the experiment, both arms of the volunteer were relaxed and positioned in the prone position on a smooth surface at the heart level. The position of the probes remained unchanged throughout the entire experiment, including exercise test.
The LDF measurements were performed on the middle finger nailfold using laser flowmeter Periflux PF5010 LDPM (Perimed, Stockholm, Sweden). The principles of laser Doppler fluxmetry have extensively been described elsewhere [21]. The depth of laser light penetration in the tissue is approximately 1 mm. Tissue perfusion per unit of time is expressed in relative perfusion units (PU). Since tissue perfusion at the level of microcirculation is remarkably heterogeneous, we used mathematical analysis of random processes with subsequent determination of mean values.
The UDF measurements were performed on the contralateral hand in the same area (middle finger nailfold) using high-frequency (20 MHz) ultrasound Doppler device (Minimax, St.-Petersburg, Russian Federation). The ultrasound probe was fixed in a special holder, which prevented its displacement during the procedure and thus minimized the artifacts related to alterations either in the angle of the location or in the distance between the probe tip surface and the skin. The depth of ultrasound penetration in the tissue varies between 3 and 5 mm while the angle of location equals 60°. Microvascular blood flow is registered in the form of patterned Doppler images, which were qualitatively and quantitatively analyzed after the procedure. The qualitative parameters included the direction of blood flow, blood flow density, and sound characteristics of the flow. Quantitative parameters were linear blood flow velocities in the tissue under scrutiny. The maximum linear systolic velocity (Vs) and maximum linear diastolic velocity (Vd) were derived from the spectrum envelope (shown in purple in Fig. 1), characterizing the maximal velocity of red blood cell movement in the microvessels of the transsonicated tissue volume. Computer-based analysis of Doppler images allows to average all velocity parameters registered in the vessel lumen or tissue volume, which gives the true mean blood flow velocity or weighted mean velocity. The average linear systolic velocity (Vas) and average linear diastolic velocity (Vad) are derived from weighted mean velocity curve, which is shown in green in Fig. 1. The average maximum linear blood flow velocity during cardiac cycle (Vm) and average mean linear blood flow velocity during cardiac cycle (Vam) are also derived from weighted mean velocity curve (Fig. 1). Weighted mean velocity curve-derived parameters are more valuable in the assessment of microcirculation because of higher sensitivity to low velocities observed in the microvascular bed.
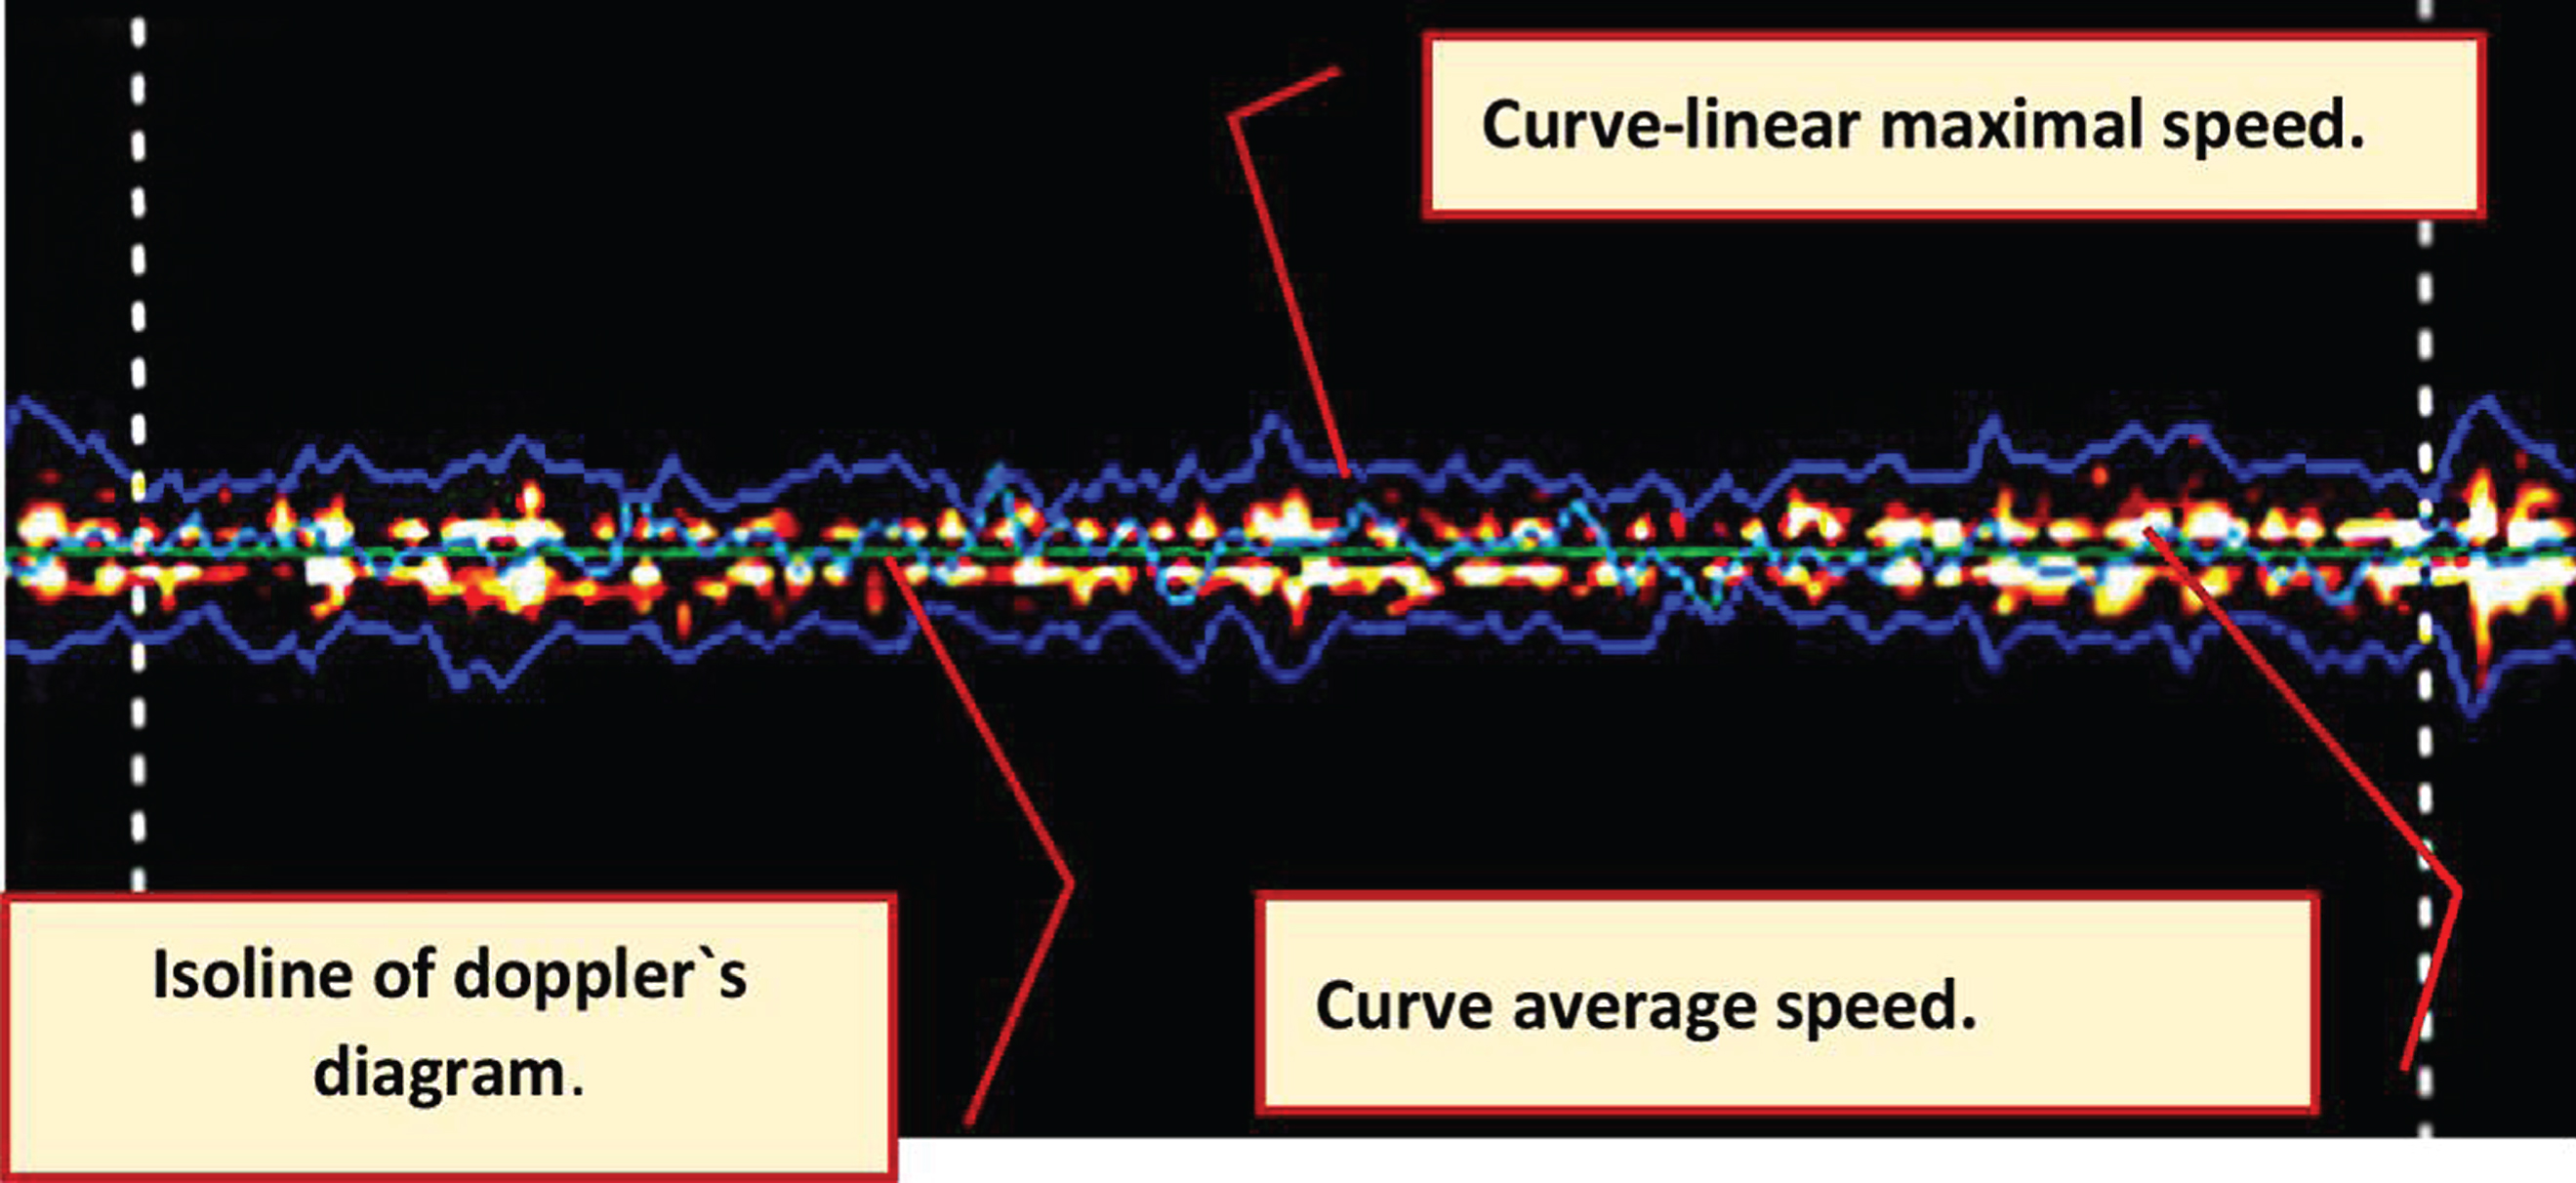
A typical aspect of the Doppler image obtained by UDF in a healthy person. Microcirculatory bloodstream with mainly capillary filling is presented. Curve-linear maximal speed: hemodynamic parameters at arteriolar and venular level (Vs, Vm, Vd in cm/s). Curve average speed: hemodynamic parameters at the capillary level (Vas, Vam, Vad in cm/s).
As LDF and UDF techniques estimate blood flow in different units, we correlated the results by means of comparing the dynamics of the parameters obtained in the same time points by two techniques. Each of the parameters in a certain time point characterizes the baseline function of the microcirculation while the dynamics of changes rather reflects functional adaptation evoked by exercise testing. During physical exercise itself, the Doppler images obtained by both LDF and UDF contained multiple motion artifacts. Therefore, the dynamic changes in blood flow parameters were analyzed and compared only during the 20-min RP.
Statistical analysis of the correlation of hemodynamic values, obtained by LDF and UDF, was conducted by nonparametric method of Spearman correlation analysis with confidence interval of 95%.
Regarding UDF, the baseline Vam was 0.62+0.145 cm/s. As for LDF, the baseline LDF was 31.3+9.4 PU. Recovery to physical exercise was characterized by significant changes of both perfusion values, i.e. Vam and PU, implicating alterations of the vascular tone (from vasodilation to vasoconstriction).
In the recovery, three distinctive types of predominant blood flow pattern were observed on the Doppler image using UDF as well as LDF.
The representative tracings of three most typical types of reactions are presented (Figs. 2–4). Two scales are shown in graphs: on the left, there is a normalized scale (where the maximum values of PU and Vam for each type of reaction are taken as unity) highlighted in blue. On the right (highlighted in black), there is a scale in absolute units.
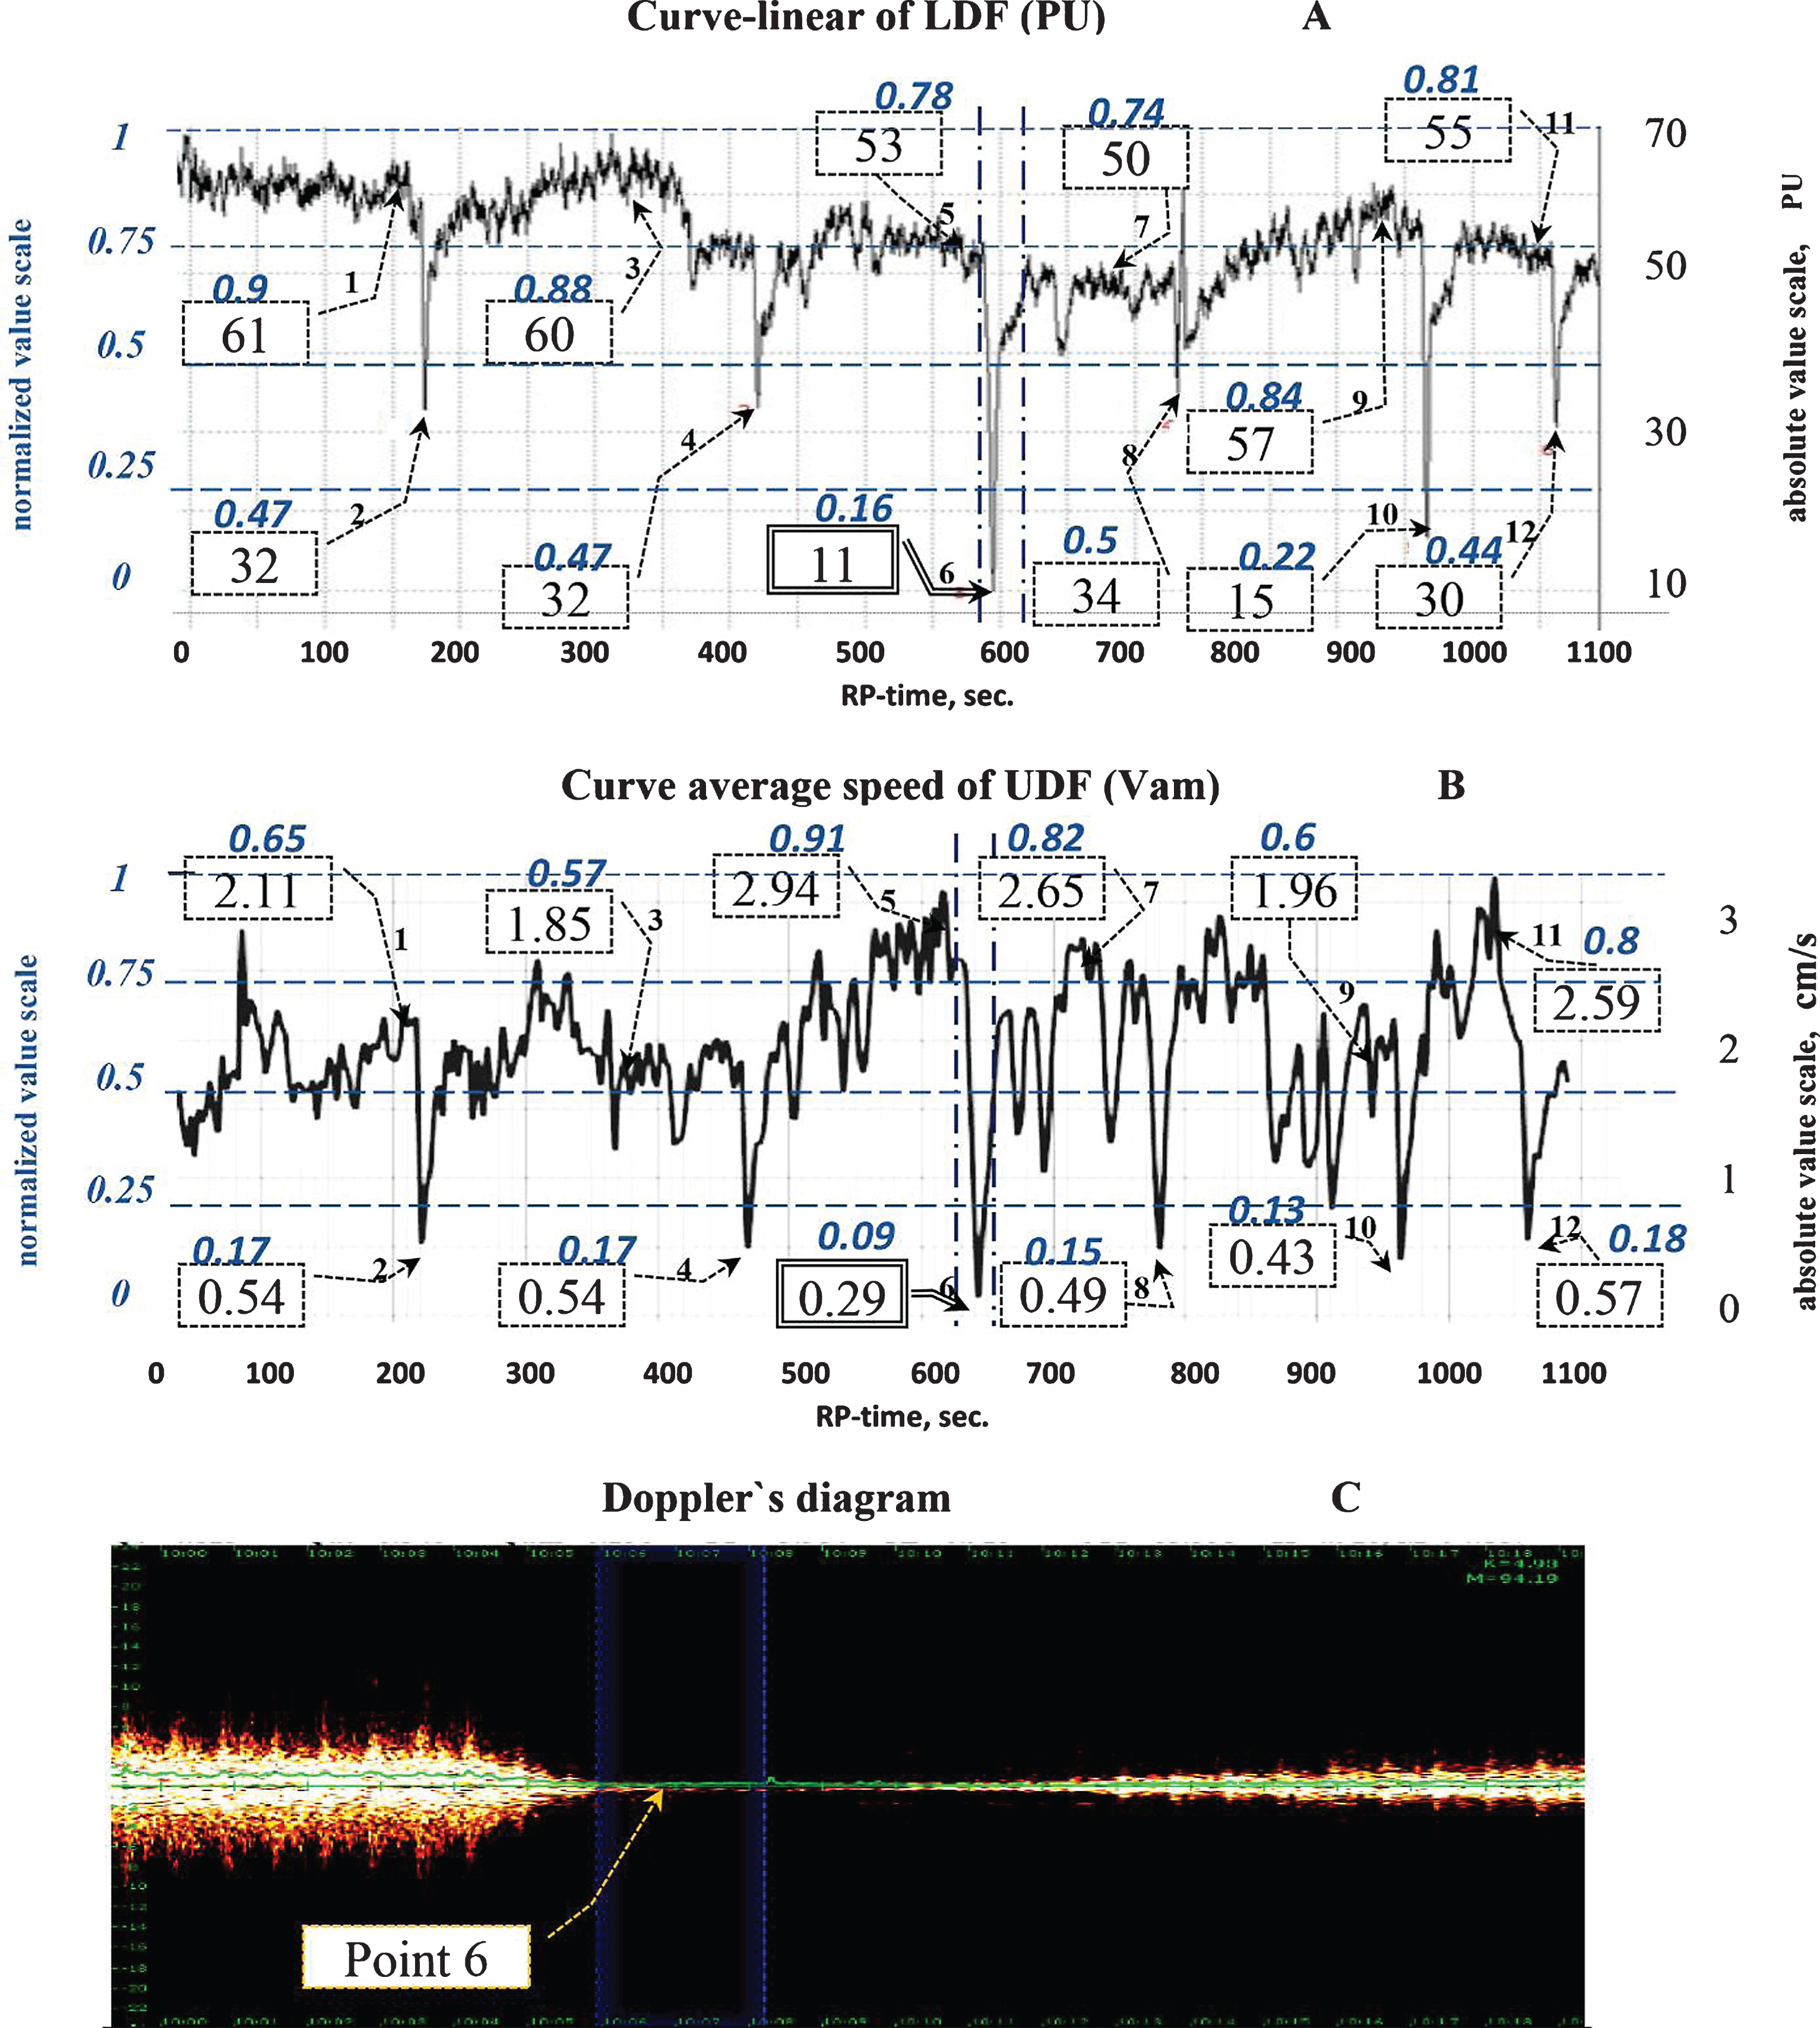
The parameters of blood flow in cutaneous microcirculation, assessed by LDF and UDF. The first type of reaction is shown. A – a typical tracing obtained by LDF, B – mean linear velocity (Vam), obtained by UDF. The left blue color: normalized units-scale and values, the right black color: absolute units-scale and values. C – a representative Doppler image obtained by UDF.
In Fig. 2, the first type of microvascular perfusion response is presented, characterized by clear episodes of short-time decrease of PU of LDF, with a concomitant decrease of Vam in UDF. After termination of exercise, Vam was 61% higher than the baseline Vam on the average. Then, short-time 46.4% decreases were observed. Similarly to UDF, also the PU of LDF increased by 40.3% on the average with sudden drops of flux by 35.7% regarding baseline values. This type of reaction was observed in four persons.
The time of recording and the direction of changes of the values, obtained by LDF and UDF, coincided in 77.7%, showing a high correlation (r = 0.77; p = 0.000032).
The second type of blood flow alterations in the recovery is shown in Fig. 3 Vam assessed by UDF increased by 93.6%, the decreases of Vam were less significant and attained values of a 34.3% drop regarding baseline values. As for LDF, the PU values increased by 125.2% and decreased by 5.7%. Lower correspondence of Vam and PU may be caused by rare artefactual signals that couldn’t be avoided while using both methods. The correspondence of the direction of the Vam and PU dynamics comprised 85.0%, showing rather moderate correlation (r = 0.66; p = 0.001495). This type of reaction was observed in four persons.
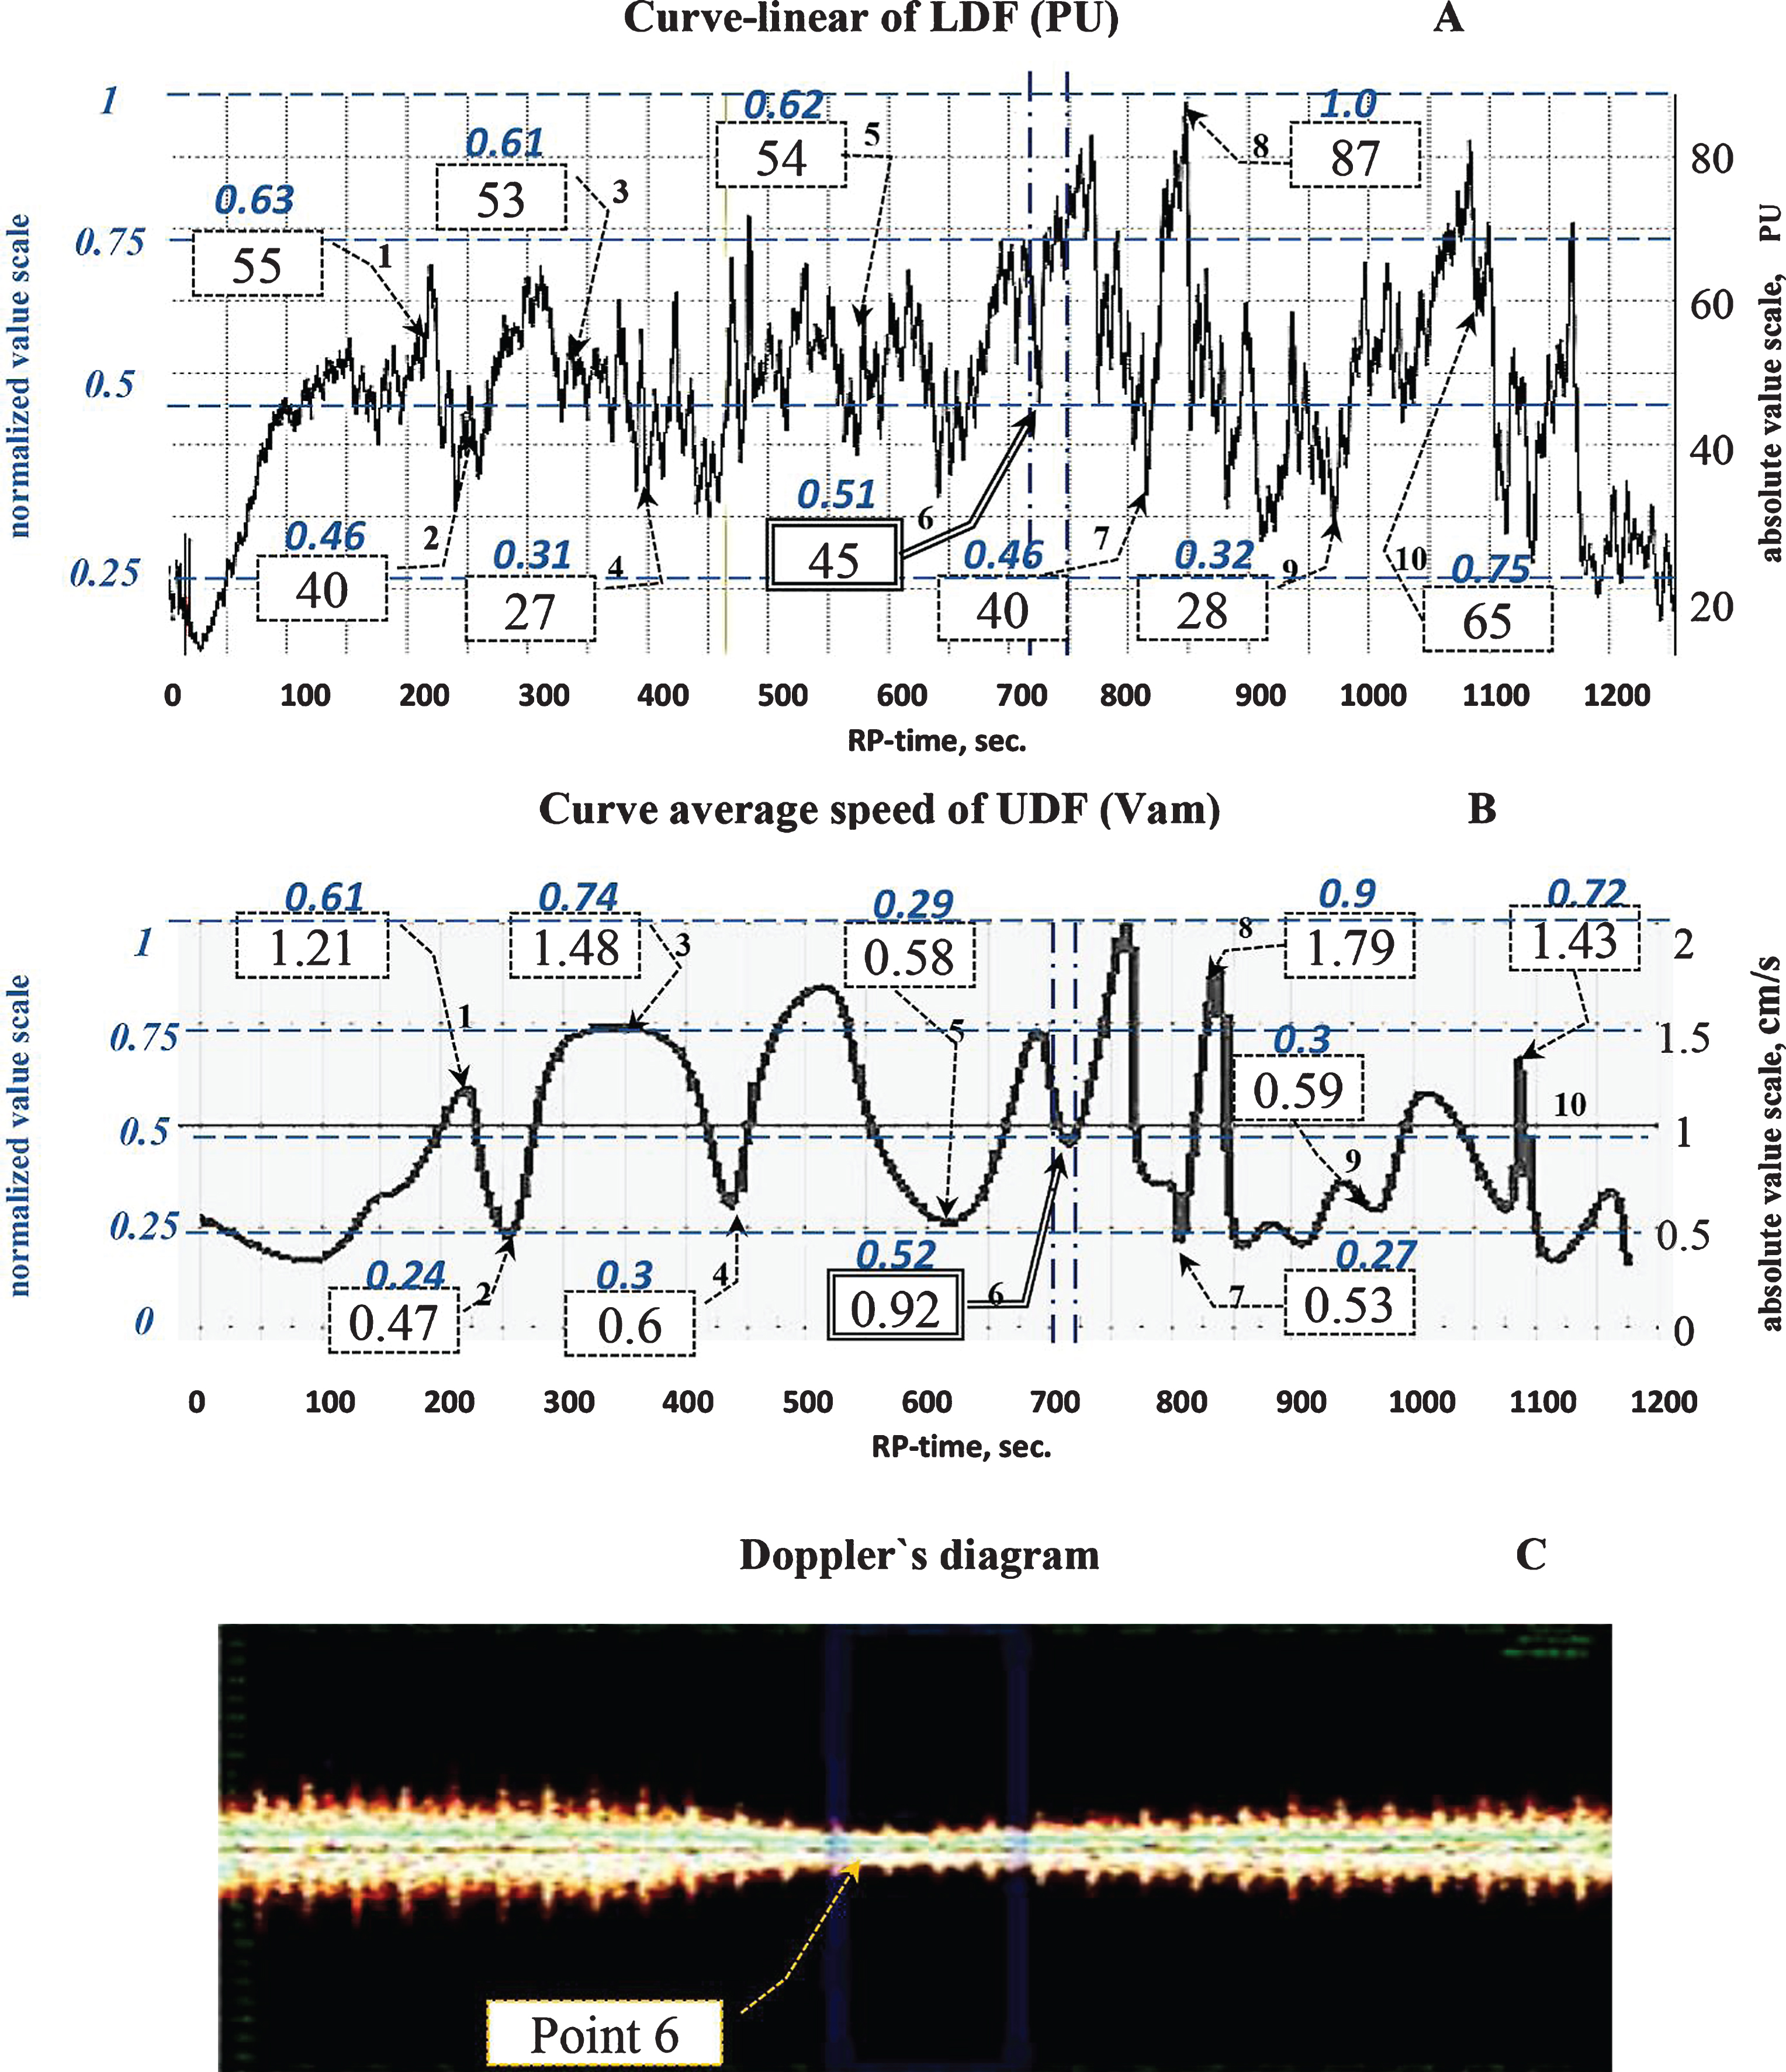
The second type of microvascular perfusion in skin microcirculation assessed by LDF and UDF in the recovery to dynamic exercise. A – a typical tracing obtained by LDF, B – mean linear velocity (Vam), obtained by UDF. The left blue color: normalized units-scale and values, the right black color: absolute units-scale and values. C – a representative Doppler image obtained by UDF.
In the third type of microvascular perfusion during recovery, shown in Fig. 4, no marked blood flow fluctuations were registered (Fig. 4). This type of reaction was only observed in two participants. However, it is interesting that from the 15th minute and up to the end of recovery, a shunting blood flow pattern with a characteristic presentation of the Doppler spectrum and an audible signal obtained by UDF was clearly observed. Vam increased by 56% in the 15th minute (point 1 B), subsequently additionally increasing by 140.6% (point 6 B) in the ‘shunting-blood-flow-period’ compared to the baseline value. Red spectrum was observed on the Doppler image at maximal distance from the isoline. It characterizes the opening of arterial and venular bypasses and shunts, through which the blood by-passes the capillary network. As for LDF, the flux increased by 135% by the 15th minute (point 1 A). This period was characterized by very high PU values, reaching as high as 250–350 absolute PU. In the period of late recovery exhibiting potential shunting of blood flow, only moderate correlation of Vam and PU was observed (r = 0.53, p = 0.00235).
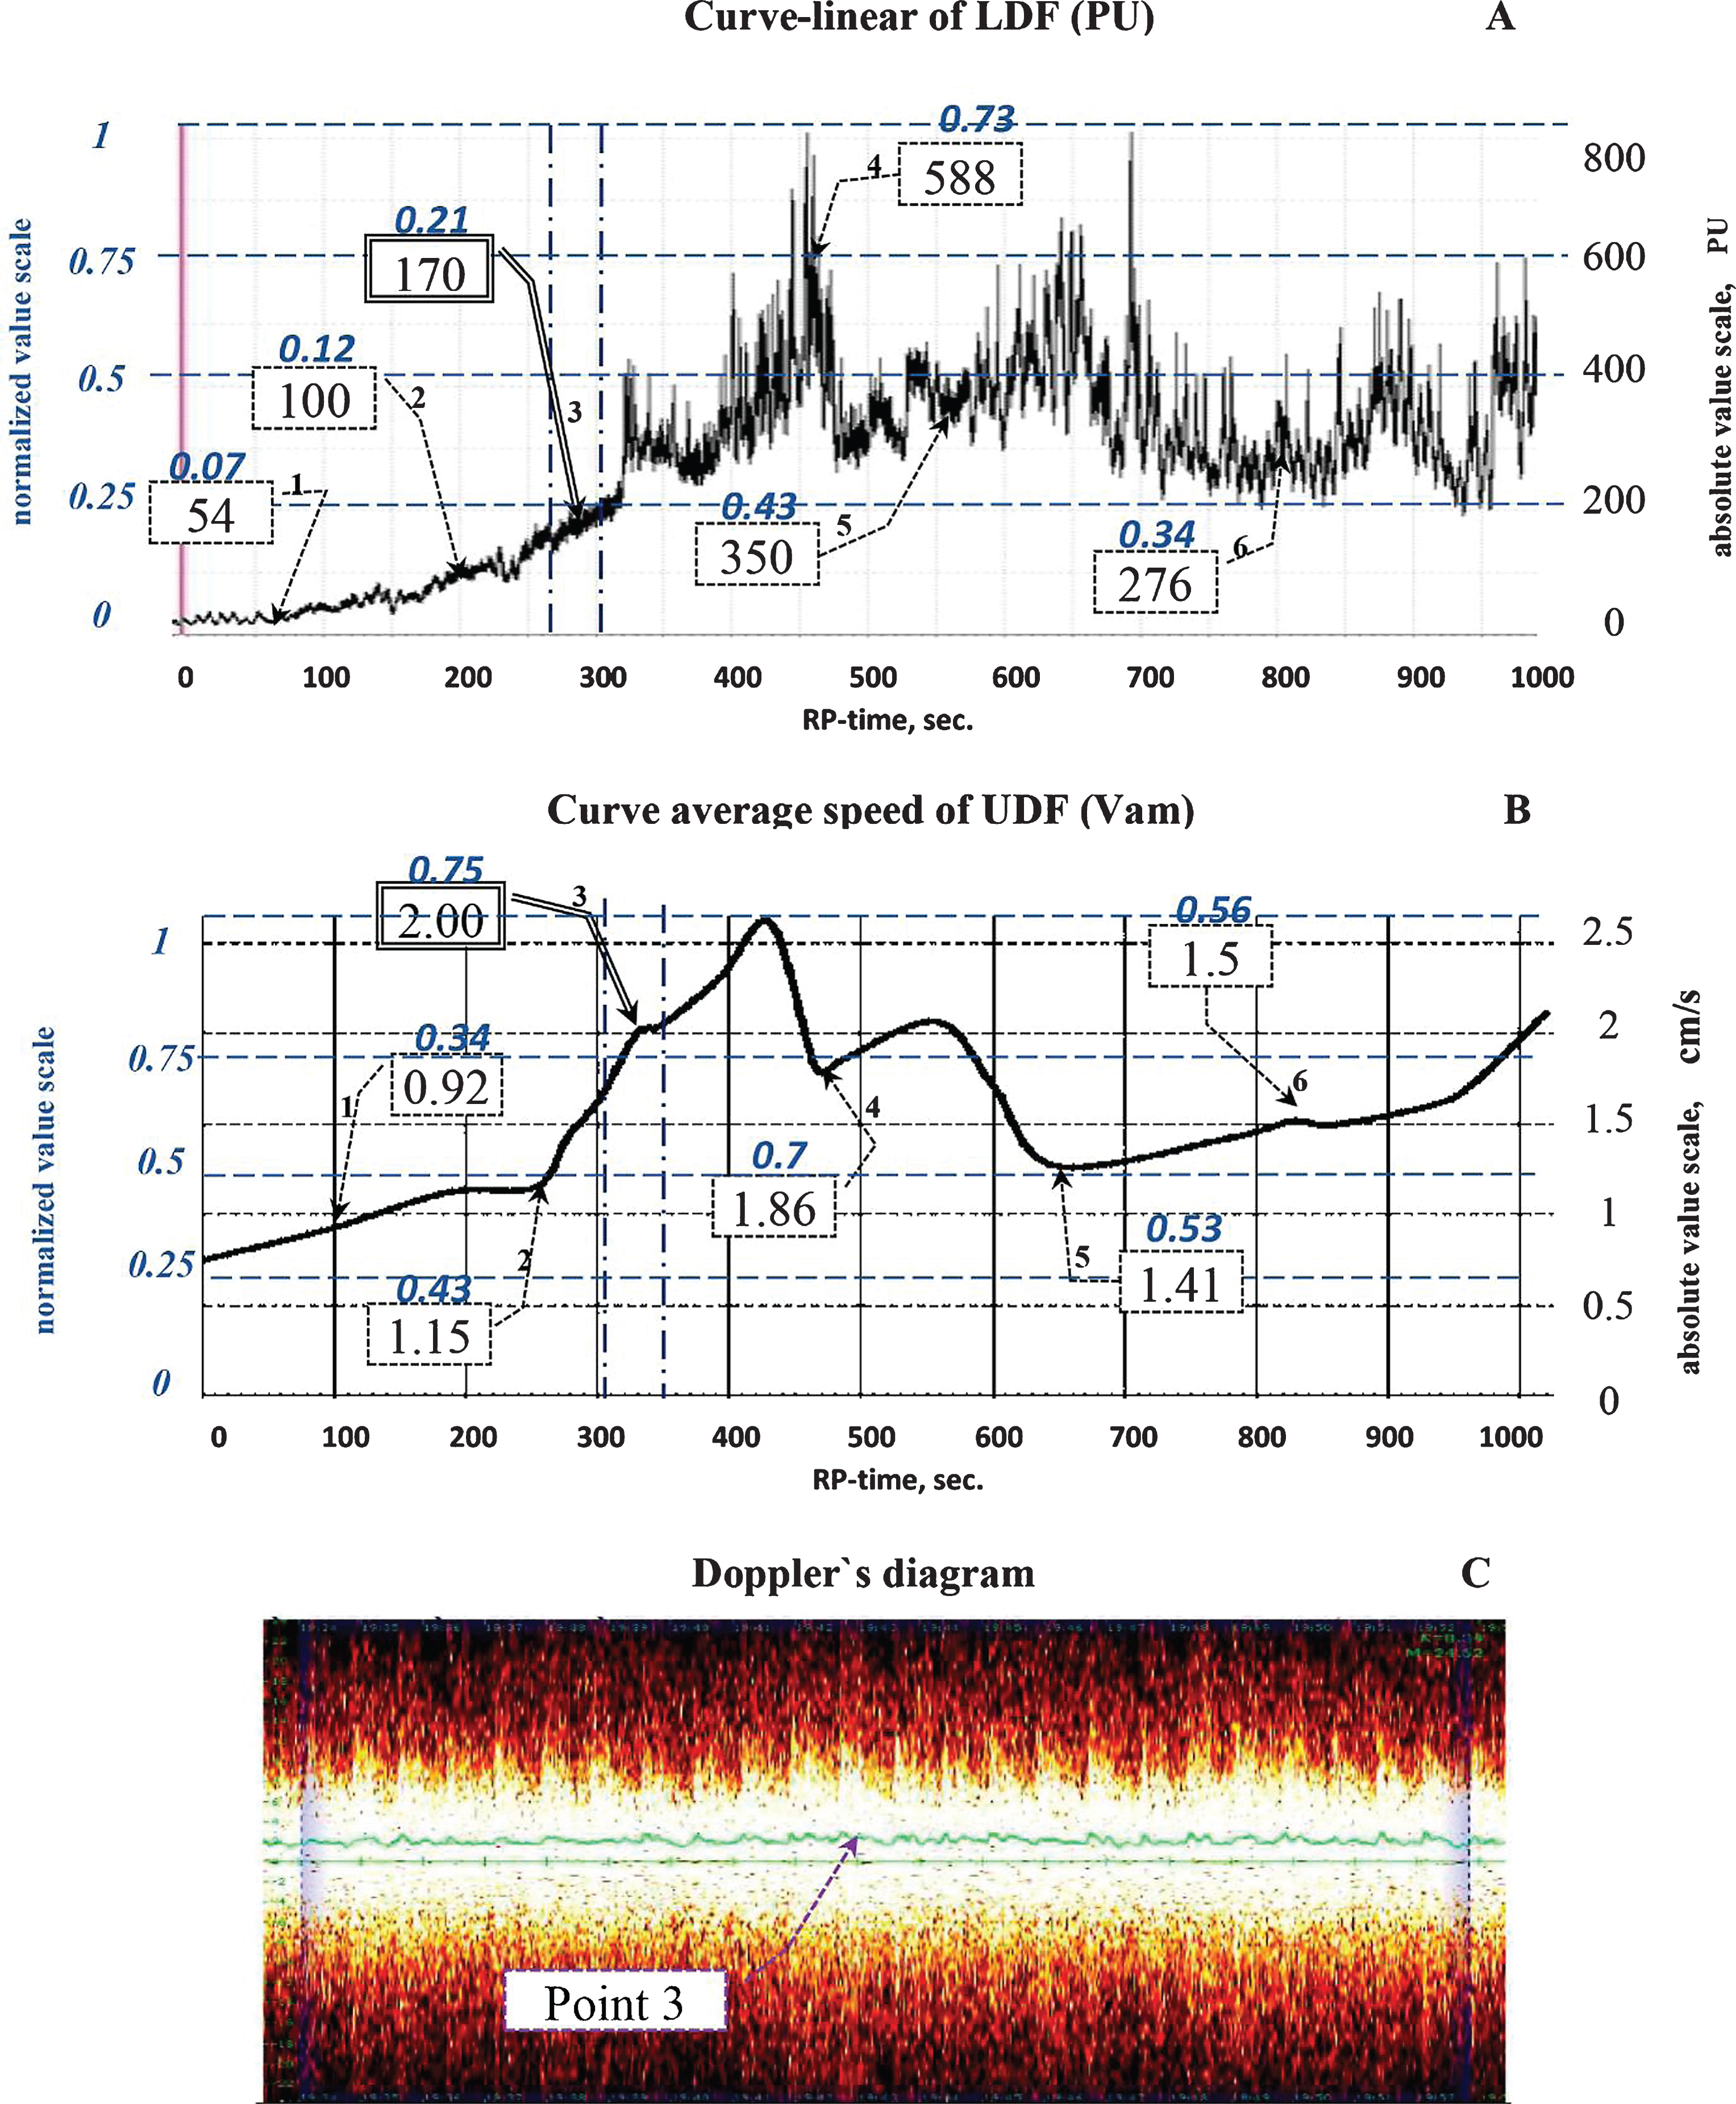
The third type of microvascular perfusion in skin microcirculation assessed by LDF and UDF in the recovery to dynamic exercise. A – a typical tracing obtained by LDF, B – mean linear velocity (Vam), obtained by UDF. The left blue color: normalized units-scale and values, the right black color: absolute units-scale and values. C – a representative Doppler image obtained by UDF.
During physical work, the functioning of microcirculation is directed to maintain an optimum level of skeletal muscles oxygenation. Parameters characterizing the condition of the cardiovascular system and, accordingly the microcirculation can achieve threshold limit values. After termination of exercise, reconstruction of blood flow subsequently takes place in the body and that is why this transient condition from stress to rest represent a good model to investigate morphological and functional changes in the microcirculation [11, 13].
While comparing LDF and UDF to investigate the microcirculation, it should be noted that regarding LDF, setting of zero point and instrument calibration before every measurement are prerequisites, and the assessment of perfusion is only possible in relative PU [22]. In contrast, UDF does not require a zero-point setting or calibration procedure; rather than relative perfusion, UDF can reveal the absolute velocity of the moving blood in cm/s.
In our UDF investigation, we used an ultrasound probe with a frequency of 20 MHz. As shown in previous investigations [3], the 20 MHz-sensor can assess tissue perfusion at depths up to 0.8–1.0 cm and determine slow blood flow with the velocity lower than 0.05 cm/s. Thus, the 20 MHz frequency sensor enables to measure integral indicators of linear velocity of blood flow in small volumes of tissues and the microvascular perfusion.
The diameter of investigated vessels comprises on the average from 10*10-3 to 60*10-3mm and the baseline blood flow speed in our investigations varied from 0.25 to 0.87 cm/s, which is consistent with data that have been published earlier [4]. If blood flow velocity exceeds 1.0 cm/s, the arteriolar component, presented in the form of a pulse wave typical for vessels of larger diameters is observed on the Doppler image. It confirms a good sensitivity of the method, as positive correlation between vessel diameter and blood flow velocity has been reported [19].
From point of view of an accurate microcirculation monitoring and the determination of type of reaction to exercise, the sensitivity of the method i.e. ability to record accurately minimal values is of big importance. LDF depends on the conditions of test performance and the sensitivity of used laser sensor. LDF results will depend on optical properties of the tissue of different patients, as well as on the position and method of sensor fixation [6]. In addition, noise and vibration of external environment affect the values [25], which might result in artifacts [22]. Blood cells are Brownian particles and constantly make chaotic motion in the lumen of vessels, even if there is no forward motion of liquid volume. That is why during every LDF test, a Doppler shift different from zero was noted, even in the absence of blood movement [24]. Therefore, PU value doesn’t fully reflect the functional state of microcirculation in the region of interest.
A good reproducibility of UDF method was definitely shown on a developed fantom, which simulated blood flow in dental pulp, where the system of UDF was applied in our previous investigations [12]. Computer monitored system delivered liquid flow, imitating blood flow. The system of UDF system with a sensor of 20 MHz measured liquid flow velocity. A high linear correlation between the velocities of the fantom flow and the measured velocities by UDF was recorded. Audio and visual control was charged during the measurement by UDF.
Conclusions
Our pilot study showed a good correlation of the results on tissue perfusion obtained by means of UDF and LDF, respectively. UDF method could be regarded as a comparable substitutional method to LDF for estimation of blood flow with a potential usefulness in clinical practice for studying microcirculation. Yet, additional experiments in this field are warranted.