
Abstract
Keywords
Introduction
Characterisation of focal liver lesions in cirrhotic and non-cirrhotic liver is a common clinical concern. Many studies have shown that contrast-enhanced ultrasound (CEUS) leads to a marked improvement in sensitivity and specificity in the assessment of focal liver lesions [1–9]. For focal nodular hyperplasia (FNH), findings on conventional B-mode are often not diagnostic; thus, CEUS is helpful for clarification [2–8]. The characteristic enhancement pattern of FNHs is thought to be an initial radial centrifugal arterial hyperenhancement (“wheel spoke pattern”), followed by rapid complete enhancement of the lesion and sustained homogeneous hyper- or isoenhancement of the lesion during the portal venous and late phase [3].
HCCs can be diagnosed non-invasively due to characteristic features upon contrast-enhanced imaging in high-risk patients. The typical enhancement pattern of HCCs is defined as arterial hyperenhancement, followed by washout in the portal venous or late phase. However, well-differentiated HCCs often lack arterial hyperenhancement, appearing iso- or even hypoenhanced in the arterial phase [17–18]. As for intrahepatic cholangiocellular carcinomas (ICCs), their typical contrast enhancement pattern is thought to be a strong, peripheral rim-like arterial hyperenhancement, followed by a rapid and pronounced washout of the contrast agent in the early portal venous phase [16]. Difficulties in the differential diagnosis of ICC versus HCC present a long-disputed and controversial issue and are often quoted as a reason for the exclusion of CEUS as a primary imaging modality equivalent to contrast-enhanced (CE-) CT and CE-MRI from HCC- guidelines of the AASLD and EASL [1, 19–21].
In conclusion, although improving diagnostic sensitivity and specificity as compared to conventional B-mode ultrasound, CEUS is not devoid of diagnostic difficulties and pitfalls. One major issue is subjectivity in the assessment of enhancement patterns [22]. Studies have shown that the assessment of the contrast enhancement pattern of a given lesion is essentially subjective and depends on a reader’s experience; interreader-agreement has been shown to improve with a reader’s experience [23].
Therefore, attempts have been made to improve objectivity as well as interreader-agreement in the assessment of contrast enhancement behaviour. An advancement of CEUS offering additional semi-quantitative assessment of contrast enhancement is dynamic CEUS (DCEUS), providing quantification software for standardised analysis of enhancement kinetics. Several recent studies have shown good diagnostic accuracy, sensitivity and specificity of DCEUS in the assessment of focal liver lesions [9–13, 24–30].
A specific tool in the context of DCEUS in focal liver lesion is a programme called “dynamic vascular pattern” (DVP). With DVP, quantitative differences in contrast enhancement between given regions of interest (e.g. a focal liver lesion and the surrounding healthy parenchyma, or different spots within a focal liver lesion) are visualised by means of coloured maps. Thus, hyperenhancement versus a reference region is depicted as “warm” colours (red, orange, yellow), whereas hypoenhancement is visualised through “cold” colours (blue, green). Thus, assessment of hyper- or hypoenhancement of a given lesion is facilitated, potentially enabling less experienced observers to make a more objective assessment of contrast enhancement behaviour. For interpretation of DCEUS, there are several quantification parameters reflecting arterial contrast enhancement (time-to-peak = TTP, rise time = RT), absolute contrast enhancement (maximum intensity), and venous contrast washout (mean Transit Time = mTT, Fall Time = FT). With DVP, the user is provided with time intensity curves of a given region of interest (ROI). Also, quantification parameters can be displayed. Several studies have described a high maximum intensity and short time-to-peak as characteristic of HCC; also, slower washout was related with a higher grade of tumour differentiation [32]. In a study evaluating DCEUS in HCCs, Schacherer et al. [32] conclude that high peak values of contrast enhancement reflect a well-established microvascular network. For intrahepatic cholangiocellular carcinoma (ICC), rapid and pronounced washout are considered characteristic [15]. Whereas parameters reflecting arterial contrast enhancement behaviour such as rise time and time-to-peak have been shown to be similar in HCC and ICC, significant differences can be observed concerning parameters of contrast agent washout such as mTTI and FT [21]. However, as interpretation of time-intensity-curves and single quantification parameters can be difficult and time-consuming, DVP also summarises and illustrates this information by means of coloured maps. However, although a useful tool in the objectification of enhancement behaviour in focal liver lesions, only few studies have been conducted on DVP[24, 32].
Aim of the present study was to explore DVP as a method of more objective assessment of focal liver lesions by observers with different levels of experience. Therefore, four observers retrospectively evaluated DVP maps of 52 focal liver lesions (30 HCCs, 15 ICCs, 7 FNHs) for their dignity and final diagnosis. Histological findings and findings from contrast-enhanced imaging (CT, MRI) served as reference standards. Sensitivity, specificity, positive and negative predictive values as well as diagnostic accuracies were assessed for every reader, and the interreader-agreement was determined.
Materials and methods
Patients
52 patients with focal liver lesions visible on conventional ultrasound who presented to our ultrasound department between 2012 and 2016 were selected for CEUS examination. Inclusion criteria were a focal liver lesion (HCC, ICC or FNH) visible on conventional ultrasound, and either histology or another contrast-enhanced imaging modality apart from CEUS (CE-CT or CE-MRI) available as a reference standard [4, 32]. These lesion entities were chosen because as shown by the DEGUM-multi-centre study, they present a diagnostic challenge. FNHs were included as these hypervascular lesions might mimic HCC [3]. The study was approved by the local ethics committee. All patients provided written informed consent for acquisition and pseudo-anonymised evaluation of data.
Dynamic Contrast Enhanced Ultrasound (DCEUS)
For all patients, conventional ultrasound was performed prior to CEUS. Examinations were performed in a supine or left lateral position using a Siemens Acuson Sequoia 512 ultrasound system (Siemens Medical Solutions, Erlangen, Germany, 4C1 probe). Lesions were first identified on conventional B-mode. In case of more than one lesion in a single patient, only the lesion best accessible for ultrasound examination was chosen for further analysis. Afterwards, CEUS examination was performed according to EFSUMB guidelines [1] following a standardised protocol using a low mechanical index and the specific cadence contrast pulse sequence (CPS) preset. An intravenous injection of 1.5 mL SonoVue® via an antecubital vein was followed by a 10 mL saline flush. The linear raw data of the examinations were continuously recorded over a time period of 3–5 minutes starting before the first arrival of detectable microbubbles until the beginning of clearance of the microbubbles from parenchymal tissue in the late phase. In order to avoid motion artefacts, patients were asked to respect a relaxed breathing during video clip acquisition. To record valid clips for quantification purpose, continuous scanning had to be carried out during the time of examination.
The vascular phases were defined according to EFSUMB guidelines and recommendations for DCEUS acquisition [1, 31].
Dynamic Vascular Pattern (DVP)
Quantification was performed using dedicated quantification software (VueBox®, Bracco Suisse Software Applications, Genève, Suisse). The software programme contains a standardised module called “Liver DVP” for quantitative analysis of focal liver lesions using Dynamic Vascular Pattern. Tools are included for calibration of video clip sequences and correction of in-plane-motion. In a first step, both a “lesion” and “reference parenchyma” are defined manually by drawing an elliptically shaped “region of interest” (ROI). For every lesion, two additional ROIs were drawn within the lesion designating a central and peripheral ROI, respectively, thus enabling the observer to analyse the lesion centre and periphery separately. With the “Liver DVP” software, video clip data is then linearized in an automated process. Both on the level of individual pixels and of ROIs, a parametric perfusion model is used for fitting a curve of echo signal intensities over time, with echo signal intensities being directly proportional to the actual concentration of contrast agent at a given time.
With the DVP programme, a DVP signal is created by subtracting a reference signal from a pixel signal at any given point of time. Pixels with hyperenhancement versus the reference parenchyma at a given time are indicated with warm colours (red, orange, yellow), whereas those with hypoenhancement versus the reference parenchyma are displayed in cold colours (blue, green). Thus, a colour map is created illustrating the relative contrast enhancement of a lesion (ROI) versus the reference parenchyma (Fig. 1).

Principle of DVP. a) Perfusion kinetics in healthy parenchyma (black line) as compared to a lesion with slow contrast uptake and persisting hyperenhancement (green line, lesion 1; typical “benign” lesion) versus a lesion with arterial hyperenhancement and early washout (red line, lesion 2; typical “malignant” lesion). b) DVP processing: signal intensities as differences calculated by subtracting the signal intensity of the lesion from that of the reference parenchyma. The resulting amplitude is coded in warm colours for hyperenhancement or cold colours for hypoenhancement. Copyright© 2015 VueBox user manual, Bracco Suisse SA ALL RIGHTS RESERVED. Printed with permission from Bracco Suisse.
DVP images of all 52 focal liver lesions (30 HCCs, 15 ICCs, 7 FNHs) were created and then independently analysed by four observers with theoretical knowledge of contrast enhancement patterns in focal liver lesions, but different levels of clinical experience in CEUS (observer 1: no practical experience; observer 2 : 5 years of experience; observer 3 : 7 years of experience; observer 4: more than 10 years of experience). Observers were blinded to all additional clinical and imaging data apart from prepared DVP images. Before assessment of lesions, all observers received a brief theoretical training. They were given images of “ideal cases” for each lesion entity for reference (Fig. 2). Observers were instructed to assess for every case first the lesion dignity (benign, malignant or unsure) and then the lesion entity (HCC, ICC, FNH or unsure). Although they were informed which entities were included into the study, observers did not know the number of lesions included for each entity.
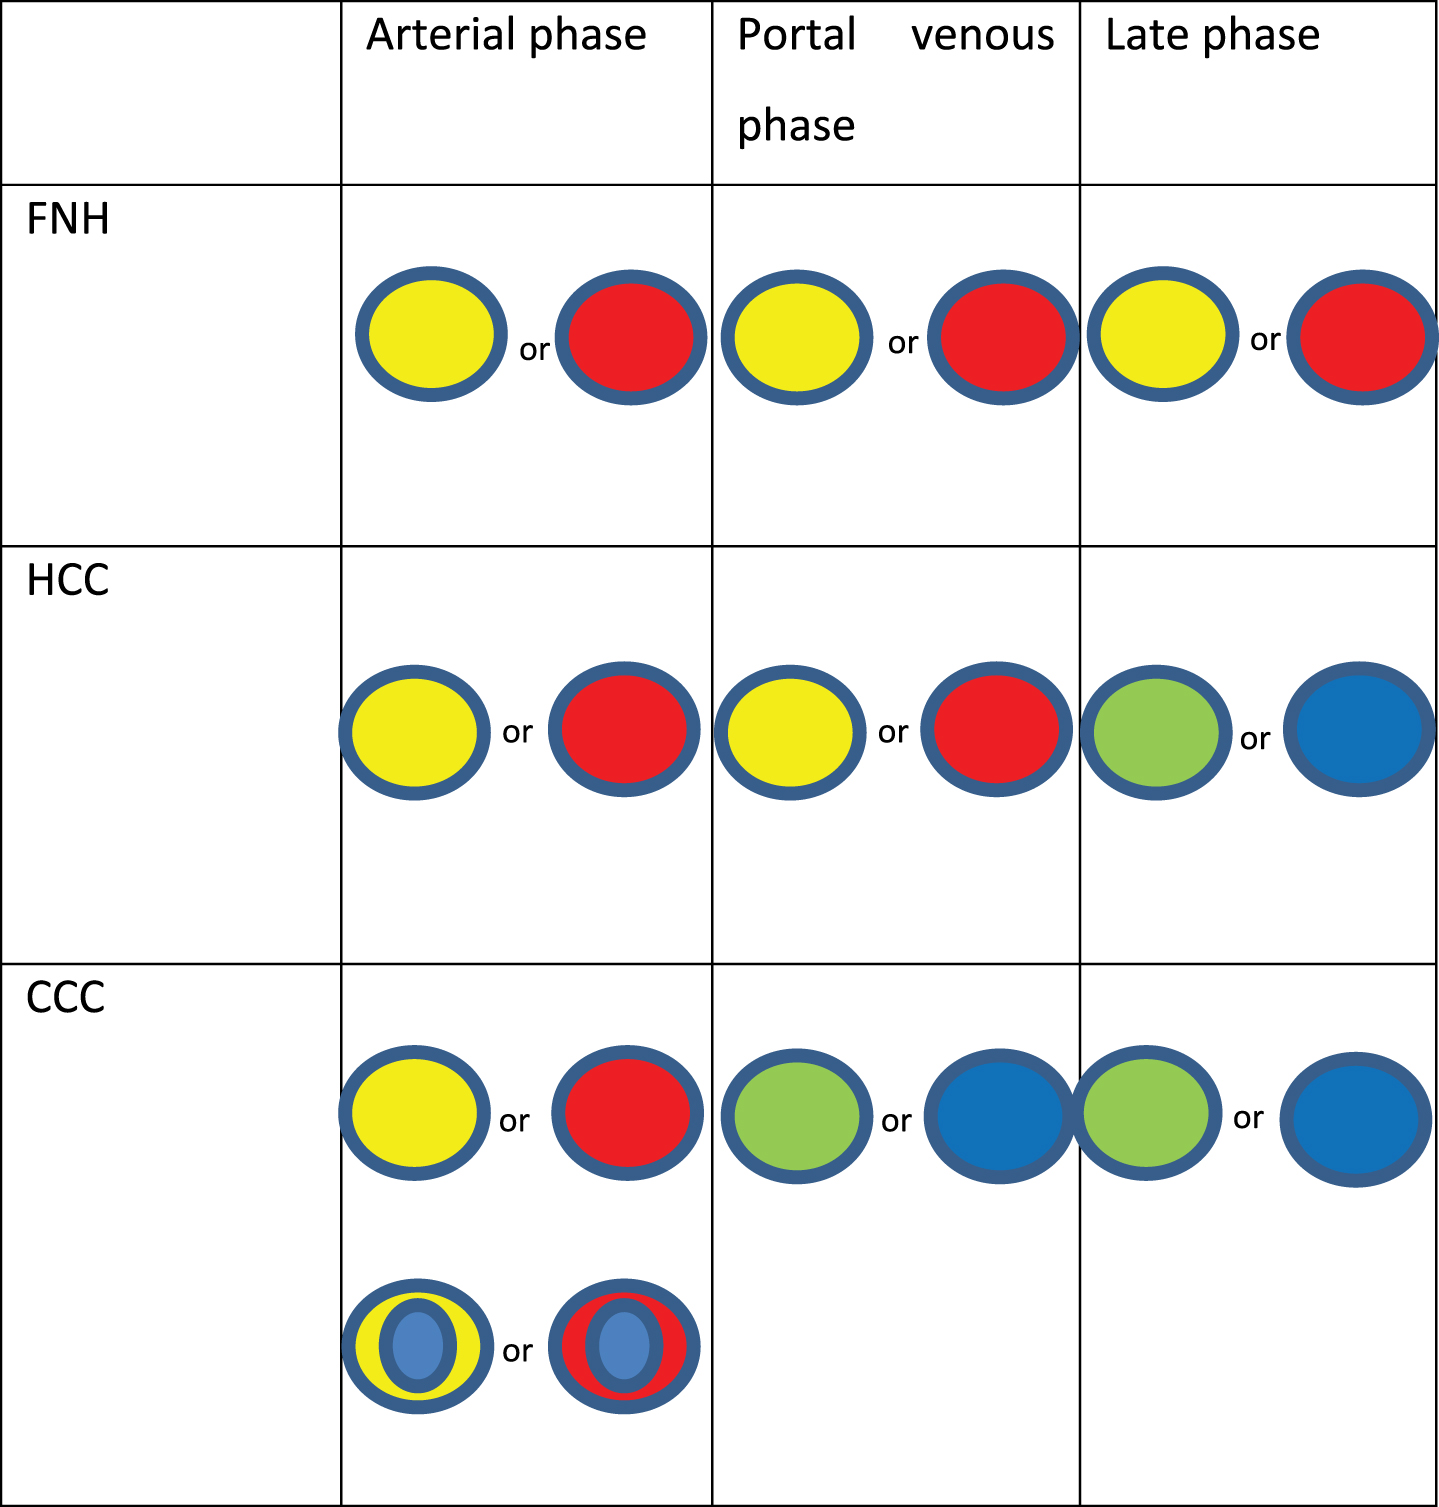
Typical DVP images of focal liver lesions.
Results were evaluated separately for every observer. Afterwards, interobserver-agreement was analysed.
Statistical Analysis was performed using Microsoft Excel 2010 and IBM SPSS Statistics 2013. Values are expressed as mean and range, or absolute sum and proportion in percent as appropriate. Student’s t-test for unpaired samples was used for comparison of means. Cohen κ statistics were used for evaluation of interreader-agreement. Differences were considered statistically significant for p < 0.05.
Results
Patient characteristics and focal liver lesions
Characteristics of patients and lesions are summarised in Table 1. In total, 52 focal liver lesions were analysed (30 HCCs, 15 ICCs and 7 FNHs); thus, the majority of lesions was malignant (45/52 = 85.5%). All FNH patients were female. In the HCC and ICC groups, there was a marked male predominance (90% vs. 66.6% males). None of the FNH patients had liver cirrhosis as opposed to 83.3% in the HCC group and 26.7% in the ICC group.
Patient and lesion characteristics
Patient and lesion characteristics
Patients in the FNH group were significantly younger than those in the two other groups (p < 0.01). Lesion size did not differ significantly between tumour entities (p = 0.45).
Results from dignity assessment for all four observers and entities are summarised in Tables 2 and Tables 3.
Results from dignity assessment of single observers
Results from dignity assessment of single observers
Quality of dignity assessment and diagnostic accuracies
PPV, positive predictive value; NPV, negative predictive value.
Table 2 summarises mean values from assessments of all four observers. In total, correct differentiation of benign versus malignant lesions was achieved in 63.9% of cases. Correct dignity assessment differed between lesion entities, with best results for ICC (73.3%) followed by FNH (67.9%). Correct dignity assessment was achieved in 58.3% of HCCs. Uncertainty in dignity assessment was 13.9% on average; it was lowest for the FNH group with 3.6%, but, however, the FNH group also showed the highest rate of misdiagnosis of dignity (28.6% versus 13.3% for ICC and 25% for HCC).
There were marked differences between observers with 61.5% /53.8% /73.1% /67.3% of correct dignity classifications. The more experienced observers (observer 3 and 4) showed the lowest rate of diagnostic uncertainty (7.7% and 13.5% versus 17.3% /17.3%) and also the lowest rate of misclassifications (19.2% /19.2% versus 21.1% /28.8%). Also, they had the highest proportion of correct dignity classifications (73.1% /67.3% versus 61.5% /53.8%).
In total, mean sensitivity for the detection of malignancy was 48.4% with statistically significant differences between observers, who achieved sensitivities of 62.2% /48.9% /75.6% and 66.7%, respectively (Table 3). Specificity for the detection of malignancy was 67.8% (57.1% /85.7% /71.4% and 57.1%). Thus, the highest specificity but lowest sensitivity and diagnostic accuracy (for both dignity and entity) were seen for observer 2. Positive predictive value (PPV) was 92.7% with high values for all four observers (93.3% /91.7% /91.9% /93.8%), with a negative predictive value of 29.3% (33.3% /21.1% /33.3% /29.4%).
Results for the differentiation between lesion entities for all observers as well as mean diagnostic accuracies are shown in Tables 3 and Tables 4.
Results from entity assessment of single observers
Results from entity assessment of single observers
In total, mean diagnostic accuracy for the correct classification of lesion entities was 38.5% with only minor differences between observers (38.5% /34.6% /42.3% /38.5%) (Table 3). As shown in Table 4, mean diagnostic accuracy differed between entities and was highest for FNHs with 67.9% versus 50% for ICCs and 25.8% for HCCs. Also, HCCs were the entity with the highest rate of misdiagnoses (55% versus 26.7% for ICCs and 28.6% for FNHs). Diagnostic uncertainty as to the differentiation of entities was highest for ICCs (23.3%).
As shown in Table 5, there were a total of 26 cases (50%) with agreement of all four observers upon dignity of a lesion. In 22/52 lesions (42.3%), all observers correctly identified the dignity of the lesion (12/30 HCCs, 6/15 ICCs, 4/7 FNHs). In 3/52 lesions (5.8%; all HCCs), all four observers misclassified the lesion’s dignity.
Interobserver agreement: Agreement/disagreement of all four observers
Interobserver agreement: Agreement/disagreement of all four observers
*no agreement: defined as no more than two observers agreeing upon any option.
As FNHs were the only benign lesion included into the study, results for dignity and entity assessment are the same in this group. For the malignant lesions, correct classification of entity was seen less often than correct classification of dignity. Agreement between all four observers as to the differentiation of a lesion’s entity was seen in 11 correctly classified lesions (4 HCCs, 3 ICCs, 4 FNHs), and in 8 misclassified lesions (7 HCCs, 1 ICC).
For 12 lesions (10 HCCs, 2 ICCs), no agreement was seen between observers concerning dignity, where “no agreement” was defined as no potential options voted for by more than two observers. No agreement concerning entity was seen for 18 lesions (9 HCCs, 9 ICCs).
None of the FNH patients had liver cirrhosis. Out of the ICC patients, 4/15 patients had cirrhosis (26.7%), whereas in the HCC group, there were only 5/30 patients (16.7%) without cirrhosis. It became apparent that for ICCs in cirrhotic liver, assessment of dignity proved slightly more difficult with only 68.8% of correct dignity assessments (versus 73.3% in the whole ICC group); diagnostic uncertainty was slightly higher with 18.8% versus 13.3%. Only 25% of entity classifications for ICC were correct in cirrhotic liver versus 50% in the whole group. Interestingly, for HCC, the “atypical” subgroup of HCCs in non-cirrhotic liver showed slightly superior results with 65% of correct dignity classifications (versus 58.3% in the whole group). Strikingly, none of the HCCs in non-cirrhotic liver was attributed the correct entity, but there were 70% of misclassifications (as opposed to 50% in the whole group).
Interobserver-agreement for differentiation between malignant and benign lesions was moderate with Cohen’s κ= 0.468. Interobserver-agreement for diagnosis of lesion entity was moderate with Cohen’s κ= 0.42. Interreader-agreement was moderate for any pair of readers with, however, best agreement between observer 3 and 4 (κ= 0.576).
Discussion
Focal liver lesions are a common finding in both cirrhotic and non-cirrhotic liver [3, 8]. In clinical routine, it is vital to differentiate between benign findings, which mostly require no further intervention unless in rare cases of symptomatic patients, and malignant lesions necessitating further diagnostic workup and immediate therapy. Due to its excellent sensitivity and specificity in the detection and differentiation of focal liver lesions as well as additional advantages such as ready availability and almost complete lack of contraindications and adverse effects, contrast-enhanced ultrasound (CEUS) has been widely accepted as imaging modality for further diagnostic workup of focal liver lesions detected upon conventional B-mode ultrasound [1–5, 34–43]. Providing a real-time visualisation of contrast enhancement kinetics, CEUS allows for a very sensitive detection of arterial phase hypervascularisation and possibility to detect tumorous as well as infectious lesions at very early stages[47, 48].
More recently, (semi-)quantitative analysis using dynamic CEUS (DCEUS) has attracted scientific attention as a method of more objective and possibly more sensitive assessment of perfusion kinetics in focal liver lesions, allowing for a more accurate assessment of dignity and in some cases also further classification of lesion entity [9–12, 50]. However, a certain subjectivity inherent in the method as well as great dependency from the reader’s experience led to the development of quantification software programmes aiming at a more standardised and objective evaluation [22–25, 44]. One such method for facilitating interpretation of contrast enhancement patterns as well as regional differences in perfusion kinetics in focal liver lesions is the “Dynamic Vascular Pattern” (DVP) module presented in this study. Typical examples of DVP and MRI images of benign and malignant focal liver lesions (FNH, HCC and ICC) are shown in Fig. 3 and Fig. 4. Although DVP has been implemented into customised DCEUS quantification programmes for several years now, little research has been conducted to evaluate its performance. Thus, the present work aimed at assessment of the diagnostic accuracy of DVP in the assessment of dignity and classification of entity of benign and malignant focal liver lesions (FNH, HCC, ICC) in cirrhotic and non-cirrhotic liver. Also, results were compared for observers with different levels of clinical experience with CEUS (no practical experience / 5 years / 7 years / >10years).
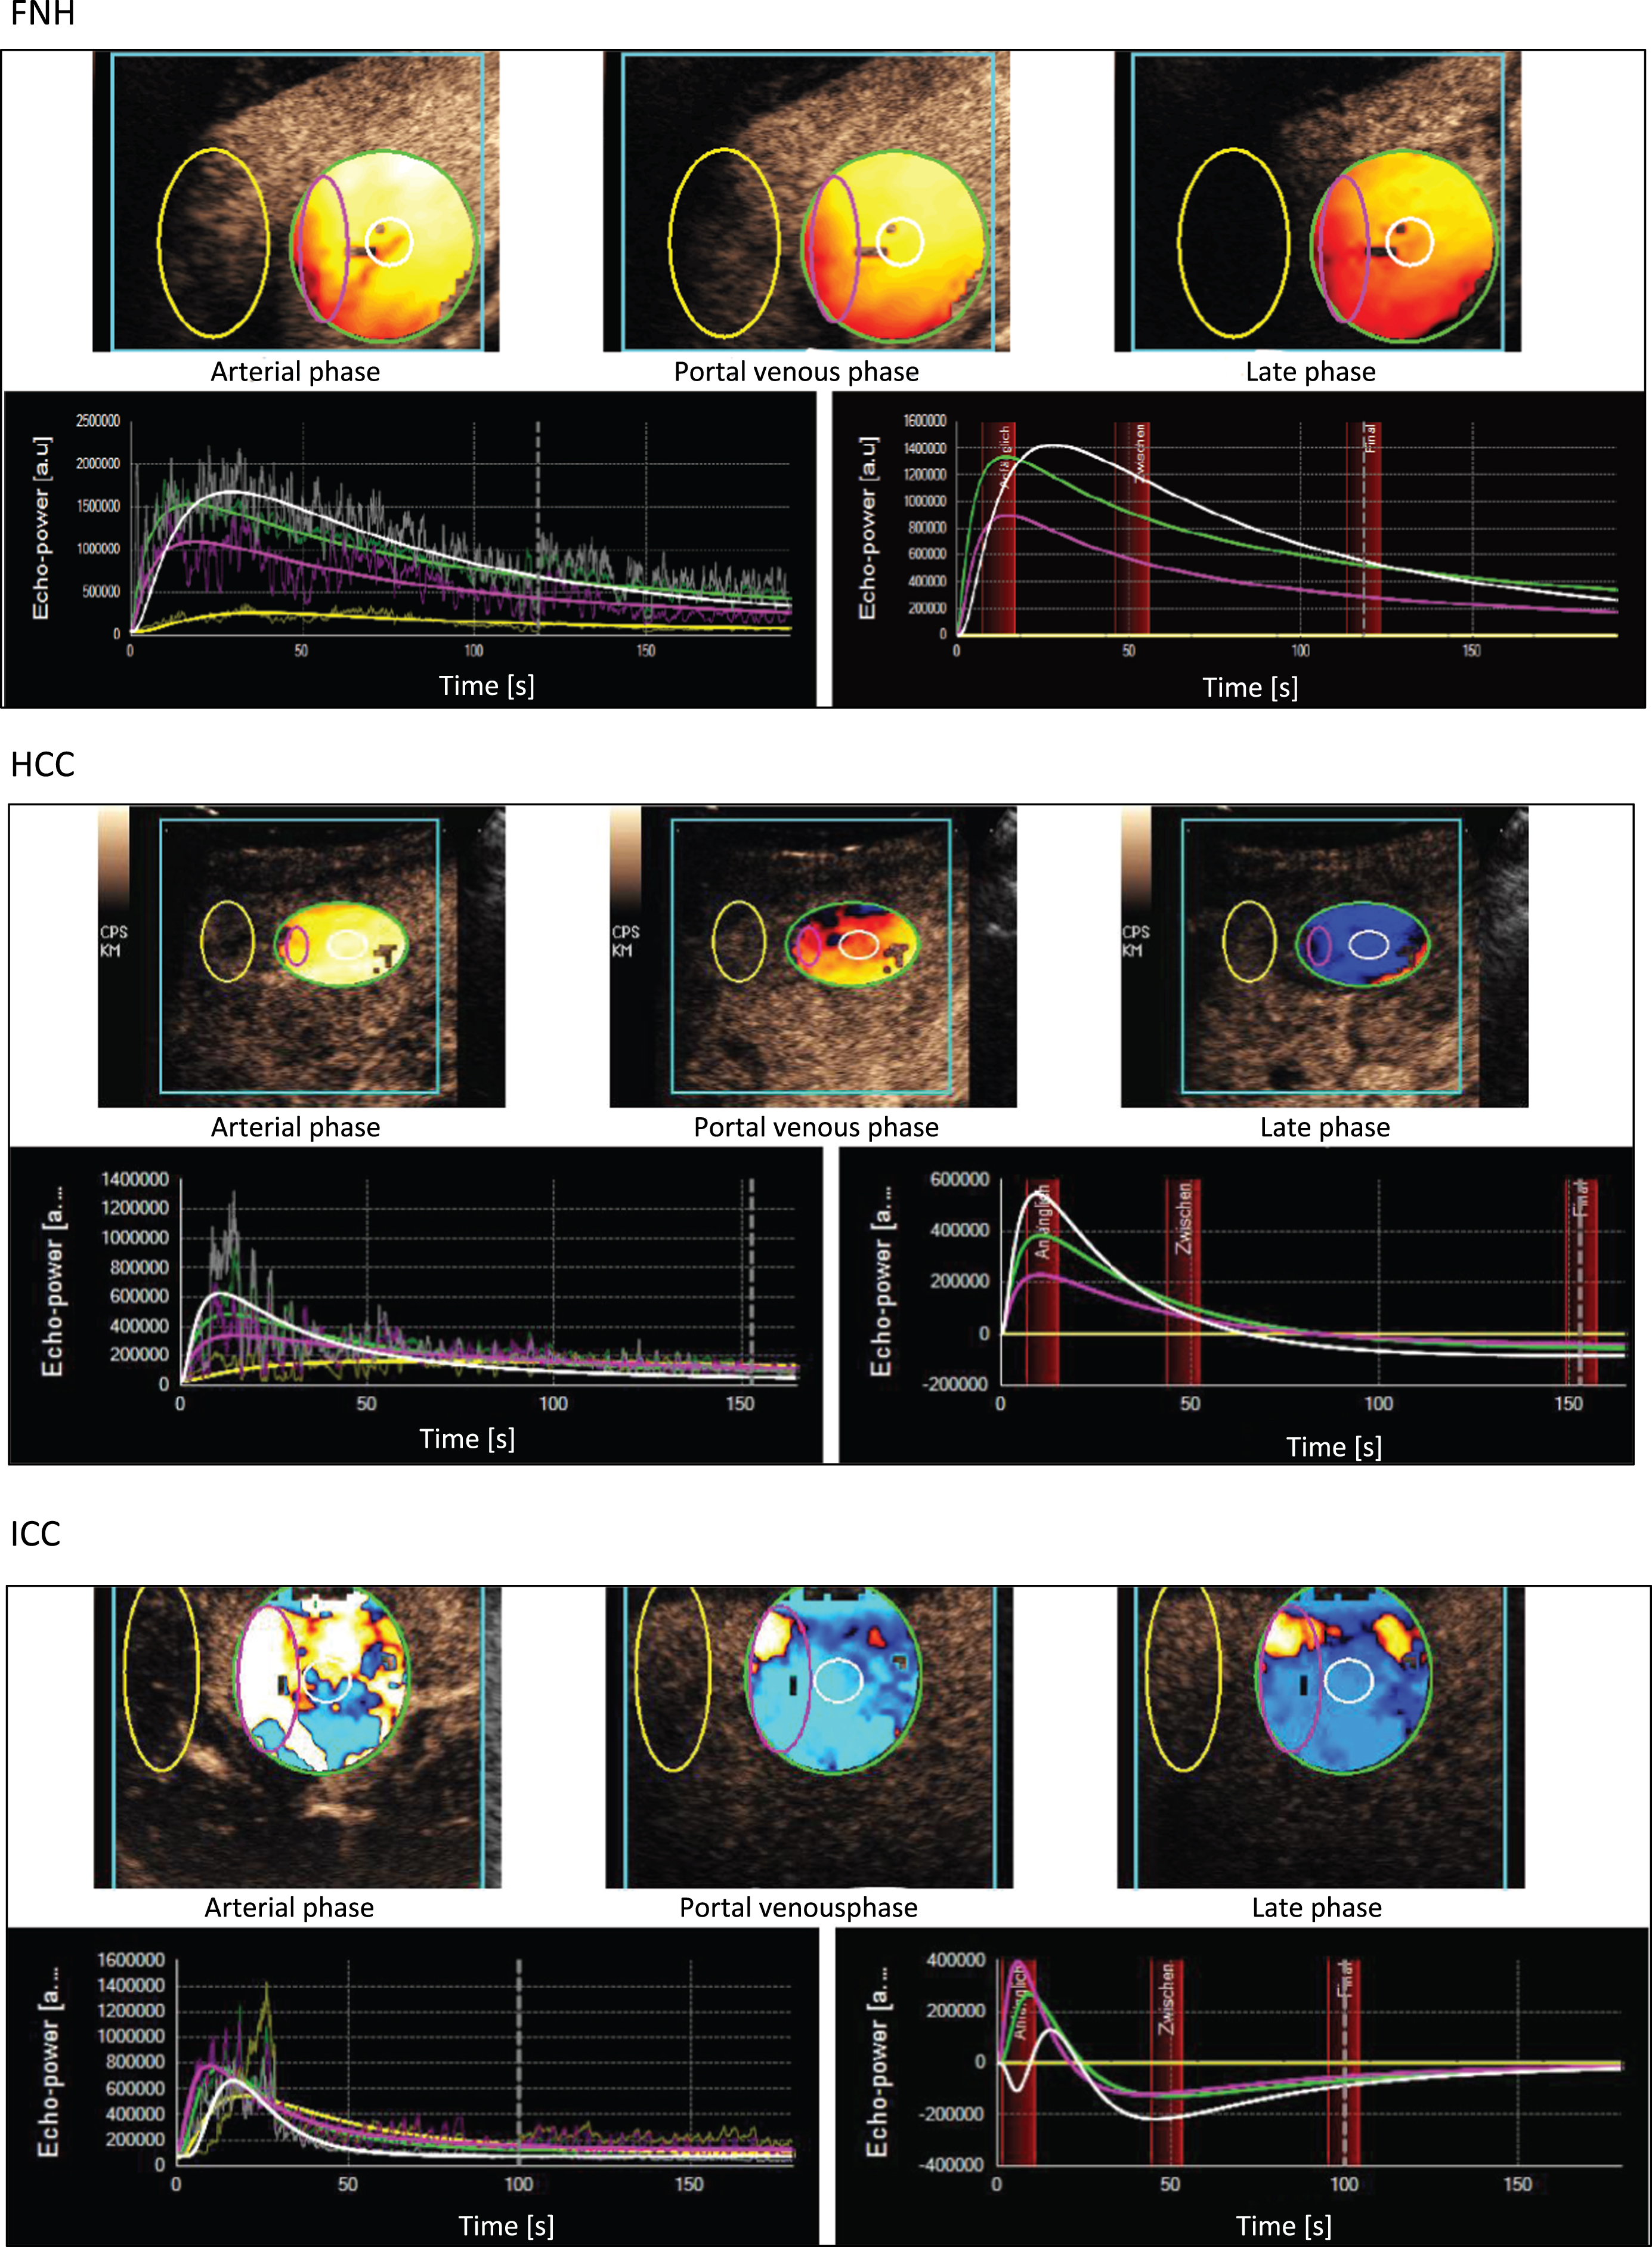
Typical examples for DVP images of FNH, HCC and ICC.
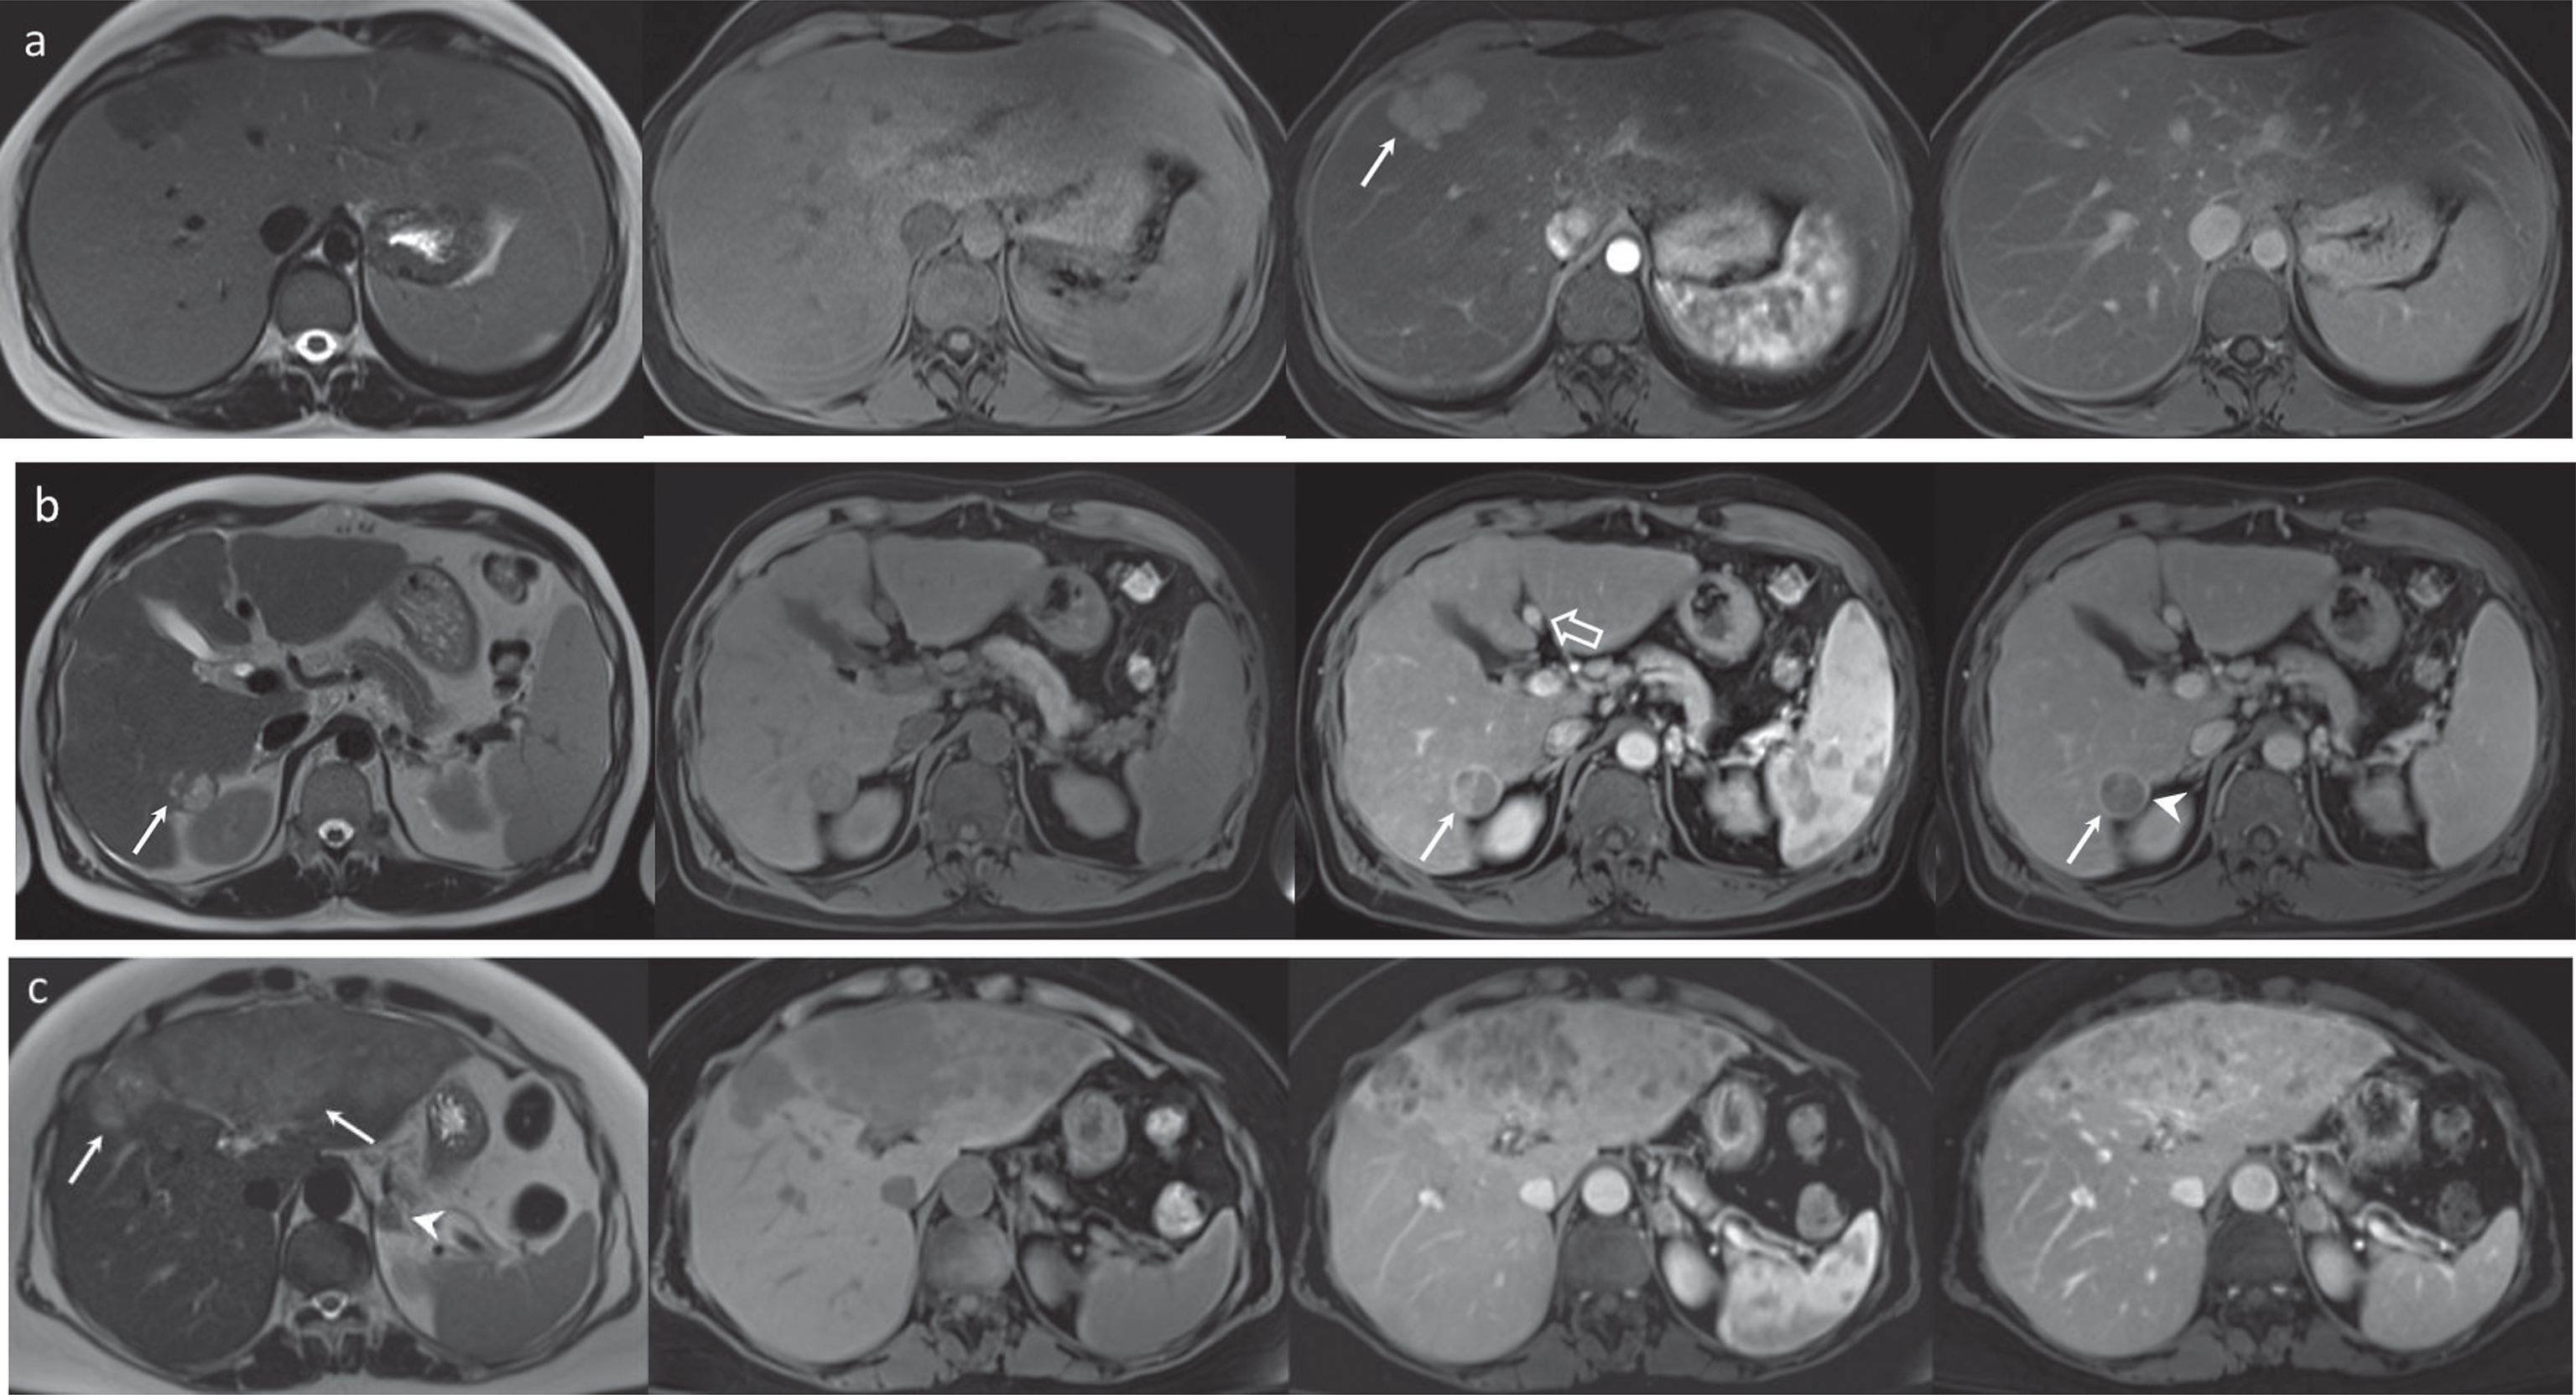
Typical examples of benign and malignant liver lesions on MRI. MRI images of three different liver lesions:T2-weighted and dynamic T1 weighted dynamic images (pre-contrast, arterial and portal venous phase, from left to right). 4a, 23-year-old woman with a focal nodular hyperplasia (FNH). The lesion is best visible in the arterial phase (white arrow). In T2 w, it is slightly hypointense, and in the pre-contrast and portal venous phase, it is nearly isointense to the normal liver parenchyma. 4b, 45-year-old man with cirrhosis, recanalization of the umbilical vein (open arrow) and a hepatocellular carcinoma (HCC) in segment 6/7. The lesion is isointense in T2w and hyperintense in the arterial phase with washout in the portal venous phase (white arrows). The rim enhancement in the portal venous phase (arrowhead) represents a capsule, which is considered relatively specific for HCC. 4c, 62-year-old woman with a large intrahepatic cholangiocellular carcinoma (ICC) (white arrows) and a suspicious adrenal lesion (white arrowhead). The ICC shows the typical homogeneous low attenuation on the non-contrast scan, and demonstrates heterogeneous contrast enhancement.
Concerning the differentiation between benign and malignant findings, our results showed a low sensitivity for the detection of malignant findings with DVP of 48.4%, with a moderate specificity of 67.8% and a very high positive predictive value (PPV) of 92.7%. Total diagnostic accuracy for the assessment of a lesion’s dignity amounted to 63.9%. However, there were differences between lesion entities with the highest percentage of correct dignity assessment in the ICC group (73.3%), followed by the FNH group with 67.9% and the HCC group with 58.3%.
These results differ from a recent study by Anaye et al. [24] comparing diagnostic accuracy for dignity assessment in 146 focal liver lesions between direct visual assessment of CEUS clips versus interpretation of parametric imaging. The authors found superior sensitivities of 96.5–97.3% and specificities of 90.9% for all three readers with interpretation of parametric imaging as opposed to visual assessment of CEUS video clips. Thus, sensitivities and specificities were markedly higher than in our study. However, the technique used for parametric imaging in the study by Anaye et al. slightly differed from the DVP as used in our study with coloured representation of pixel polarisation and also different interpretation of “malignant appearance”. Also, although there was a time interval of at least 2 months between interpretation of original video clips and parametric images, both were evaluated by the same readers, which might have introduced a certain bias. Moreover, in the study by Anaye, all readers had at least 2 years of experience with CEUS, which was not the case in our study. Furthermore, the benign and malignant entities of focal liver lesions included into the study differed from our work. In the study by Anaye et al., 65/113 (57.5%) malignant lesions were metastases and only 36/113 (31.9%) were HCCs and 10/113 (8.8%) were ICCs, whereas in our own study, 30/52 lesions (57.7%) were HCCs and 15/52 (28.8%) were ICCs. As shown by the analysis of tumour-specific vascularisation patterns from the DEGUM-multi-centre study [3], diagnostic accuracy of CEUS is far better for metastases than for HCC (correct diagnosis with CEUS in 350/383 metastases = 91.4% versus 247/279 HCCs = 84.9%). Also, in a very recent study by Yue et al. [26], parametric imaging with CEUS was shown useful for the differentiation between HCC and liver metastases. Thus, the superior sensitivities and specificities reported by Anaye et al. are probably at least partly due to the choice of lesions. Anaye et al. found moderate interreader-agreement (κ= 0.54) with CEUS clip interpretation and almost perfect interreader-agreement (κ= 0.99) for interpretation of parametric images. Sensitivity and specificity of dignity assessment between individual readers showed marked differences for interpretation of CEUS clips (sensitivities 85% /77.9% /87.6%; specificities 51.5% /78.8% /75.8%) reflecting different experience levels. Accordingly, in our study, marked differences could be seen between results from individual readers.
Unfortunately, there seems to be no work in the literature so far assessing the diagnostic value of DVP in the differentiating of entities of focal liver lesions, so no direct comparison of our results is possible. Nonetheless, we found an insufficient diagnostic accuracy of 38.5% for the correct classification of lesion entities. FNHs seemed to pose the least diagnostic difficulties with 67.9% of correct diagnoses. On the contrary, entity was misclassified in 55% of HCCs and was voted as uncertain in 23.3% of ICCs.
In a study by Vilana et al. [19] evaluating CEUS for ICCs in cirrhotic patients, 10 out of 21 ICCs showed homogeneous arterial hyperenhancement followed by washout, and 7 out of 10 ICCs >20 mm in size were misclassified as HCCs on the basis of CEUS findings. Similarly, Li et al. [15] assessed the influence of cirrhosis and chronic hepatitis B infection versus healthy surrounding liver parenchyma on enhancement patterns of ICCs in CEUS. The authors concluded that in cirrhotic patients or those with chronic hepatitis B, contrast enhancement patterns of ICCs are closely similar to those considered typical of HCC, making differential diagnosis almost impossible in these patients. However, these studies used subjective qualitative evaluation of contrast enhancement patterns and no quantitative assessment. Yet, the presence of cirrhosis or other comorbidities affecting the liver might have an influence on DVP images, too. Although cautious interpretation is required due to the small cohort size, our results seem to indicate greater diagnostic difficulties in “atypical” settings, i.e., both for ICCs in cirrhotic liver and for HCCs in non-cirrhotic liver. These findings might be due to perfusion differences between cirrhotic and non-cirrhotic liver. Accordingly, in a very recent study by Haimerl et al. 11/2016 [49] comparing the diagnostic performance of DCEUS versus MRI-based T1 elastometry, the authors found some quantification parameters of contrast agent wash-in to be reduced in individuals with impaired liver function as compared to healthy individuals. However, the authors concluded that CEUS-based perfusion parameters did not allow for assessing the severity of liver diseases. This emphasises the fact that results for DCEUS examinations might vary between cirrhotic and non-cirrhotic liver.
Moreover, it would be interesting to assess possible correlations of grade of histological differentiation and enhancement patterns in DVP. Several studies have shown that especially well-differentiated HCCs can show very late washout or no washout at all [18]. A study by Schacherer at al. [32] analysing DCEUS in HCCs found a higher peak enhancement in tumour centres as compared to peripheral regions and concluded that this finding might be related to a higher density of microvessels in the central region of tumours. However, histological findings were not available to support this hypothesis.
Another very recent study by Giorgio et al. [41] evaluated the diagnostic value of CEUS in 229 focal liver lesions ≤20 mm in cirrhotic patients. The authors found an enhancement pattern of hyperenhancement followed by isoenhancement in 105/199 HCCs; 85/199 HCCs showed arterial hyperenhancement followed by late washout after more than 3 minutes. Thus, only 4.5% of HCCs lacked arterial hyperenhancement upon CEUS examinations [41]. However, in discordance with these findings, a study by Forner et al. reported a lack of arterial hyperenhancement in 15.1% of 119 HCCs <20 mm in cirrhotic liver [46]. Thus, it becomes apparent that HCCs represent a very heterogeneous tumour entity with sometimes atypical enhancement behaviour upon CEUS –resulting, consequently, in unexpected DVP images.
For CEUS, interobserver-agreement has been shown to be modest with κ-values between 0.47–0.63 and better agreement in more experienced observers [23]. Our results for interpretation of DVP images show similar results with moderate interreader-agreement and κ-values between 0.42–0.58, thus comparable to interpretation of conventional CEUS video clips. The only study evaluating interreader-agreement for parametric imaging in FLLs found good interobserver-agreement (κ= 0.99) with individual experience being far less influencing than with visual interpretation of CEUS clips [24]. However, in our study, results differed markedly for individual readers. Yet, diagnostic accuracies found for DVP were insufficient for all observers in our study. Thus, it might be concluded that although developed as a simple tool to facilitate dignity assessment of focal liver lesions especially for less experienced readers, DVP cannot replace an observer’s expertise. Our findings suggest that diagnostic accuracy of DVP is not superior to accuracies reported for visual interpretation of conventional CEUS clips. Also, DVP does not seem appropriate for differentiation between lesion entities.
Our study has some limitations. First of all, number of lesions was limited and different for lesion entities. Also, readers were given DVP images only without further information about patients’ clinical findings and without access to original CEUS clips. This procedure was chosen to evaluate the pure diagnostic value of DVP, avoiding any bias resulting from information derived from original CEUS clips. Furthermore, the method itself has some limitations. For DCEUS analysis, continuous scanning is mandatory to record clips over a time period of at least 3 minutes. Thus, out-of-plane-motions are a common problem. Also, ROIs have to be placed manually, resulting in some form of bias. As in our study, all ROIs were determined by the same person, this bias might be thought to be minimised. Furthermore, patient factors such as obesity, ascites, meteorism, inability to hold one’s breath and also location of the liver lesion influence the quality of DCEUS clips and thus further analysis of parametric imaging.
Dynamic Vascular Pattern (DVP) represents a simple module for quantitative analysis of DCEUS clips, which was developed to improve diagnostic accuracy and reduce subjectivity in the assessment of contrast enhancement patterns. However, our findings suggest that diagnostic accuracy of DVP is insufficient in the differential diagnosis of hepatocellular carcinoma. The differentiation between lesion entities, especially between ICCs and HCCs, remains challenging. Although intended to facilitate differential diagnosis of focal liver lesions especially for observers with little experience in CEUS, DVP alone seems unable to replace a training curve. However, we chose particularly difficult tumour entities. Further studies are needed to evaluate DVP in larger patient cohorts for the differential diagnosis of benign versus metastatic lesions in non-cirrhotic liver.
Conflicts of interest and source of funding
The authors have no conflict to report.