



Abstract
BACKGROUND:
Tissue channels as a part of microcirculation system have been proposed over three decades, playing an important role in fluid transportation as reported. Adventitia of inferior vena cava (IVC) is a typical hierarchical porous media with abundant tissue channels. Its fluid transportation behaviors attract massive research interest. However, the mechanism of the driving force and microstructure was lack of deep research.
OBJECTIVE:
This study was to investigate the microstructural basis of fluid transportation within inferior vena cava (IVC).
METHODS:
Rat IVC samples were extracted and fixed on a gelatin substrate. Four samples were randomly used as 4 cases: Case 1 with AFM loading and the fluorescent tracer adding; Case 2 with fluorescent tracer adding only; Case 3 with AFM loading only as the control group; Case 4 with no treatment. The movement of fluorescent tracer was observed by two-photon fluorescent microscope and analyzed by self-made Matlab program. The microscopic structure was characterized by high resolution TEM.
RESULTS:
The fluorescent tracer in Case 1 exhibited faster and longer transportation comparing to other cases, while in Case 2 diffused normally following Fick’s law. Case 3 with only AFM loading demonstrated that collagen bundles twisting along the fluid orientation, while the bundles in Case 4 with no treatment were straggling. The brush-like macromolecule structure of collagen microfibril was found on the bundle surfaces under TEM.
CONCLUSIONS:
Transportation within loose connective tissues is observed ex vivo. AFM loading, as the mechanical stimulation resemblance to muscle constrictions and blood pulsations, can facilitate the transportation as the driving force. The brush-like glycosaminoglycan macromolecules on the surfaces of the collagen bundles can be considered as a type of hierarchical porous media, which might form the transport pathway for fluids. The possible mechanism was conducted regarding the conformation of the superficial macromolecule brushes.
Keywords
Introduction
Fluid transportation in hierarchical porous media is ubiquitous in nature and coming into an emphasis in soft matter and biomedical researches [1]. Particularly, tissue channels are defined as the microenvironment of tissue cells functioning as pathways for interstitial fluid among cells. They are abundant in brain, adventitia of blood vessel and nerve fibre and considered playing an indispensable role in circulation [2, 3]. Fluids transportation in tissue channels tends to follow non-Newtonian rheology [4–6], which makes the detailed research on fluid circulation in vivo extremely complicated. Therefore, deep understanding of fluid transportation in hierarchical porous media resemble to tissue channels will lighten up the studies on clinical pathophysiology regarding circulation and related biomedical issues such as novel microfluidic biosensors. Among the numerous examples of biomaterials in porous media, including biofilms and cells, loose connective tissue (LCT) is the most common type in vertebrates and the major composition of tissue channels [7]. Specifically, LCTs of the vascular system, also called as adventitia, is a typical hierarchical porous media composing of micron scale bundles of collagen and elastin fibres along with nanometer scale matrix filling lavish extracellular spaces [8–10]. We have demonstrated that the adventitia of veins could function as a “green pathway” for miniature molecule transportation in vivo [11], as shown in Figure S1 in supplementary materials. Previous report also confirmed the perivascular tissue channels in brain exhibited fluid drainage effect and facilitated mass transport besides lymphatic and blood vessels system especially for macromolecule solutes [12]. LCTs in other tissues were also reported to have similar functions [13–16]. However, the driving force of fluid in LCTs is still lack of studies and the microscopic structure responsible for tissue channels is undefined.
Here we focused on the ex vivo fluid in adventitia of inferior vena cava (IVC). We found the fluid transportation disappeared in amputated lower legs in previous studies, and we speculated that the muscle constrictions and blood vessel pulsations participated in driving the fluid in LCTs. Therefore we utilized AFM tapping mode as a blood pulsation simulator to provide a external stimulation for conducting fluid transport within adventitia of IVC removed from Wistar rats. Also, transmission electron microscopy (TEM) was used to characterize the microstructure of tissue channels. In general, LCT is composed of collagen, elastin, glycoprotein, proteoglycan, and glycosaminoglycan [17]. Collagen is the majority in composition in the form of fibers forming the micron scale network. In addition, type V collagen and fibril-associated collagens with an interrupted triple-helix (FACITs) are short-chain collagen subtypes filling the collagen interfiber space. Type V collagen is interweaved chains of microfibrils, and FACITs are linked to the surface of microfibers to stabilize higher-order structures (Fig. 3D) [9, 18]. These macromolecules coverage the micron fibers as a brush layer, which have been broadly studied in interfacial science and confirmed lubricating in interfacial fluids [19–21]. Furthermore, macromolecule grafted nanopores can control the mass gating by tuning the macromolecule conformation [22–24]. With the structural similarity in interfacial macromolecule brushes, formulas are derived in the discussion as our hypothesis for the driving force of fluid in tissue channels of LCTs.
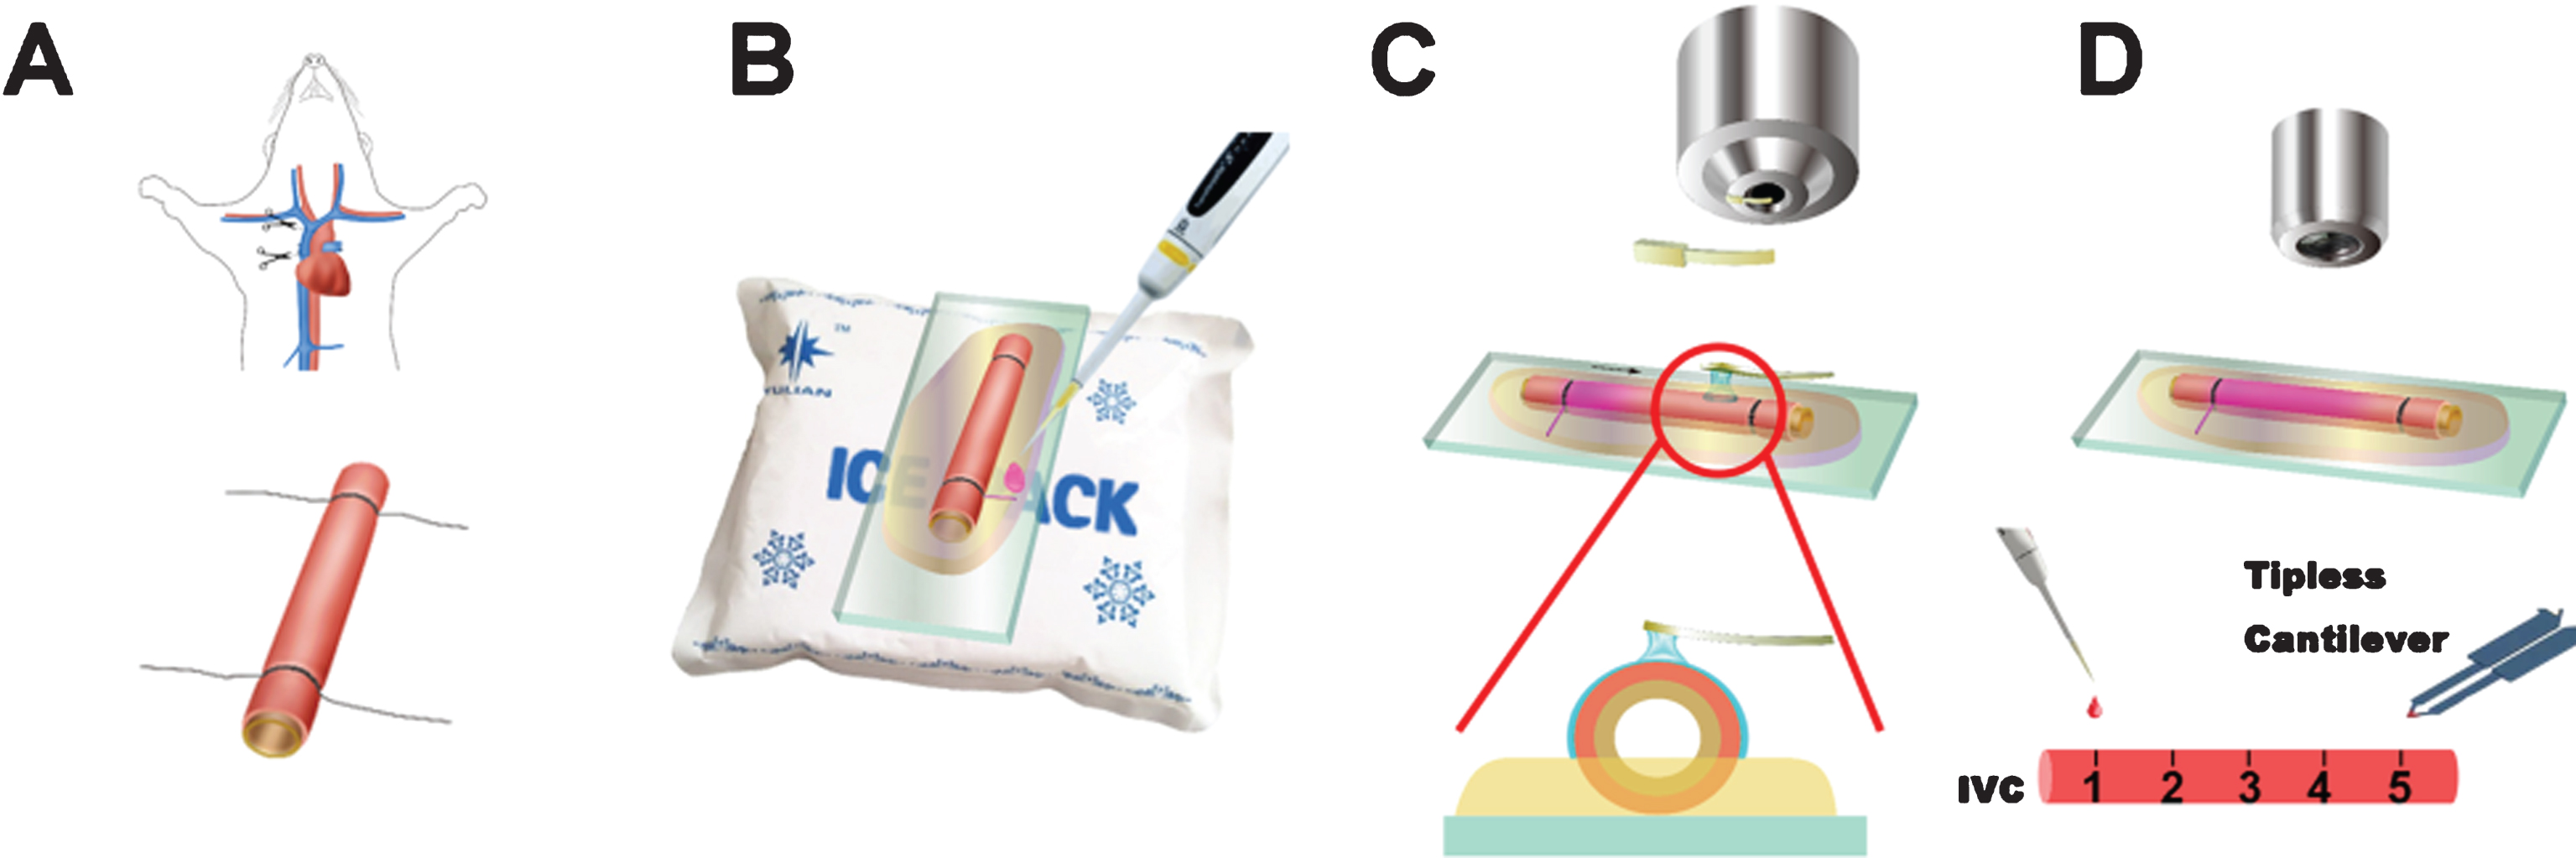
Flow diagram of the experimental procedure. (A) Extraction of IVC from a mouse. (B) Substrate preparation for AFM. (C) AFM loading with rhodamine B. (D) Observation by two-photon fluorescent microscopy. The numbers on the IVC indicate the positons of observation. The fluorescent tracer was added on position 1, and the AFM cantilever was loading on position 5.
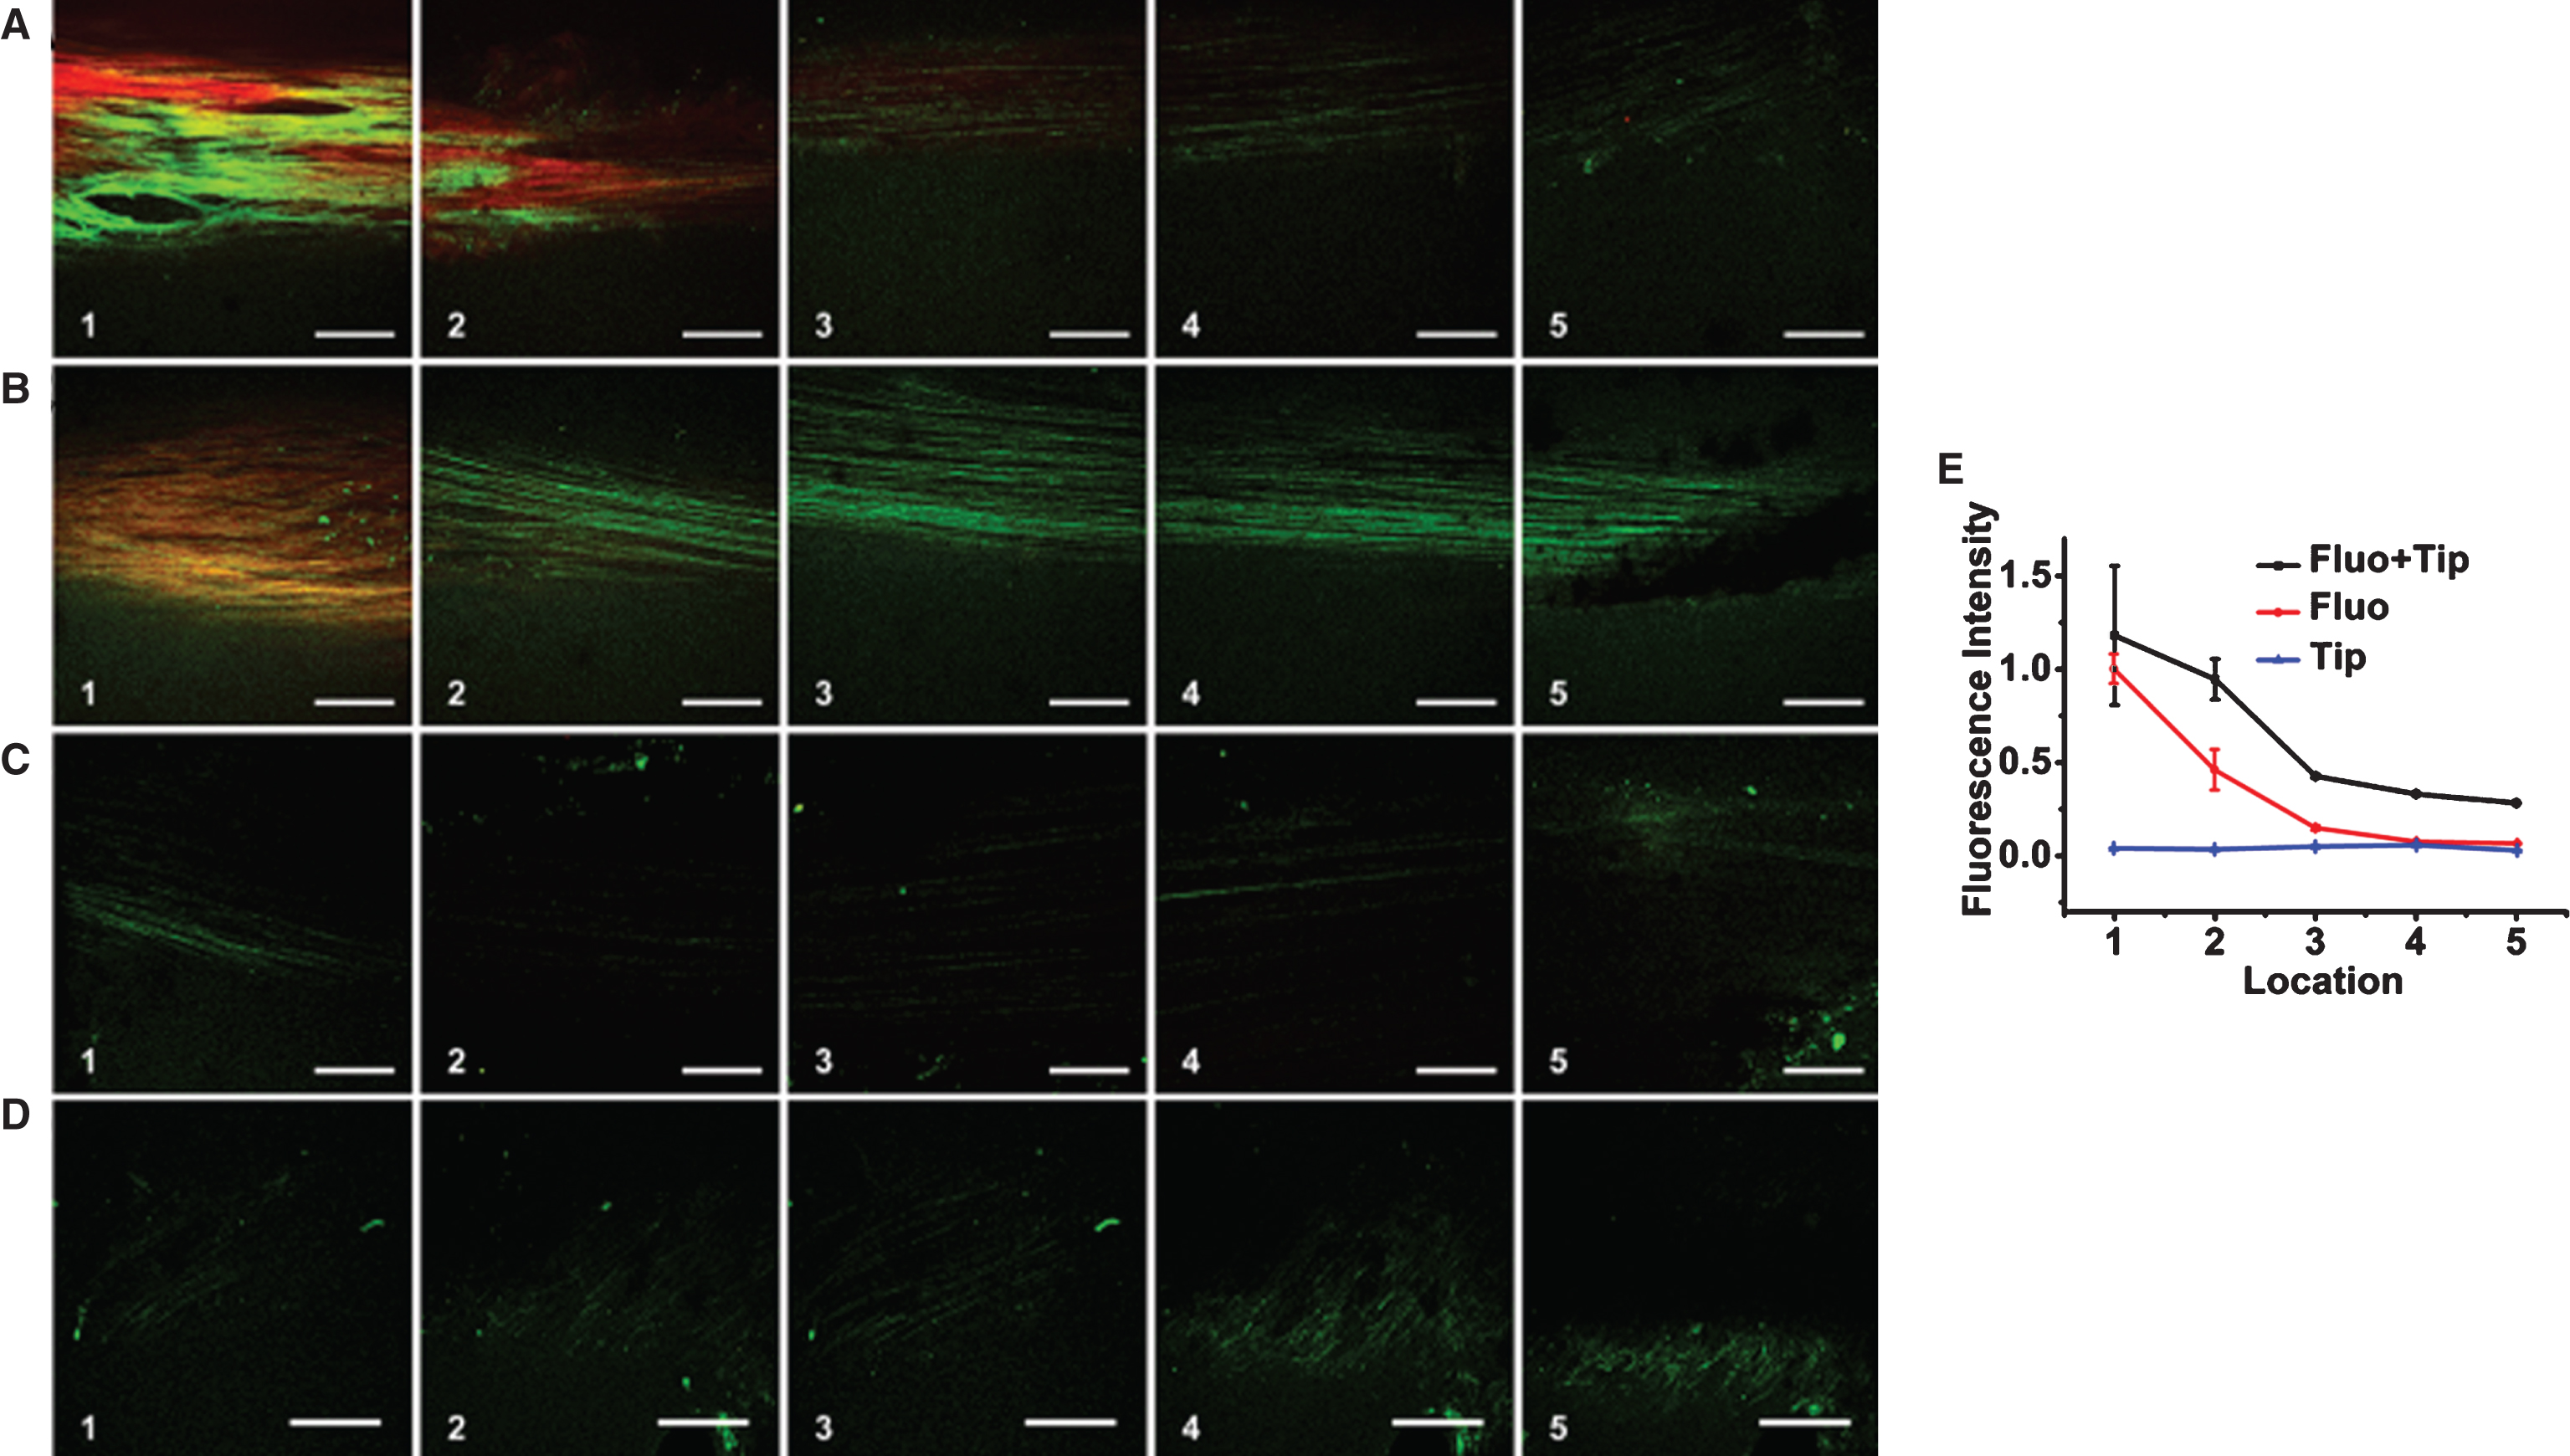
Two-photon fluorescent microscopy images and analysis results. Two-photon fluorescent images of (A) Case 1 (AFM loading with the fluorescent tracer adding). (B) Case 2 (fluorescent tracer adding only). (C) Case 3(AFM loading only). (D) Case 4(no treatment) (E) The fluorescence intensity was analyzed using MATLAB 2012a with the formula mentioned in the method. The image analysis statistical results were processed using Origin 8.5. The bars are standard deviations (n = 35). The green indicates auto-fluorescent, the red indicates fluorescent of rhodamine B.
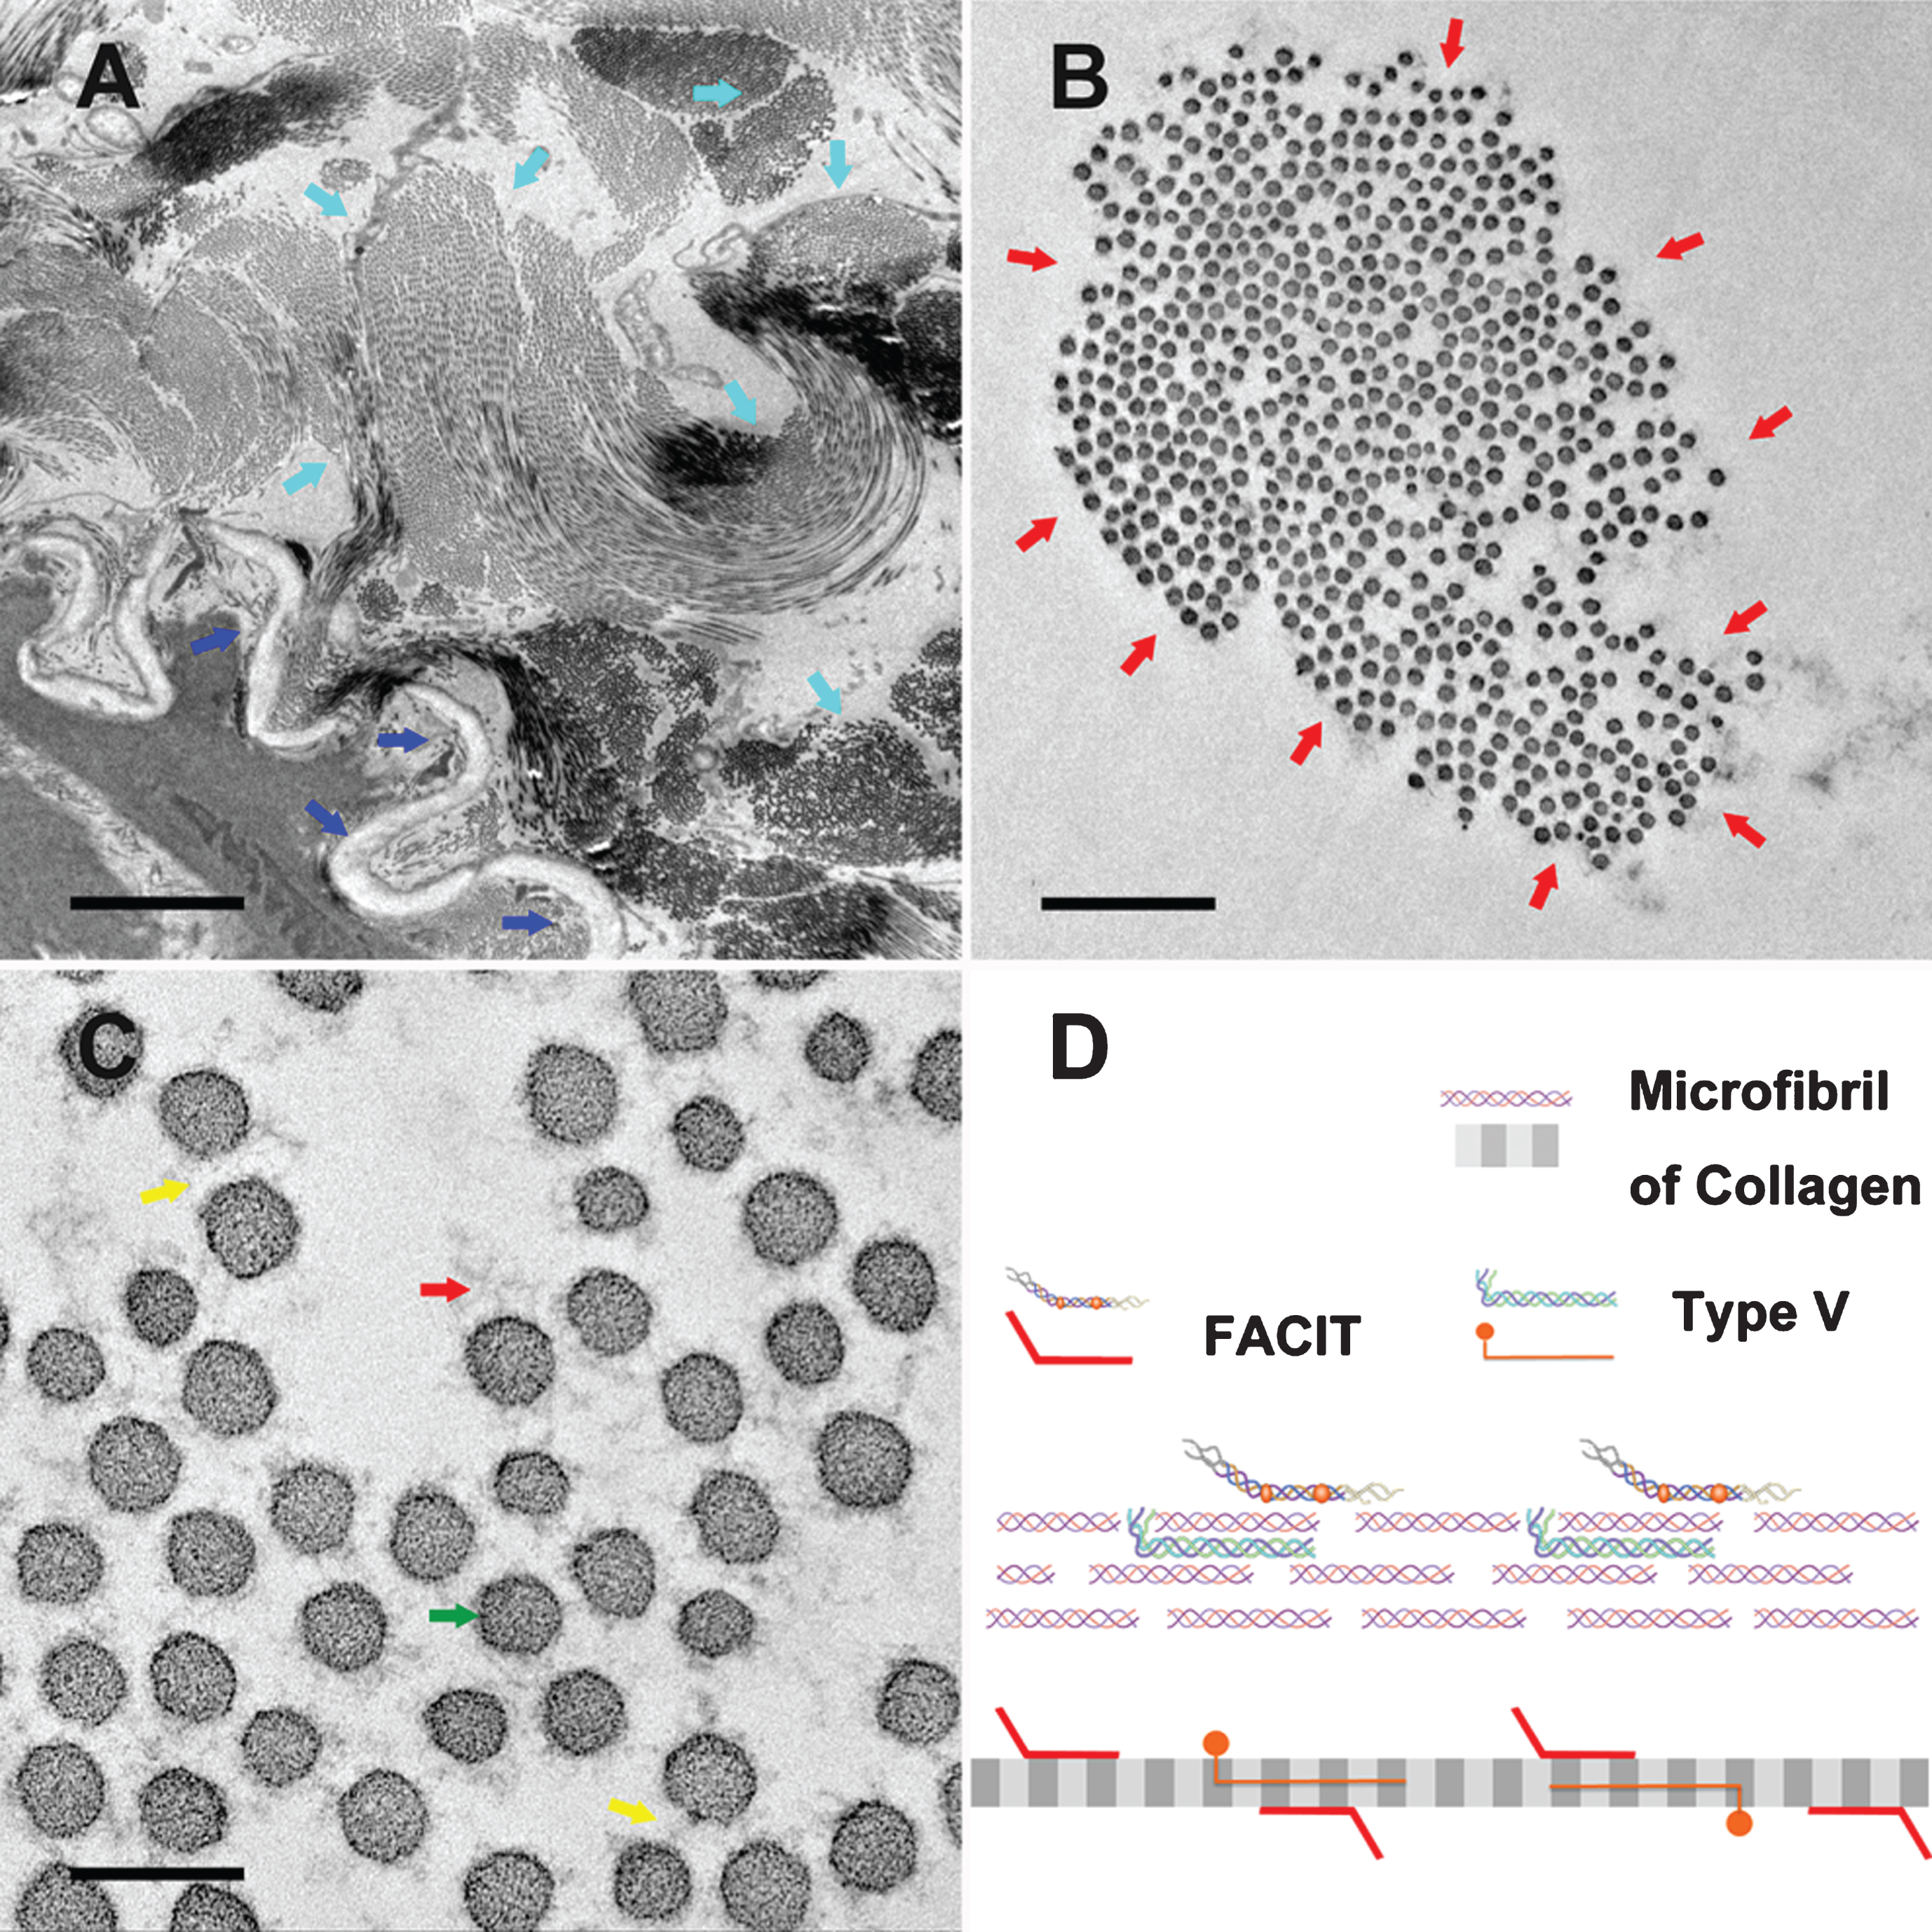
TEM high-resolution images of the adventitia, and a schematic of the collagen microfibril. (A) High-resolution image of the adventitia. Navy blue arrows indicate the tunica adventitia. Light blue arrows indicate the bundles of collagen microfibrils. Scale bar: 5 μm. (B) High-resolution image of a collagen microfibril bundle. Red arrows indicate the ‘hairy’ outside of the collagen bundle. Scale bar: 1 μm. (C) High-resolution image of a collagen microfibril. Red arrows indicate the ‘hairy’ outside of the collagen bundle. Green arrows show the collagen microfibrils. Yellow arrows show the “hair” between the microfibrils. Scale bar: 200 nm. (D) Schematic of a collagen microfibril structure.
Ethical statement
All animal experiments and procedures were approved by the Animal Care and Use Committee and were performed in accordance with the Guide for the Care and Use of Laboratory Animals (NIH publication No.85–23, National Academy Press, Washington, DC, USA, revised 1996).
IVC extraction and preparation of AFM loading substrate
Pathogen-free, adult male Wistar rats, weighing 300–350 g (Charles River Technology, Vital River Laboratories Beijing Co. Ltd.), were chosen as the source of the IVC. IVC extraction was performed under anesthesia with intraperitoneal injection of 3.5% (w/v) chloral hydrate (1 ml/100 g body weight). Briefly, the rat was placed in supine position on a pad. The thoracic cavity was opened and the IVC was exposed. An 18-gauge detaining needle (Becton Dickinson and Company) was placed into the IVC. Two 4–0 silk sutures were tied over the IVC below the left atrium and above the diaphragm, respectively. The IVC and the plastic tube of the detaining needle within the IVC were cut off (Fig. 1A) and washed with physiological saline.
The gelatin (c = 0.1 g ml–1, water) was melted at 60°C, and 0.3 ml of gelatin was evenly spread on top of a 22×22 mm2 clean cover glass. The suture threads on the IVC were trimmed to leave only one end. Then, half of the IVC sample was immersed in the gelatin. The cover glass was placed on an ice cube to cool down the gelatin and form a thin film to fix the IVC (Fig. 1B). The thread was lifted up from the gel and cut off to generate a thin groove for the addition of the fluorescent tracer.
AFM loading (See Fig. 1)
Four samples were randomly divided into 4 cases: Case 1 with AFM loading and the fluorescent tracer adding; Case 2 with fluorescent tracer adding only; Case 3 with AFM loading only as the control group; Case 4 with no treatment.
We numbered the point where fluorescent tracer was added as point 1, and the AFM loading positon as point 5. Point 2, 3 and 4 were lined evenly between point 1 and point 5. The detailed setup of the experiment is shown in Fig. 1D. To facilitate the locating process, an AFM (5500, Agilent) was mounted on an inverted microscope (Ti eclipse, Nikon). For Case 1, normal direction pressure was repeatedly loaded onto point 5 by AFM for 2 h, using a tipless cantilever (NSG11-tipless, NT-MDT), with a force constant equal to 11.5 N·m–1. The loading rate was 1 Hz and loading speed was 15 μm·s–1. The max contact force was 287.5 nN. To avoid capillary force between the sample and AFM cantilever, we immersed the cantilever in a small droplet of water (Fig. 1C) [24], and then performed the experiment in a local liquid environment. Just before the start of AFM loading, 5 μl of the fluorescent tracer rhodamine B (Sigma-Aldrich) was added through the groove made in the gelatin to point 1. For Case 2, only rhodamine B was added to the sample without AFM loading. For Case 3, AFM loading was performed as described above for Case 1, but without adding rhodamine B. Case 4 as the control group was set up without AFM loading or fluorescent tracer adding.
Sample preparation for two-photon fluorescent imaging and observation
The IVCs were gently removed from the gelatin and flipped over. Subsequently, the IVCs were spread on the glass bottom of confocal petri dishes, respectively. Cover glasses were pressed onto the IVCs to flatten them. Melted gelatin was filled in through the edge of the cover glass to fill in the space between the cover glass and IVC. The confocal petri dish was cooled down to solidify the gelatin.
Observations were made with an inverted fluorescent microscope (IX71, Olympus) (Fig. 1D). To choose suitable observation points, we equally divided the IVC from point 1 (the fluorescent tracer-added end) to point 5 (the AFM loading end) into 4 sections, referred to as point 1, 2, 3, 4, and 5, respectively. First, we focused the objective (20X, NA 0.4, UPLSAPO, Olympus) at point 1 to choose the optimal imaging parameters, including imaging planes, intensity of exciting light, and exposure duration. Once the imaging parameters were chosen, these settings were maintained for all observation points. We successively took the z-stack at each point, with a step size of 1 μm and z scan range of 40 μm, in two channels: 820 nm for rhodamine B and 760 nm for auto-fluorescence. All 4 cases were examined using the same strategy described above.
Image analysis
We used custom-made programs written in MATLAB (MathWorks 2012a) to track the average fluorescence intensity change along each observation point. Considering the fluorescent area in the auto-fluorescent channel as the area of the IVC, the average fluorescence intensity over the unit area of the IVC at each observation point was computed using the formula:
Sample preparation for TEM and observation
A piece of the saphenous vein of the mouse which is under anesthesia was separated from the body and washed several times with phosphate-buffered saline. After fixation in 2.5% (v/v) glutaraldehyde for 3 h and treatment with 1% (w/v) osmium tetroxide for 3 h, the vessel specimen was dehydrated through a graded series of ethanol solutions of 30%, 50%, 70%, 85%, 95%, and 100% for 20 min each. Acetone replacement was performed three times and the sample was embedded with resin in an incubator and dried under the following conditions: 30°C for 12 h, 33°C for 3 h, 35°C for 3 h, 37°C for 12 h, 40°C for 5 h, 43°C for 3 h, 45°C for 12 h, 47°C for 5 h, 50°C for 5 h, 53°C for 3 h, 55°C for 5 h, and 60°C for 24 h. Specimens were then sectioned and stained with uranyl acetate and lead citrate. Finally, imaging was performed using TEM (Ht-7700, Hitachi).
Results
Two-photon fluorescent imaging
Without fluorescent tracer, we only observed stable autofluorescence under long time AFM loading (Fig. 2C). The addition of fluorescent tracer reflects the transportation along the collagen fibrils (Fig. 2B). The combination of fluorescent tracer and AFM loading exhibited faster and longer transportation, indicating the extra driver potential facilitating this transportation within the collagen bundles (Fig. 2A). The intensity decayed with distance in an exponential way similar to normal diffusion (Fig. 2E). Case 3 with only AFM loading can be easily distinguished the collagen bundles twisting along the fluid orientation, while the bundles in Case 4 with no treatment were straggling. This can be clearly seen in Fig. 2E.
TEM observation
We observed a brush-like macromolecule structure of collagen microfibril in LCTs. The collagenous fibers are the main components, and the fibrillary collagen is main composition of the micrometer scale network. These collagen subtypes have exposed N-terminal elongate into the space between fibers like macromolecular brush. (Fig. 3)
Image analysis
The fluorescence intensity was analyzed using MATLAB 2012a with the formula mentioned in the method. The image analysis statistical results were processed using Origin 8.5. The bars are standard deviations (n = 35). The green indicates auto-fluorescent, the red indicates fluorescent of rhodamine B. The intensity decayed with distance in an exponential way similar to normal diffusion (Fig. 2E). The combination of fluorescent tracer and AFM loading exhibited faster and further transportation, indicating the extra driver potential facilitating this transportation within the collagen bundles. This can be clearly seen in Fig. 2E.
Discussion
Mass transportation through gels was hindered up to 20% –80% as compared to transportation through pure water [26]. In this study, we observed that the fluorescent tracer traveled faster with AFM loading compared to simple diffusion. External stimulation from the AFM cantilever could speed up the diffusion rate along the fibers (Fig. 2). Our previous research on the transportation within hydrophobic polycaprolactone (PCL) fibers embedded in polyacrylamide (PAM) hydrogels showed the addition of hydrophobic fibers introduced extra three phase interfaces and conducted fast interfacial transportation as “green pathways”. The case presented here is slightly different, as the samples were collected from the tissues around an actual vein, and were enriched with hydrophilic collagen and elastic fibers. Without the three-phase interfaces formed around the hydrophobic fibers, the diffusion rate of fluorescent tracer was indeed much lower and showed no anisotropy. However, external stimulation could still drive a faster transportation along the fibers, this suggested that there existed other controlled pathways for transportation between collagen bundles.
The structure of the fibers inside the LCTs was then evaluated more comprehensively using TEM, which revealed the hierarchical structure from protein molecules to fiber bundles. This structure is in line with a plausible pathway for fluid and solutes to transport along the fibers inside LCTs, and supports the proposed in vivo “green pathways” reported previously [11]. In the high-resolution TEM images (Fig. 3A-C), the fibrils appeared to be “hairy” with glycosaminoglycans rather than smooth surfaces. These hairy macromolecule chains served to separate the fibrils at a stable distance inside the bundles, and supported the hypothesis of the presence of green pathways on the outer surfaces of the bundles (Figure S2).
Physically speaking, it has been noted that a surface decorated with polymer brushes would greatly alter the hydrodynamic property, either by hindering the fluid or reducing the resistance [26, 27]. Although the detailed mechanism is still controversial and lack of integrated investigation of this system, the intrinsic properties of polymer chains and the graft density are considered the two most important factors affecting the hydrodynamic property. Considering static conditions, the flexibility of polymer chains can be characterized by the persistent length l
p
. Therefore, we propose a parameter S
p
to indicate the state of polymer chains under fluid as Equation (1):
Here, d denotes the actual length of the polymer chains. The glycosaminoglycans inside the bundles were overlapped and compressed to a lower d, but remained free to swing around the bundle boundaries with higher d. This causes differences in flexibility and water affinity across the bundles, and can result in the formation of a faster route on the outer bundle surfaces. Second, the reduction of fluid resistance was only observed at high graft densities. With lower graft densities, the isolated polymer chains were considered to increase the surface roughness and enhance the fluid resistance. By increasing the graft density, the polymer chains could make contact and exhibit a collective effect by conformation synchronization. A correlation coefficient, r
p
, can be used to describe the degree of collective synchronization as shown in Equation (2):
Here ρ denotes the graft density, c
i
is the conformation of chain i, and c
j
is the conformation of neighbor chains in the collective area. Under continuous scouring, the correlation is expected to increase as the polymer chains adapt their conformation collectively, and hence reduce the flow resistance. Therefore, in static view, the flux driven by a certain free energy, F, can be written as Equation (3)
Further, we considered a dynamic situation by periodically pressing the AFM tip, similar to a peristaltic pump. The press–relaxation process actually drives water out and into the bundles and surrounding tissues. The press process immediately extrudes water from the bundles into the surrounding gels; given that liquid is almost incompressible, it can conduct the stress to the surrounding areas. By contrast, the relaxation process takes effect by recovery of soft tissue conformations, which is a relatively slow and gentle process. However, the high-speed punch spreads over a short distance and decays fast, whereas the gentle sucking process spreads over a long distance and is durable. Owing to the unbalanced cycle of pressing and relaxation, the water and solvents were gradually transported closer from a distance. This explains why the initial diffusion was observed after stimulating for a while but continued even after the stimulation stopped. The existence of surface polymer chains also likely contributed to this effect, as the polymer conformation cannot adjust immediately, and hence, it exhibits different resistances with opposite fluid directions. Overall, the flux driven by periodic pressing through the gel and fiber system can be calculated as in Equation (4):
Here f is the frequency of pressing, and ΔV
water
is the net water volume through the area of S
section
during one press–relaxation cycle. Since water molecules have strong interactions with the gel and fibers, ΔV
water
is not linearly related with the compression ratio, but is instead affected by the f in a non-linear manner as in Equation (5).
Here, ΔV denotes the change in volume induced by compressing, and Q(f) is coefficient on frequency. As discussed above, the relaxation decay is a characteristic of soft matter, which creates the response difference of fluid between the inside and outside, and facilitates the continuous transport. The mechanism is depicted clearly in the schematic diagram (Fig. 4).
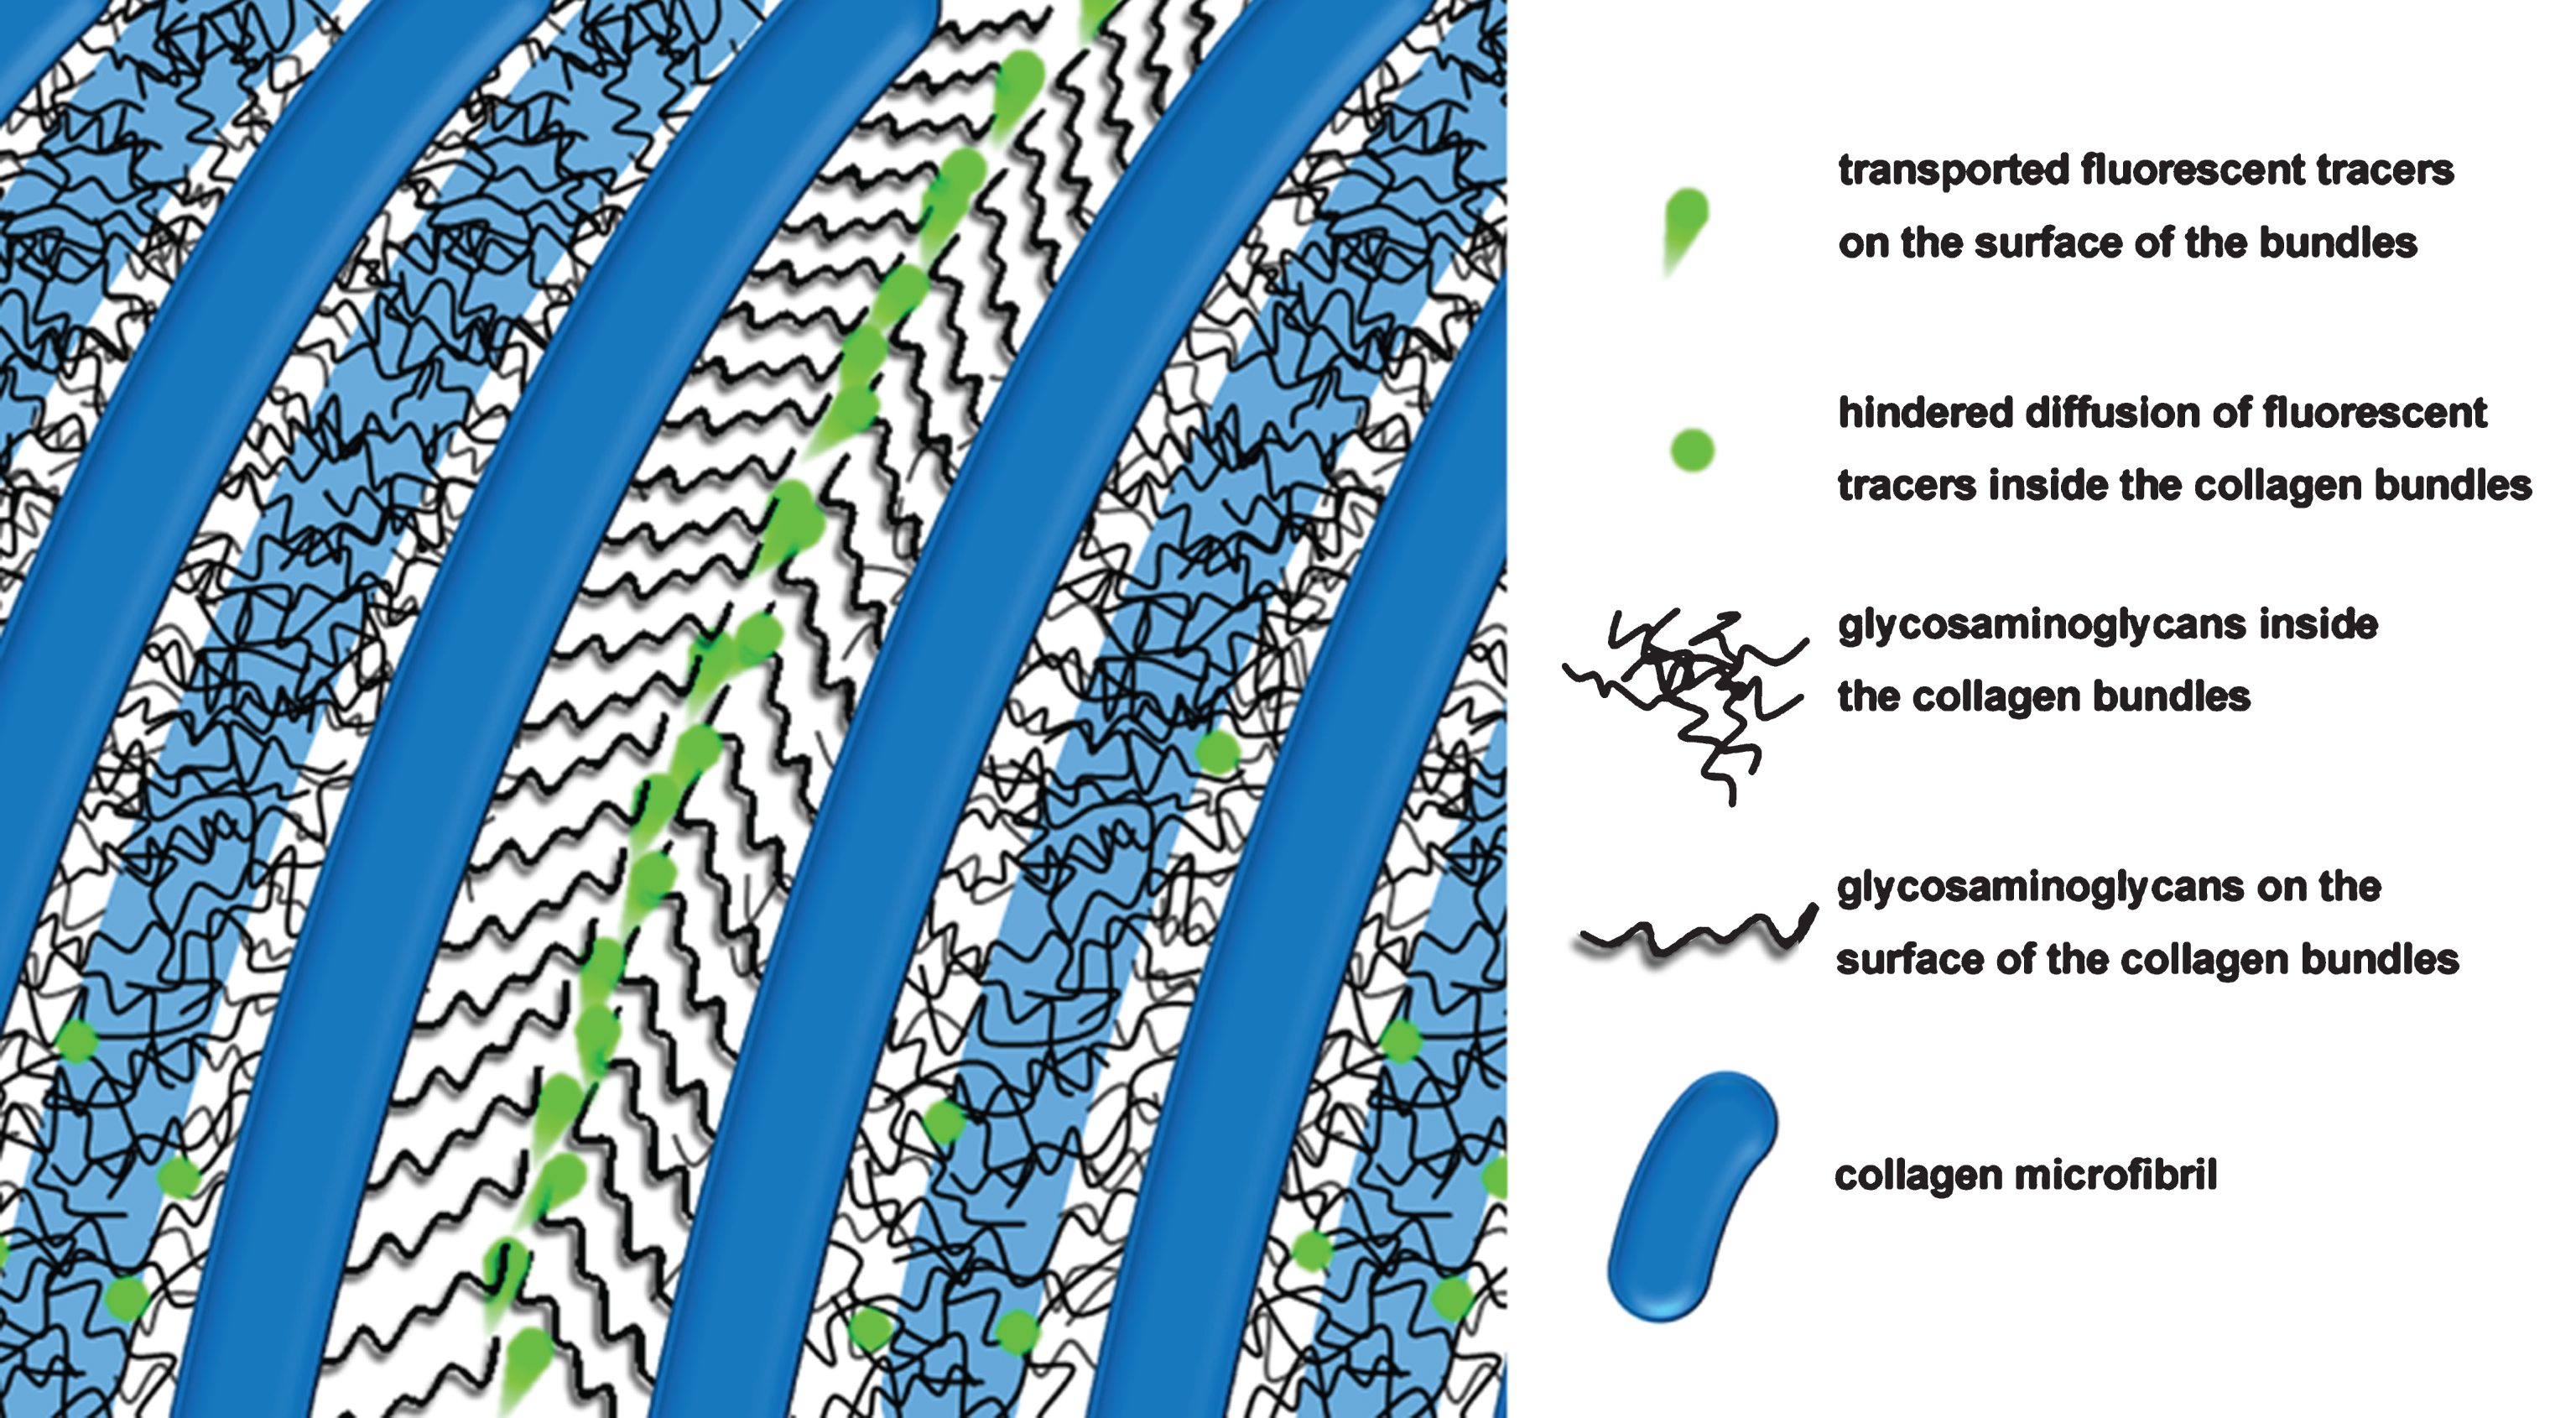
Schematic of fluids and solutes transport through “hairy” macromolecular brushes grafted bundles with hierarchical structure. The black lines represent the glycosaminoglycans on collagen microfibrils, and the green dots represent the transporting solutes with arrows indicating their moving direction and speed. The macromolecule chains inside the bundles are overlapped and compressed, while remain free to swing around the bundle boundaries. Also under continuous scouring, the conformation correlation is expected to increase as the polymer chains adapt their conformation collectively, and hence reduce the flow resistance on the bundle surface. This makes the fluid and solutes transport more easily through the surfaces of the bundles than the inner spaces.
In the present ex vivo study, we found that fluid transportation is facilitated within the macromolecular brush-like structure of soft matter, i.e., a collagen microfibril network coupled to a brush-like macromolecule, under a potential energy gradient. Although the case in vivo is much more complicated than the present case with AFM loading, the superlubricity of brush-like macromolecules coupled to the collagen microfibrils with the hierarchical structures demonstrates an interesting perspective for understanding the process of mass transportation in vivo. According to the principles elucidated herein, researchers should pay more attention to the hierarchical structure of both soft matter and grafted brush-like macromolecules in biological systems, both in vivo and in vitro. Furthermore, closer evaluations of tissue fluids and their transport are wanted. In the classical view, long-distance transportation of tissue fluid is carried out by means of the vascular system rather than by LCTs. Developing a deeper understanding of these processes could inspire new designs and technologies for biological graft materials, taking advantage of the hierarchical structure of soft matter to achieve a better transport effect for several applications such as bio-sensing in a confined space, controlled molecular transport and separation, bioengineering, and tissue repair.
