



Abstract
BACKGROUND:
Preclinical studies report that higher plasma viscosity improves microcirculatory flow after haemorrhagic shock and resuscitation, but no clinical study has tested this hypothesis.
OBJECTIVE:
We investigated the relationship between plasma viscosity and sublingual microcirculatory flow in patients during resuscitation for traumatic haemorrhagic shock (THS).
METHODS:
Sublingual video-microscopy was performed for 20 trauma patients with THS as soon as feasible in hospital, and then at 24 h and 48 h. Values were obtained for total vessel density, perfused vessel density, proportion of perfused vessels, microcirculatory flow index (MFI), microcirculatory heterogeneity index (MHI), and Point of Care Microcirculation (POEM) scores. Plasma viscosity was measured using a Wells-Brookfield cone and plate micro-viscometer. Logistic regression analyses examined relationships between microcirculatory parameters and plasma viscosity, adjusting for covariates (systolic blood pressure, heart rate, haematocrit, rate and volume of fluids, and rate of noradrenaline).
RESULTS:
Higher plasma viscosity was not associated with improved microcirculatory parameters. Instead, there were weakly significant associations between higher plasma viscosity and lower (poorer) MFI (p = 0.040), higher (worse) MHI (p = 0.033), and lower (worse) POEM scores (p = 0.039).
CONCLUSIONS:
The current study did not confirm the hypothesis that higher plasma viscosity improves microcirculatory flow dynamics in patients with THS. Further clinical investigations are warranted to determine whether viscosity is a physical parameter of importance during resuscitation of these patients.
Introduction
Following traumatic haemorrhagic shock, strategies for resuscitation are usually guided by circulatory parameters such as mean arterial pressure and cardiac output, and biochemical markers of perfusion, such as lactate, base deficit, and oxygen partial pressures. Although these parameters are surrogate markers for tissue perfusion, the true physiological association between the macro- and microcirculation may be disrupted during periods of loss of haemodynamic coherence [1, 2], when conventional parameters may not adequately reflect the state of the microcirculation. There has been recent clinical evidence that microcirculatory flow is superior to macrocirculatory parameters in predicting subsequent organ failure after traumatic haemorrhagic shock [3], and a number of studies have investigated the relationship between the microcirculation and clinical outcomes following shock [4]. The importance of the microcirculation in the management of shock has prompted some investigators to propose direct microcirculatory monitoring as one strategy for assessing status of critically unwell patients [5–8].
There have not yet been any clinical investigations of the effects of resuscitation fluids on microcirculatory flow following haemorrhagic shock, although there have been many preclinical (animal) studies [9]. Evidence from preclinical studies suggests that the physical (rheological and osmotic) properties of resuscitation fluids may be as important as their constituents in the restoration of microcirculatory flow [9, 10]. In particular, some investigators have shown that higher plasma viscosity may improve microcirculatory flow in small animal models of haemodilution [11] and haemorrhagic shock [12–15]. Since these findings were not confirmed by larger animal models [16, 17], there is some uncertainty about which evidence might be translatable to patients. A large study of healthy human volunteers reported that higher plasma viscosity was associated with better capillary flow during post-ischaemic hyperaemia [18]. A clinical investigation of the influence of plasma viscosity on microcirculatory flow dynamics following shock is warranted, since this may impact on the optimum choice of fluid for resuscitation.
Barras originally proposed that plasma viscosity may be the main influencing parameter on capillary flow, because blood viscosity approaches plasma viscosity in these micro-vessels [19]. The magnitude of blood viscosity depends in a non-linear fashion on the haematocrit (volume fraction of red blood cells), and is proportional to the suspending phase, plasma viscosity [20–22]. The apparent viscosity of the blood decreases markedly in micro-vessels with diameter <100μm due to the Fahraeus effect, whereby haematocrit decreases from the systemic values due to phase separation and central flow of the red cells; a minimum viscosity occurs in capillaries with diameter ∼7μm where the red cells are aligned in a single column [23]. However, plasma viscosity continues to influence flow resistance regardless of haematocrit, and changes in this factor will affect perfusion at all levels of the vascular tree. Indeed, within the microcirculation, the plasma viscosity may be particularly influential given the reduction in local haematocrit, as described by Barras [19]. During periods of physiological compromise such as haemorrhagic shock, changes in overall blood viscosity may directly influence microcirculatory perfusion due to loss of autoregulation [24]. Thus, alterations in haematocrit and plasma viscosity that influence blood viscosity are expected to influence tissue perfusion, and may be important determinants of microcirculatory flow after traumatic haemorrhagic shock. However, this possibility has not yet been investigated in human subjects.
We sought to investigate the relationship between sublingual microcirculatory flow dynamics and plasma viscosity in a cohort of patients with traumatic haemorrhagic shock. We hypothesised that higher plasma viscosity would improve microcirculatory flow in keeping with evidence from preclinical studies [9] and healthy subjects [18].
Methods
Study design
The current study is a subgroup analysis of 20 patients from a single site (University Hospitals Birmingham NHS Foundation Trust) within the MICROSHOCK study, a longitudinal prospective observational investigation of patients with traumatic haemorrhagic shock (Registration ID: NCT02111109) [25, 26]. This study was approved by a UK Research Ethics Committee (Ref: 14/YH/0078) prior to patient enrolment.
Patient enrolment
Patients were eligible for inclusion in the MICROSHOCK study if they had been injured, required blood products, had a serum lactate ≥2 mmol/l, were intubated, and required admission to the Intensive Care Unit (ICU). Patients under the age of 18 and those with injuries incompatible with survival were excluded. Patients were unable to consent for themselves due to lack of capacity, and therefore their participation was guided by the Mental Health Capacity Act 2005, the Declaration of Helsinki, and the principals of Good Clinical Research Practice. The doctor in charge of the clinical care of the patient gave permission for study participation. A close friend or relative was also approached to assent to ongoing study participation according to their perceptions of the patient’s wishes. Ultimately if the patient re-gained capacity, their informed consent was sought in order to retain all data previously recorded.
Patients were enrolled in the study as early as possible, preferably in the Emergency Department, or on admission to ICU. This time point was designated as Time Point 1. Data were collected at a further two time points: Time point 2 (24 h later), and Time Point 3 (48 h after Time Point 1).
Imaging of the microcirculation
Sublingual video-microscopy was performed to obtain video clips of the microcirculation using an Incident Dark Field (IDF) video-microscope (Cytocam, Braedius Medical B.V., Huizen, The Netherlands). The video-microscope was placed gently under the tongue of patients and aimed towards the sublingual mucosa until a clear image was obtained on the video monitor. Care was taken to only view sublingual microcirculation (rather than the characteristic looped tongue vessels), and to minimise artefacts (including saliva and sediment), optimise the illumination and focus, and minimise movement and pressure artefacts, in order to achieve the highest quality video clips for analysis [27]. At least 3, and preferably 5 separate clips from different areas of the sublingual mucosa were recorded according to consensus guidelines [28]. These clips were stored on an encrypted device and saved for analysis en masse.
Analysis of microcirculatory flow dynamics
All recorded video clips were analysed offline, away from the patient bedside. Each clip was assigned a random number so that they were analysed without the user knowing the patient or time point. Firstly, each clip was scored according to the 6 factors recommended for quality assessment (anatomy, focus, illumination, duration, stability, and pressure artefact) [27]. At least 3, and up to 5 of the clips that were of highest quality were analysed using Automated Vascular Analysis V.3.02 (Microvision Medical, The Netherlands). During analysis of each clip, all vessels ≤20 μm were individually traced, and the computer software calculated the Total Vessel Density (TVD, mm/mm2) of micro-vessels from these tracings. Each vessel segment was then assigned a flow score from 0–3 (none = 0, intermittent = 1, sluggish = 2, and normal = 3), from which the Perfused Vessel Density (PVD, mm/mm2) was derived, according to the density of vessels that have a flow score of ≥2. The Proportion of Perfused Vessels (PPV, %) is derived from the proportion of vessels that have a flow score of ≥2. A flow score was also given for each quadrant, with the Microcirculatory Flow Index (MFI) derived from their average value, according to the Boerma method [29]. The Heterogeneity Index (HI) was calculated as the highest minus the lowest flow score, divided by the MFI. Together, the TVD, PVD, PPV, MFI, and HI form the “ideal analysis report” of the microcirculation, according to consensus opinion [28]. A further composite score for flow and heterogeneity (the Point of Care Microcirculation (POEM) score) was assigned to videos clips according to recently published algorithm [8]. In brief, each of 4 videos from the same patient time point were graded for flow, as “normal”, “impaired”, or “critical”, corresponding to <25%, >25%, and >50% of vessel segments with sluggish or stopped flow. Clips with “normal” flow were then attributed with heterogeneity if >5 vessel segments were different to the remainder, or no heterogeneity. An overall score for all 4 clips was then assigned on an ordinal scale from 1 to 5 according to an algorithm [8]. For TVD, PVD, PPV, MFI, and POEM scores, higher values indicate better microcirculatory function, whereas for MHI a higher value is indicative of poorer microcirculatory function.
Blood sampling
12 ml of peripheral blood was sampled from patients at the same time as video-microscopy, using BD Vacutainers® (Becton Dickinson, Oxford, UK) containing citrate for anti-coagulation (to measure the plasma viscosity) and EDTA (to measure haematocrit). The citrate tubes were taken straight to the laboratory and prepared in order to obtain platelet-free plasma. This was done by centrifuging the samples at 2000× g for 20 minutes; then the upper 2/3rd of the samples were extracted and centrifuged for a second time, at 13,000× g for 2 minutes. On both occasions this was done at 4°C. The resulting samples were stored at –80°C until they were analysed. Care was taken to prepare all samples in an identical manner. The EDTA tube was run through the Sysmex XN-1000 analyser (Sysmex UK, Milton Keynes, UK) to determine the haematocrit.
Measurement of plasma viscosity
Plasma viscosity was determined using a Wells-Brookfield cone and plate micro-viscometer (AMETEK GB Ltd, Harlow, UK). All samples were run at 21°C. A 1 ml sample was added to the plate, and the cone was rotated to provide a shear rate of 230s–1 and maximum detectable viscosity of 10 mPa·s. The instrument was validated before and after samples using distilled water, which yielded a viscosity of 1 mPa·s (in keeping with the expected viscosity of water of 0.98 mPa·s at 21°C [30]). All samples were run three times, and an average value obtained. The cone and plate were cleaned after every sample in order to eliminate residual protein deposits on the instrument.
Clinical data
This non-interventional study did not influence the fluid or inotropic delivery. Observational data were obtained regarding physiological parameters at the same time as the microcirculatory readings, including systolic blood pressure (SBP), heart rate (HR). Furthermore, the rates of noradrenaline and fluid delivery were recorded at the study time points, as well as the total volumes of fluids and crystalloids delivered since the previous time point (or since injury for the first time point). Data regarding patient characteristics on admission to hospital included age, gender, weight, injury severity score (ISS), APACHE-2, Glasgow Coma Scale (GCS), and lactate.
Endothelial biomarkers and viscosity
A subgroup analysis was planned for the patients from the same cohort who have had biomarkers of endotheliopathy (syndecan-1 and thrombomodulin) reported in a previous study (n = 17) [31]. For these patients, viscosity was compared to biomarker levels for these patients at each time point in order to determine whether endotheliopathy of trauma was associated with differences in viscosity.
Data analysis
The current study investigated the relationship between 6 microcirculatory flow dynamics parameters (TVD, PVD, PPV, MFI, POEM, and HI) and plasma viscosity, as well as each of their relationships with time, using logistic regression analysis. For each microcirculatory parameter that had a statistically significant relationship to viscosity, a series of logistic analyses were performed in order to identify any modifying effects of 7 pre-specified covariates (SBP, HR, haematocrit, rate of noradrenaline, rate of fluids, total volume of fluids, and total volume of crystalloids). Spearman’s correlation co-efficient was used to determine univariate correlations, and reported as r and 95% confidence intervals (CI). A Kruskal-Wallis test was used to compare multiple groups of non-normal continuous variables. A p-value of <0.05 was considered statistically significant.
Results
Patient characteristics
There were 20 patients, of which 19 were male. The characteristics of all study patients are illustrated in Table 1. Because these characteristics were potentially confounding variables, they were compared to plasma viscosity at the first time point, and there were no significant correlations. When these characteristics were compared to the 6 microcirculatory parameters, there was a correlation between age and both PPV (r = –0.586 (95% CI –0.845––0.105); p < 0.05) and HI (r = 0.604 (95% CI 0.133–0.853); p < 0.05) (Table 2).
Study patient characteristics, with all continuous variables compared to plasma viscosity at the first time point
Study patient characteristics, with all continuous variables compared to plasma viscosity at the first time point
IQR: interquartile rage; ISS: injury severity score; SBP: systolic blood pressure; HR: heart rate; GCS: Glasgow Coma Score; CI: confidence interval.
Comparison between potential confounding patient characteristics and all microcirculatory parameters at the first time point
*significant using Spearman’s correlation coefficient. IQR: interquartile rage; ISS: injury severity score; SBP: systolic blood pressure; HR: heart rate; GCS: Glasgow Coma Score; CI: confidence interval.
All patients received crystalloid fluids during the study period, with a median volume of 2000 (IQR 0–3000) ml in between time points, and a median rate of fluid delivery of 1.7 (0–2.1) ml/min. Only 5 patients received colloid fluids at any time during the study period (median volume 1000 (IQR 0–2000) ml. When the rate of fluid delivery was compared to plasma viscosity, there were no significant correlations at the first (r = –0.232; p = 0.401) (Fig. 1a), second (r = 0.202; p = 0.449) (Fig. 1c), or third (r = –0.372; p = 0.172) (Fig. 1e) time points. When the volume of fluids delivered were compared to plasma viscosity, there was a significant correlation at the first time point (r = –0.734; p = 0.0025) (Fig. 1b), but not at the second (r = 0.394; p = 0.131) (Fig. 1d), or third (r = –0.272; p = 0.323) (Fig. 1f) time points.
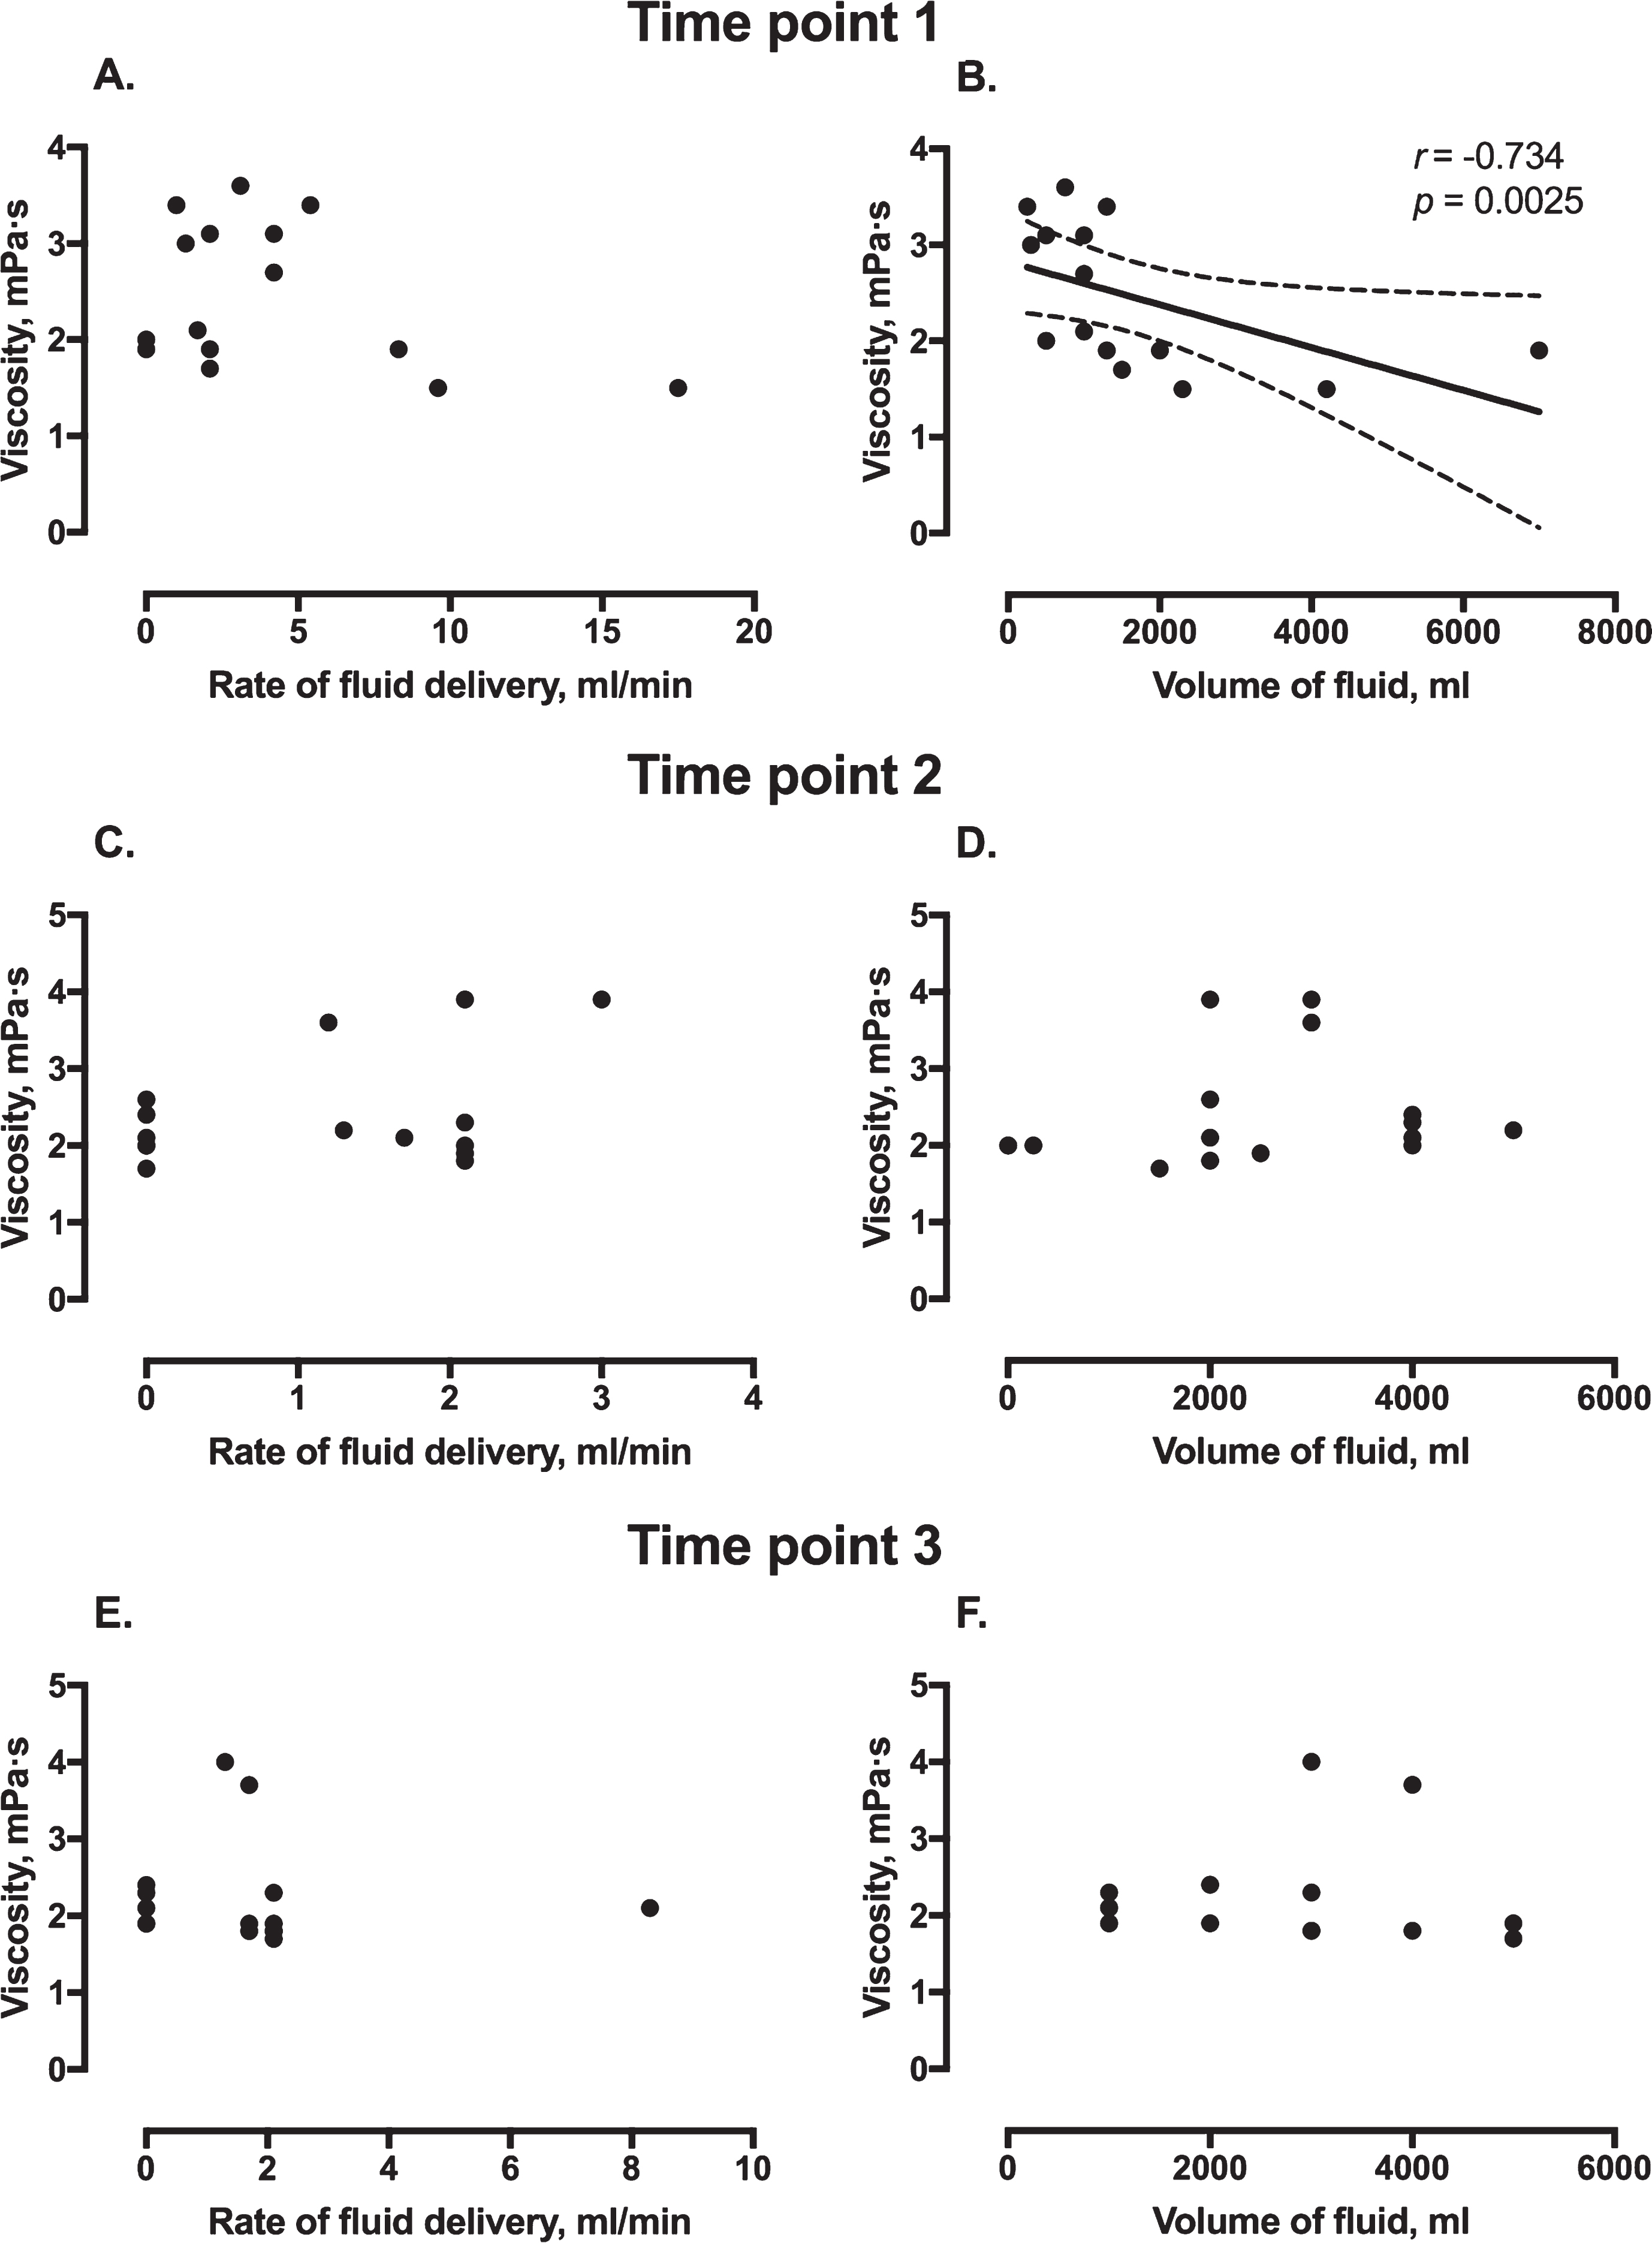
Plasma viscosity according to rate of fluid delivery and volume of fluid at the first (A and B), second (C and D), and third (E and F) time points. Panel B shows the correlation between volume of fluid and viscosity, with interrupted lines indicating 95% confidence intervals.
The median plasma viscosity for all samples was 2.1 (IQR 1.9–2.7) mPa·s. There were no significant differences between time points, with the median values for viscosity at the three time points being 2.1 (IQR 1.9–3.1) mPa·s, 2.1 (IQR 2.0–2.6) mPa·s, and 1.9 (1.8–2.3) mPa·s respectively; p = 0.597.
Plasma viscosity and microcirculatory flow dynamics
Higher plasma viscosity was not associated with improved microcirculatory flow or heterogeneity. Instead, there were weakly significant associations between higher plasma viscosity and lower (poorer) MFI (p = 0.040) (Fig. 2a), higher (worse) MHI (p = 0.033) (Fig. 2b), and lower (worse) POEM scores (p = 0.039) (Fig. 2c). MFI, MHI, and POEM scores all improved over the three time points (p = 0.001) (Fig. 2). When covariates were examined, there were no statistically significant relationships between any of haematocrit, rate of fluids, rate of noradrenaline, total volume of fluids, or total volume of crystalloids with MFI, MHI or POEM scores in models that included plasma viscosity and time. However, there were significant relationships between MFI and both SBP (p = 0.033) and HR (p = 0.047); between MHI and SBP (p = 0.041); and between POEM score and both SBP (p = 0.003) and HR (p = 0.020). After adjusting for these covariates, the weakly significant relationships were unchanged between plasma viscosity and MFI (p = 0.038), MHI (p = 0.037), and POEM scores (p = 0.044). There were no significant associations between plasma viscosity and TVD (p = 0.242), PVD (p = 0.806), or PPV (p = 0.064) (Fig. 3).
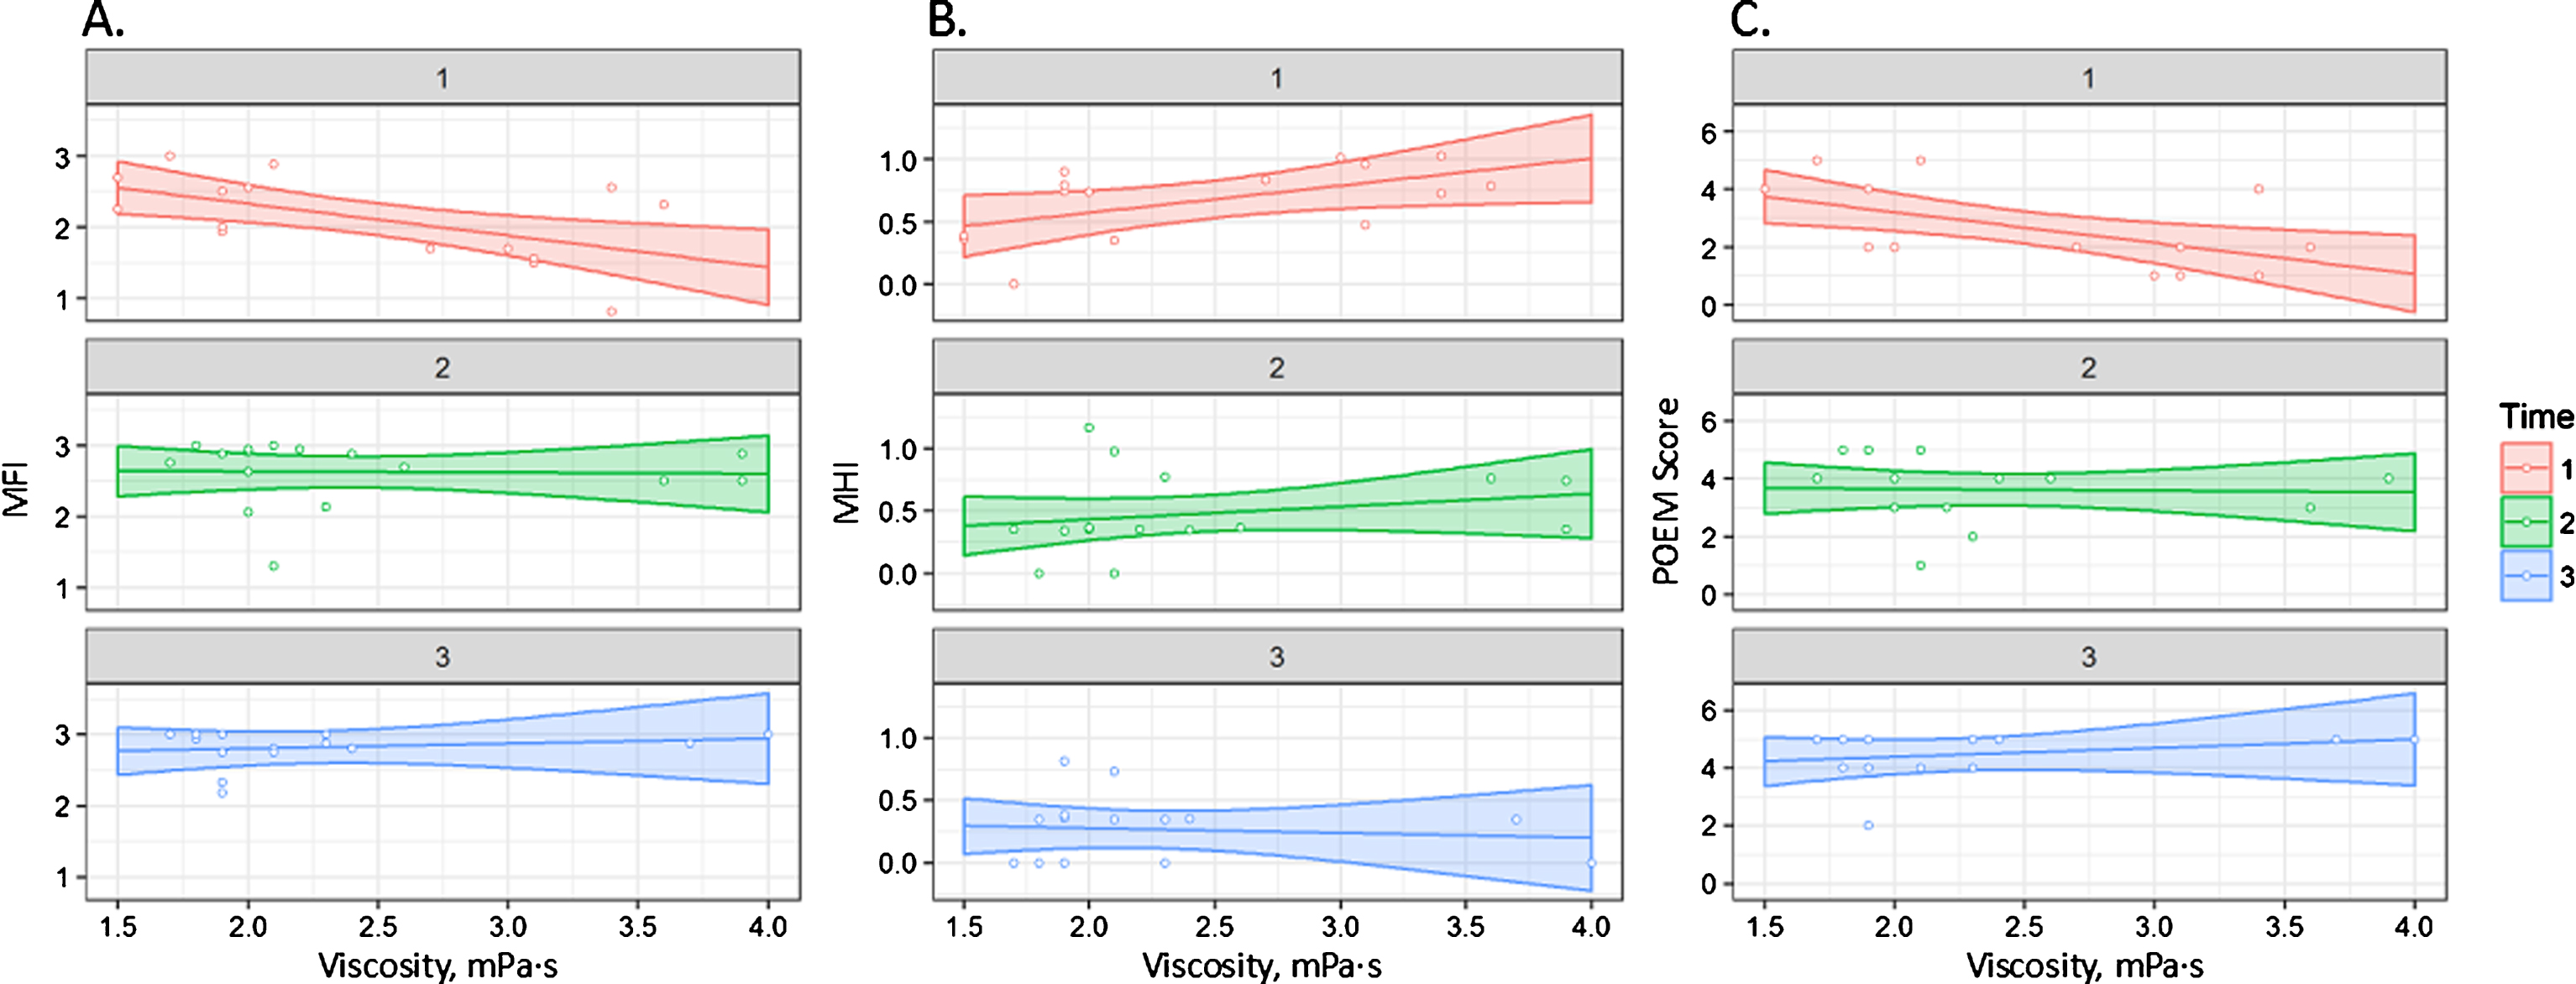
Relationship between plasma viscosity and (A) microcirculatory flow index (MFI); (B) microcirculatory heterogeneity index (MHI); and (C) Point of Care Microcirculation (POEM) score at three time points. The shaded areas indicate the 95% confidence intervals.
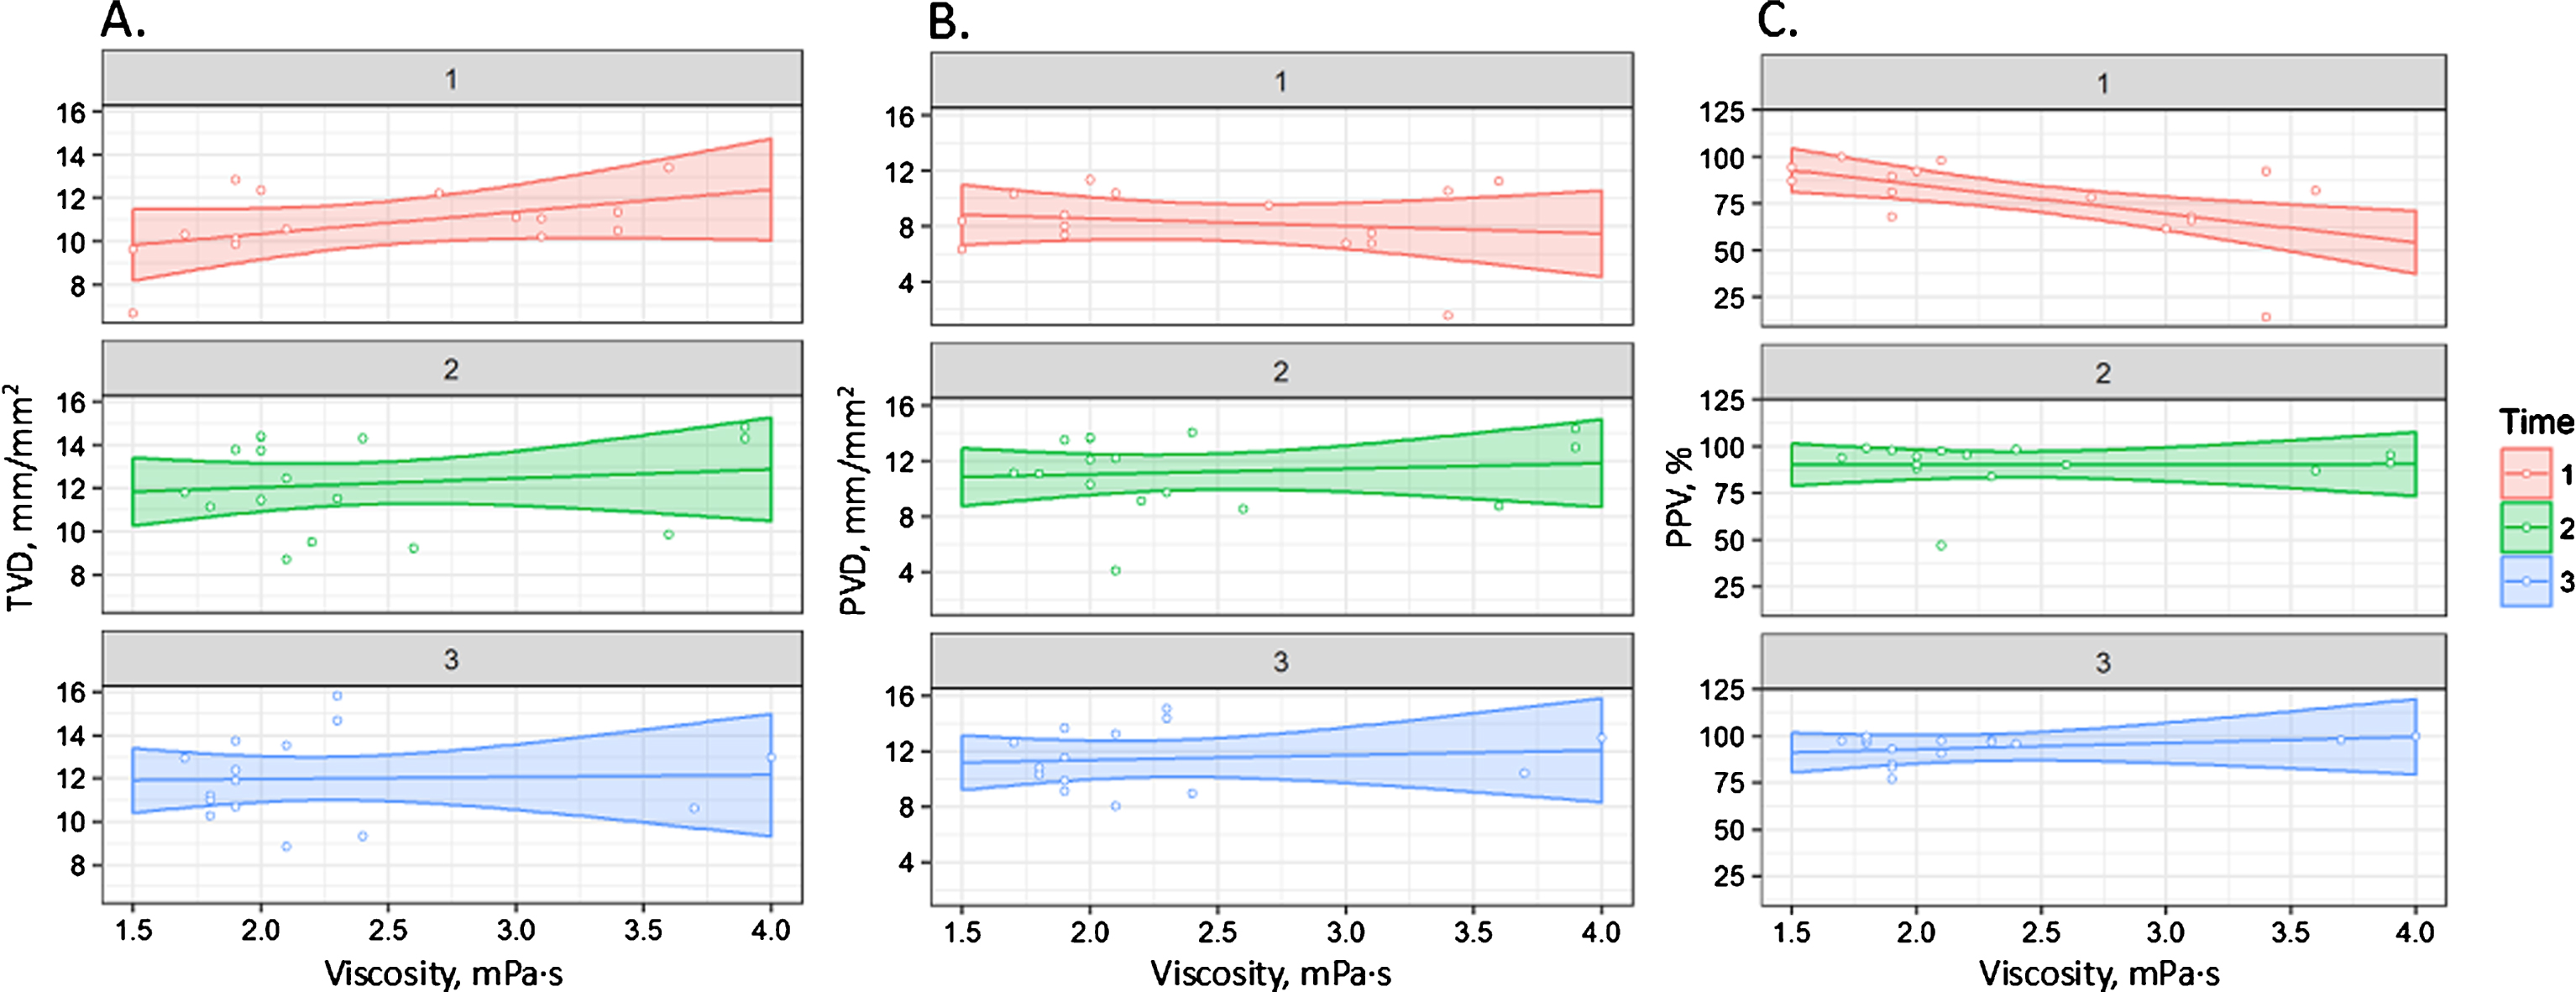
Relationship between plasma viscosity and (A) total vessel density (TVD); (B) perfused vessel density (PVD); and (C) proportion of perfused vessels (PPV) at three time points. The shaded areas indicate the 95% confidence intervals.
When viscosity was compared to levels of syndecan-1, there were no statistically significant correlations at the first (r = 0.409; p = 0.187), second (r = –0.349; p = 0.243), or third (r = –0.305; p = 0.288) time points. There were no statistically significant correlations between viscosity and thrombomodulin at the first (r = 0.123; p = 0.703) or third (r = –0.093; p = 0.751) time points. However, there was a significant negative correlation between thrombomodulin and viscosity at the second time point (r = –0.660; p = 0.014).
Discussion
In this non-interventional study of 20 patients with traumatic haemorrhagic shock, we could not confirm an association between higher plasma viscosity and improved microcirculatory flow dynamics. Indeed, for some of the microcirculatory parameters there was a weak correlation with plasma viscosity in the opposite direction to expected. Furthermore, there were no associations between biomarkers of endothelial disruption and plasma viscosity. Lower plasma viscosity appeared to be associated with higher fluid volumes at the first time point, but not subsequently, and the rate of fluid delivery did not seem to affect plasma viscosity. These findings are in direct contrast to the data reported from experimental studies that utilised small animal models of haemorrhagic shock, which have reported beneficial effects of raising the plasma viscosity on subsequent microcirculatory flow [14, 32–34]. To our knowledge, this is the first study to investigate the relationship between plasma viscosity and microcirculatory flow in human subjects after trauma and haemorrhagic shock.
Viscosity has been proposed as a physical component of interest when choosing the “ideal fluid” to restore the microcirculation during resuscitation from haemorrhagic shock [9]. Preclinical studies have investigated the effects on the microcirculation of fluids designed to be of higher viscosity than conventional crystalloids, such as preparations of hydroxyethyl starch [13, 35], pegylated albumin [36], and the addition of alginate to other preparations [32, 33]. One of the main principles of their design is to deliver a fluid that might be able to restore and sustain tissue perfusion in the microcirculation through adequate plasma expansion, whilst only delivering a small volume and not causing fluid overload [33]. It has been proposed that higher viscosity preparations might remain in the intravascular space for longer, with longer lasting effects on volume and microcirculatory flow [13]. Indeed, some investigators have proposed that there are circumstances where the viscosity properties of red blood cells (RBCs) that are of more importance to the microcirculation than their actual oxygen-carrying capacity [37], and that oxygen extraction ratio in tissues might be improved by increasing the overall viscosity rather than number of RBCs [36]. Data from these experimental studies imply that an environment of higher blood viscosity is desirable for the microcirculation after haemorrhagic shock, and may be a potential strategy for fluid resuscitation. If these findings were applicable to humans, then fluids with higher viscosity would be desirable for low volume resuscitation of patients.
The current study findings are in keeping with those of large animal models that found no effects of plasma viscosity on microcirculatory flow in a canine model [17], and no difference in microcirculatory flow between high and low viscosity fluids in a swine model [16]. It is noteworthy however, that in the latter of these studies, the higher viscosity fluid required a lower volume to achieve the same plasma viscosity and microcirculatory endpoints than the lower viscosity fluid. Such a finding would suggest that higher viscosity fluids might be favourable for low volume resuscitation. Indeed, delivery of a lower volume resuscitation fluid with higher viscosity has been recommended for combat casualties in order to facilitate permissive hypotension [38]. In the current study, the rate of fluid delivery did not appear to influence the plasma viscosity, and the volume of fluids delivered was only correlated with plasma viscosity at the first time point. The majority of fluid given to patients in this study cohort was crystalloid (0.9% saline or Hartmann’s solution), with only 5 receiving any type of colloid at any time during the study period, and therefore no meaningful comparison could be made between different fluid types. Further investigations are required to compared types of fluid, their effects on viscosity, microcirculatory flow, and clinical outcomes amongst patients after haemorrhagic shock.
Previous small animal models of haemorrhagic shock and fluid resuscitation are more in keeping with the physical laws of flow with regards to viscosity in micro-vessels, with the majority of studies using intra-vital microscopy reporting superior flow with higher plasma viscosity [9]. It is likely that under these well controlled conditions, with individually isolated vessels and precise techniques, that flow is more likely to follow the expected physical laws than within the heterogenous sublingual microcirculation of critically unwell human subjects. In the clinical setting there are likely to be many confounding factors that affect the precision of video-microscopy, and make it more difficult to confirm hypotheses generated from these preclinical studies. This may account for the findings in the current study. Nevertheless, the implications of this discrepancy between patients and animal models may be significant when considering the translatability of preclinical studies, and whether the viscosity of resuscitation fluids is indeed a factor of relevance in clinical practice.
Patients in the current study had suffered traumatic injury as well as haemorrhagic shock, and it is likely that these conditions are more complex than those of preclinical studies of haemorrhagic shock alone. Injury is associated with a complex array of early pathological processes such as endotheliopathy [39], coagulopathy [40], and inflammatory dysregulation [41], all of which have the potential to influence viscosity due to changes in circulating molecules and their interaction with the vascular endothelium. The current study did not find consistently significant relationships between biomarkers of endotheliopathy and viscosity in either direction, but a detailed analysis of circulating molecules and viscosity is warranted in a larger cohort of trauma patients. Since haemorrhagic shock is most likely to occur following injury in patients (rather than in isolation), future preclinical investigations of viscosity and microcirculatory flow may have improved translatability if a mode of injury is incorporated into their protocols.
Limitations
The current study has a low number of patients, with all of the statistical implications associated with this. Since no other studies were found that investigated the same research question in humans, a power calculation could not be undertaken. Further investigations are warranted based on our preliminary findings. The patient cohort was heterogeneous, with a wide range in injury types and burden, and treatments. It is possible that there may be different relationships between plasma viscosity and microcirculatory flow in some subgroups and not others, but this could not be determined within the current study. It is acknowledged that guidelines for rheological measurements recommend non-diluent anticoagulants such as heparin [42]. However, our protocol utilised blood collection tubes containing citrate because this was required for additional investigations other than those rheological measurements described here.
Conclusions
In this observational study of patients with traumatic haemorrhagic shock, we did not observe any improvement in microcirculatory flow in the presence of higher plasma viscosity. Indeed, there was some unexpected evidence of superior microcirculatory flow and heterogeneity with lower plasma viscosity. Since these findings are not in keeping with the hypotheses generated from preclinical studies, further clinical investigations are warranted to determine whether a higher plasma viscosity is desirable for patients following traumatic haemorrhagic shock, and whether viscosity is a physical component of importance in the choice of resuscitation fluid for these patients.
Footnotes
Acknowledgments
The authors thank Hema Chahal for her assistance in the laboratory experiments, and the nursing and administrative staff at the NIHR Surgical Reconstruction and Microbiology Research Centre.