
Abstract
BACKGROUND AND OBJECTIVE:
Hemorheologic alterations have been suggested to play a role in the pathogenesis of diabetic microvascular complications. We measured various hemorheologic parameters and assessed their possible role as a diagnostic tool for diabetic nephropathy (DN).
METHODS:
248 subjects with type 2 diabetes and 222 subjects with prediabetes were included in this study. Hemorheologic parameters, including erythrocyte sedimentation rate (ESR), elongation index at 3 Pa (EI) were measured using microfluidic hemorheometer. Various metabolic parameters were measured from fasting blood samples. The subjects were stratified into three groups according to classification of DN by urinary albumin to creatinine ratio (ACR) and four groups by estimated glomerular filtration rate (GFR), than analyzed.
RESULTS:
Significant differences were observed in metabolic and hemorheologic parameters according to progression of DN. Among them, (Fibrinogen×ESR)/ EI differed in all three groups of urinary ACR. In multiple regression analysis, (Fibrinogen×ESR)/ EI was an independent predictor of urine ACR after adjusted with confounding factors (ß = 0.010, p < 0.001). (Fibrinogen×ESR)/ EI also showed significant difference no or minimal CKD stage, moderate CKD and severe CKD classified by GFR. This parameter showed area under curve (AUC) of the receiver operating characteristic (ROC) curve of 0.762, and moderate sensitivity and specificity to predict prevalence of microalbuminuria.
CONCLUSIONS:
(Fibrinogen×ESR)/ EI is a sensitive parameter for screening diabetic nephropathy.
Introduction
The worldwide exponential increase in the incidence of diabetes is causing many serious diabetes-related morbidity, mortality and the consequent economic burden these days [1]. Diabetes related complications are leading causes of end stage renal disease, blindness, and non-traumatic limb amputation in adults [2]. The progression of these complications, especially diabetic nephropathy (DN), can be prevented or delayed if diagnosed early and managed properly [3]. There are several methods for screening DN, and urinary albumin to creatinine ratio (ACR) is most widely used to detect early DN. Microalbuminuria, defined as a ACR between 30 and 300mg/g creatinine is known as a strong predictor for developing irreversible DN and cardiovascular events [4, 5].
Although spot urine ACR is relatively simple and more convenient compared to traditional 24-hour urine albumin collection, it still requires high costs and patient’s compliance. Some patients have difficulties in collecting urine sample properly. Moreover, there are several limitations for spot urine ACR as a screening tool for DN. It may be affected by comorbidity such as congestive heart failure, severe hypertension or uncontrolled hyperglycemia, infection or fever as well as menstruation and exercise within 24 hours independent of kidney damage. Up to 40% daily fluctuation of urine ACR has been reported. Because of biological variability in urinary albumin excretion, 2 out of 3 specimens of urinary ACR collected within a 3 to 6 month period has be abnormal to confirm albuminuria and thus diagnose diabetic nephropathy [6]. Therefore, there have been efforts to search for a stable, complementary screening tool for early DN.
Hemorheologic alterations have been shown to occur at very early stage of diabetes. Glycation of red blood cell (RBC) membrane and hemoglobin stiffened the RBC membrane and reduce RBC deformability [7]. When microvascular vessels are exposed to flowing less deformable RBCs for long period of time, there might cause mechanical damages on the vessel walls and result in either narrowing or hardening process of vessel wall. So reduced RBC deformability causes a significant increase of blood viscosity and afflict the microcirculation [8], finally cause vascular complications of diabetes [9]. There are various methods for measuring RBC deformability, but EI measured by ektacytometry via laser diffraction analysis of RBC has been known as a simple, reliable marker of RBC deformability. Also, hemorheologic changes can be assessed with point-of-care testing with a high reproducibility [9]. Thus hemorheologic parameters could be candidates for more stable diagnostic methods than spot urine ACR for early DN. There were some previous studies trying to evaluate hemorheologic alterations on DN, but they were conducted only with a small number of subjects and limited laboratory results [10–13].
In this study, we assessed the alterations of hemorheologic parameters in prediabetes and type 2 diabetes patients in various stages of DN and investigated its possible role as a supplementary or complementary early diagnostic marker for DN.
Methods
Study population
This study population consisted of 248 subjects with type 2 diabetes mellitus and 222 prediabetes subjects. The diagnosis of diabetes mellitus and prediabetes were based on a previous history of diabetes or the American Diabetes Association’s diagnostic guidelines. The study population was divided into three groups according to their spot urine ACR. 375 subjects were classified as normoalbuminuric group (ACR < 30mg/g creatinine), another 55 subjects as microalbuminuric group (30≤ACR≤300mg/g creatinine), and last 40 subjects as macroalbuminuric group (ACR > 300mg/g creatinine). 454 of the subjects who could calculate estimated Glomerular filtration rate (GFR) were also divided into five groups according to the classification of chronic kidney disease (CKD) stages proposed by American Diabetes Association [6]. GFR was calculated using the Modification of Diet in Renal Disease (MDRD) formula as follows: 186×(creatinine) - 1.154×(age) - 0.203×(0.742 if female). 340 subjects were classified as non-CKD group (ACR < 30g/mg creatinine and GFR≥60ml/min/1.73m2), 31 subjects as CKD stage 1 (ACR≥30mg/g creatinine and GFR≥90 ml/min/1.73m2), 21 subjects as CKD stage 2 (ACR≥30mg/g creatinine and 60≤GFR < 90 ml/min/1.73m2), 52 subjects as CKD stage 3 (30≤GFR < 60ml/min/1.73m2), 10 subjects as CKD stage 4 and 5 (GFR < 30ml/min/1.73m2) respectively. We exclude subjects with with anemia, acute illness, cancer, abnormal liver function, or other conditions, including any RBC disorders or malignancy from the study. Subjects with chronic inflammatory disease which could present hemorheologic abnormality were also excluded.
Study design
This study is a cross-sectional study, in which all data and samples were collected at a baseline visit, and includes subjects from the Gangnam Severance Hospital. History of current and past disease of patients was obtained from all patients by a standardized questionnaire. The study protocol was approved by the Institutional Review Board of Gangnam Severance Hospital, Seoul, South Korea. (Approval number: 2010–0272).
Measurements
Anthropometric and biochemical parameters
We measured the height and weight of each study subjects and calculated the body mass index (BMI, kg/m2). Blood pressure was measured twice in the sitting position using an automated blood pressure monitor (HEM-7080IC; Omron Healthcare, Lake Forest, IL, USA), and a mean value was calculated. Blood samples were obtained from all subjects after 8 hours of fasting. Blood samples were drawn into sodium citrate tubes (BD, Franklin Lakes, NJ, USA), and immediately centrifuged at 800 g for 12 minutes, and stored at –70°C until analysis. Glycated hemoglobin (HbA1c), serum glucose, total cholesterol, triglycerides, high-density lipoprotein (HDL) and low-density lipoprotein cholesterol (LDL), blood urea nitrogen (BUN), creatinine, fibrinogen, hemoglobin, and the ESR were determined using enzymatic methods with an automated chemistry analyzer (Hitachi 7600–120, Tokyo, Japan). The urine ACR was determined centrally from the first voided morning urine specimen in all subjects. Estimated GFR was calculated using the MDRD formula as described above.
Measurement techniques for hemorheologic parameters
The erythrocyte deformability and aggregation were measured by using a microfluidic hemorheometer (RheoScan-AnD300; RheoMeditech, Seoul). For deformability measurements, 60μL of whole blood was mixed with a solution of 0.14mM polyvinypyrrolidone (molecular mass, 360,000; Sigma, St. Louis, MO) at the optimal hematocrit of 0.5. The differential pressure drove the erythrocyte suspension through the microchannel (0.2 · 4 · 40mm) of the disposable kit, and the waste was collected in a waste chamber. A laser beam (wavelength, 635 nm) from a 1.5-mW laser diode passed through the diluted erythrocyte suspension during the flow. The diffraction pattern of the moving erythrocytes at plural shear stresses was projected onto a screen, and the images were captured by a charge-coupled device video camera every 0.5 s. The images were analyzed using an ellipse-fitting computer program [14]. The elongation index of the erythrocytes was defined as (L – W)/(L + W), where L and W are the major and minor axes of the ellipse, respectively. Also, the elongation index in RBCs exposed to moderate shear stress at 3 Pa (EI) was used to assess deformability [9, 16]. The full analysis took 100 s. Critical shear stress (CSS) was measured using native whole blood without adjusting for hematocrit. CSS was defined as the minimum shear stress required to disperse RBC aggregates. For the CSS measurement, a transient microfluidic technique was adopted with optical detection. When 500μL of whole blood sample stored in a reservoir chamber was driven by a pressure differential through a narrow microchannel (model K-01;RheoMeditech), the pressure differential exponentially decreased with time, and the flow ceased asymptotically. During the process, the time-varying backscattered light intensity and pressure data were recorded in a computer data file and analyzed within 50 s. When the backscattered light yielded a maximum, the corresponding time and shear stress were determined as critical time and CSS, respectively. Further details of this technique are provided elsewhere [13, 17].
Statistical analysis
The baseline characteristics were expressed as mean±standard deviation (SD) values for continuous variables. Intergroup comparisons were performed using one-way analysis of variance. Multiple linear regression analysis was performed to assess the influence of hemorheologic parameters on urinary ACR after adjustment for confounding factors. The area under the curve (AUC) of the receiver operating characteristic (ROC) curve was calculated to evaluate the diagnostic power of hemorheologic parameters to predict microalbuminuria and CKD. All statistical analysis was performed using IBM SPSS version 23 software (SPSS Inc., Chicago, IL, USA). P values less than 0.05 were considered statistically significant.
Results
Baseline characteristics
The study population was divided into three groups according to urinary ACR. There were significant differences among the groups in terms of age, BMI, systolic and diastolic blood pressure, HbA1c, BUN, Creatinine, ESR, total cholesterol, HDL cholesterol, LDL cholesterol, fasting plasma glucose (Table 1). BUN and creatinine showed a gradual increase with the worsening of GFR according to increase of urinary ACR.
Baseline characteristics of study population according to urinary albumin to creatinine ratio (ACR)
Baseline characteristics of study population according to urinary albumin to creatinine ratio (ACR)
The P value represents the analysis of variance P for the baseline measures among the groups. Data are presented as the mean (standard deviation). ap < 0.05 between albumin/creatinine ratio (ACR) < 30 mg/g creatinine and ACR > 300 mg/g creatinine. bp < 0.05 between ACR 30∼300 mg/g creatinine and ACR > 300 mg/g creatinine. cp < 0.05 between ACR < 30 mg/g creatinine and ACR 30∼300 mg/g creatinine. BMI, Body mass index; SBP, systolic blood pressure; DBP, diastolic blood pressure; HbA1c, glycated hemoglobin; BUN, blood urea nitrogen; GFR, glomerular filtration rate; TC, total cholesterol; HDL-C, high-density lipoprotein cholesterol; LDL-C, low-density lipoprotein cholesterol; FPG, fasting plasma glucose.
Table 2 shows the hemorheologic parameters of study population according to urinary ACR. Fibrinogen, ESR, CSS show significant differences among the groups. These parameters showed a gradual increase with the worsening of urinary ACR. There was a significant difference in fibrinogen and CSS between normoalbumuric group and macroalbuminuric group. However, there were no statistical significance between microalbuminuric and macroalbuminuric group. ESR showed a significant difference in all three groups respectively while EI did not show any significant difference.
Hemorheologic parameters of study population according to urinary albumin to creatinine ratio (ACR)
Hemorheologic parameters of study population according to urinary albumin to creatinine ratio (ACR)
The P value represents the analysis of variance P for the baseline measures among the groups. Data are presented as the mean (standard deviation). ap < 0.05 between albumin/creatinine ratio (ACR) < 30 mg/g creatinine and ACR > 300 mg/g creatinine. bp < 0.05 between ACR 30∼300 mg/g creatinine and ACR > 300 mg/g creatinine. cp < 0.05 between ACR < 30 mg/g creatinine and ACR 30∼300 mg/g creatinine. ESR, erythrocyte sedimentation rate; EI, elongation index at 3 Pa; CSS, critical share stress.
Combined hemorheologic parameters of Fibrinogen/ CSS, CSS/ EI, Fibrinogen/ EI, ESR/ EI, and (Fibrinogen×ESR)/ EI demonstrated significant differences among different groups of ACR. These parameters showed a gradual increase along with the increment in urinary ACR. In particular, (Fibrinogen×ESR)/ EI showed a significant difference in all three groups respectively. In multiple linear regression analysis, (Fibrinogen×ESR)/ EI was an independent predictor of urinary ACR in a model adjusted with age, hematocrit, BMI, HbA1c (ß= 0.010, P < 0.001) (Table 3).
Multiple linear regression analysis for urinary albumin to creatinine ratio (ACR)
B, unstandardized regression coefficient; ß, standardized ß; Hct, hematocrit; BMI, body mass index; ESR, erythrocyte sedimentation rate; EI, elongation index at 3 Pa.
Alterations of hemorheologic parameters also have been analyzed in groups according to CKD stage using GFR. Fibrinogen, ESR, CSS also showed significant association with deterioration of GFR. (Fibrinogen×ESR)/ EI showed significant difference between no or minimal CKD stage (non CKD, CKD 1), moderate CKD stages (CKD 1, CKD 2 and 3) and severe CKD stages (CKD 4, 5). ESR/ EI at 3 Pa showed similar pattern of significance with CKD stages. Fibrinogen/ EI showed significant difference between mild to moderate CKD (non CKD, CKD 1, 2, 3) and moderate to severe CKD group (CKD 1,2, 3 and 4, 5). Other hemorheologic parameters showed non-significant differences or weak correlations between groups of CKD (Table 4).
Hemorheologic parameters of study population according to chronic kidney disease (CKD) stages
Hemorheologic parameters of study population according to chronic kidney disease (CKD) stages
The P value represents the analysis of variance P for the baseline measures among the groups. Data are presented as the mean (standard deviation). ap < 0.05 between non CKD and CKD 1. bp < 0.05 between non CKD and CKD 2. cp < 0.05 between non CKD and CKD 3. dp < 0.05 between non CKD and CKD 4,5. ep < 0.05 between CKD 1 and CKD 4,5. fp < 0.05 between CKD 2 and CKD 4,5. gp < 0.05 between CKD 3 and CKD 4,5. CKD, chronic kidney disease; ESR, erythrocyte sedimentation rate; EI, elongation index at 3 Pa; CSS, critical share stress.
Figure 1 showed the ROC curve to predict microalbuminuria (ACR≥30 mg/g creatinine) with selected hemorheologic parameters. Value of AUC (95% Confidence intervals) were 0.717 (0.658–0.776) for Fibrinogen/ EI, 0.757 (0.698–0.815) for ESR/ EI and 0.762 (0.704–0.820) for (Fibrinogen×ESR)/ EI, respectively. When 12770 of (Fibrinogen×ESR)/ EI has been set as a cut off point for presence of microalbuminuria, it showed the sensitivity of 74.5% and specificity of 63.1% to diagnosis early DN.
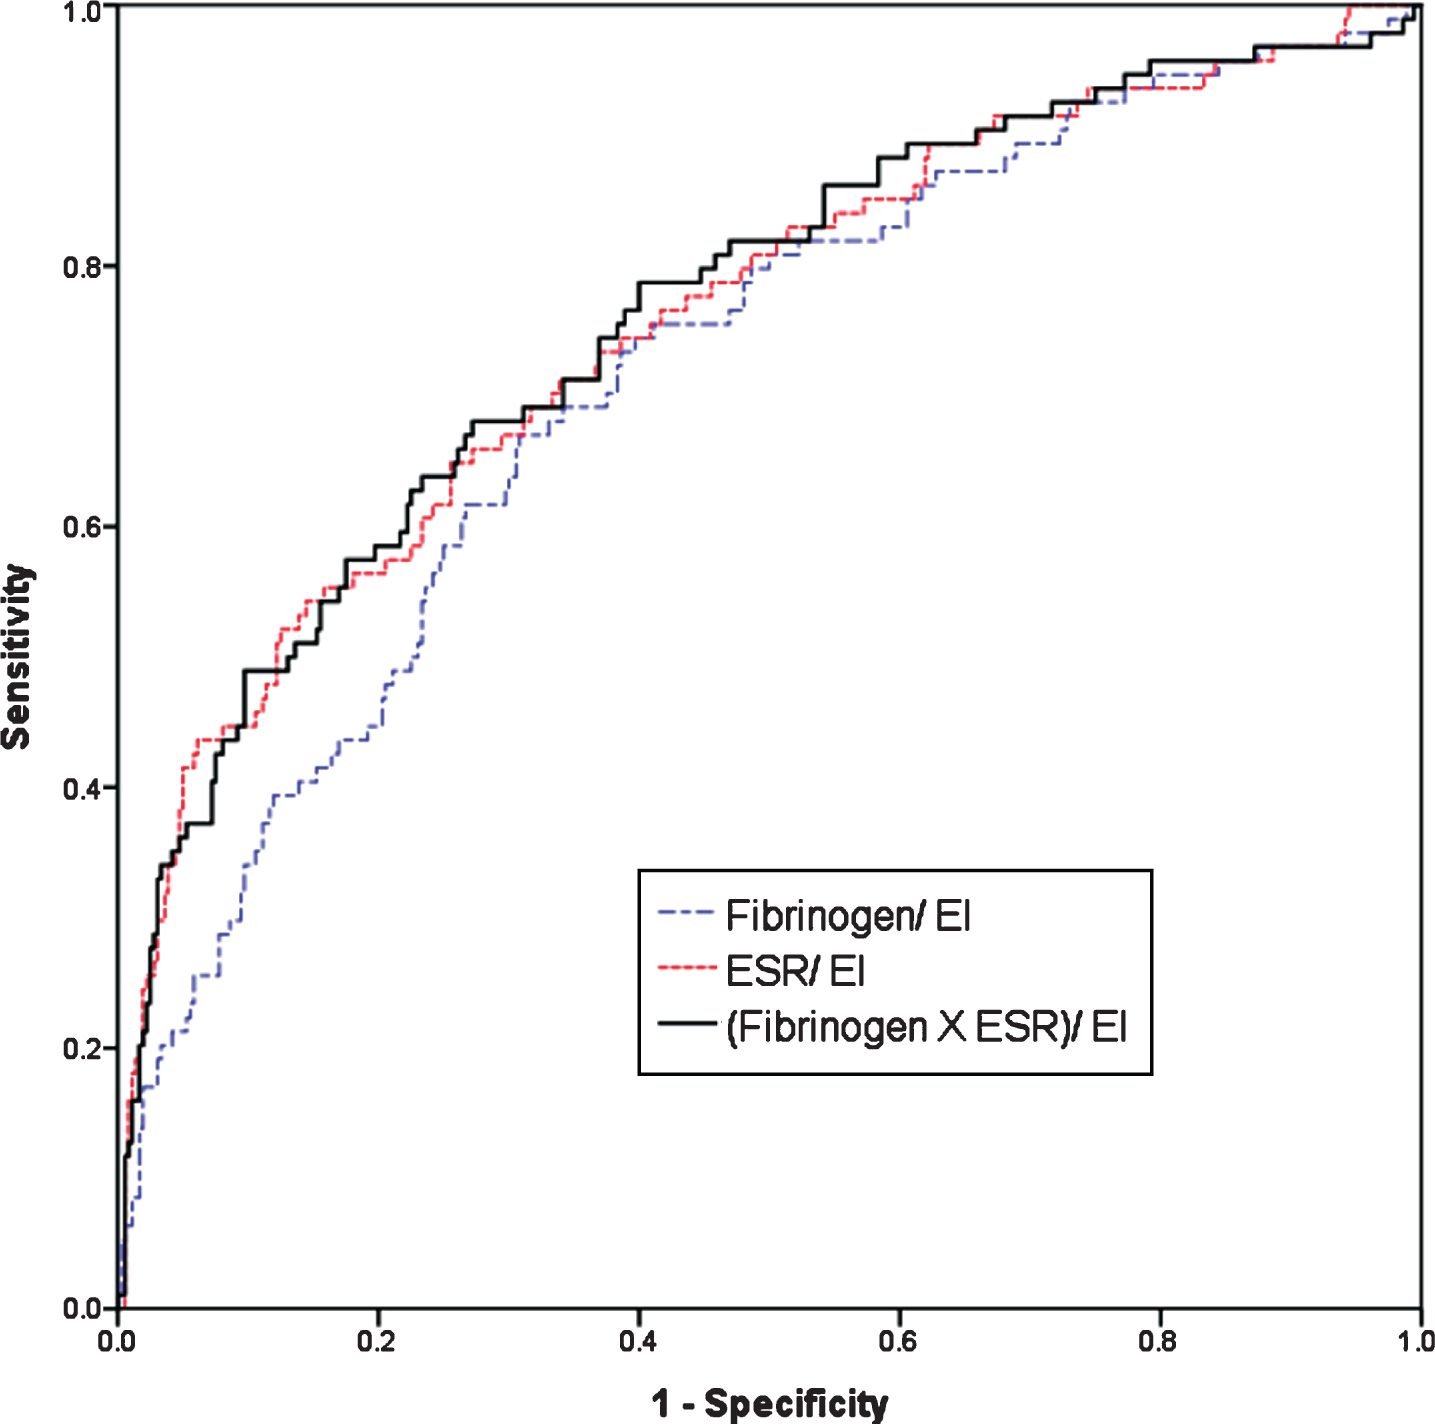
Receiver operating characteristic curve between some hemorheologic parameters and presence of microalbmuminuria.
In this study, we demonstrated that some hemorheologic parameters showed differences according to the severity of DN evaluated by urinary ACR and GFR. Among the hemorheologic parameters, (Fibrinogen×ESR)/ EI showed significant differences in both groups of urinary ACR and GFR. This parameter also showed diagnostic power to predict microalbuminruia and mild CKD. To our best knowledge, this is the first study to suggest hemorheologic parameter as a novel surrogate marker to predict DN.
There were some previous studies that evaluated the association between hemorheologic changes and diabetic complications, but they had limitations. Brown et al. reported that progressive impairment in RBC deformability is associated with renal function loss in patients with or without diabetes [10]. But this study was conducted only with a 57 subjects. Moon et al. reported that lower value of EI was closely associated with risk of diabetic retinopathy [11]. Park et al. also reported that diabetic patient with acute myocardial infarction (AMI) showed lower EI than patient without AMI [12]. However, in these two studies, authors did not consider additional hemorheologic parameters such as fibrinogen or ESR in the analysis. Also, a previous study have suggested Fibrinogen/ EI as an early marker of DN, but very limited numbers of subjects with mild to moderate degree of DN were included [13].
Elongation index is a marker of erythrocyte deformability associated with increased blood viscosity in patients with diabetes mellitus [10]. Glycation of RBC membrane glycoprotein and hemoglobin is a main cause of hemorheologic alteration which stiffens the RBC membranes. Stiffened membranes reduce RBC deformability and potentially resulting in the initiation of DN [7]. In this study, EI alone did not show a significant difference according to a degree of DN. However, Fibrinogen/ EI which is an elongation index value adjusted with fibrinogen showed a strong correlation with progression of DN. Furthermore, (Fibrinogen×ESR)/ EI showed the highest sensitivity and specificity in predicting DN among various hemorheologic markers.
Fibrinogen is a glycoprotein synthesized in liver has association with erythrocyte aggregation and deformability in metabolic, inflammatory diseases [18]. In patients with diabetes mellitus, in addition to RBC deformability due to glycation of hemoglobin and increased oxidative stress, hyperinsulinemia enhances the fibrinogen production. These changes could lead to an increase in RBC aggregation and aggravation of RBC deformability [19]. Meanwhile, ESR, which is widely used as a nonspecific indicator of inflammation, also has been known to associate with RBC aggregation in patient with diabetes [20, 21]. Thus, we have included all these parameters and made a novel index, (Fibrinogen×ESR)/ EI, which could reflect both RBC deformability and aggregation simultaneously. Fibrinogen represents as a marker of aggregation, and EI as a marker of deformability. ESR which could represent and calibrate status of inflammation. As a result, this novel marker showed enhanced diagnostic power to assess DN. In Pearson’s correlation analysis, (Fibrinogen×ESR)/ EI showed a significant relationship with urinary ACR (r = 0.382 and P < 0.01, data not shown). This relationship remained significant after adjusting for other metabolic and hemoreologic parameters.
The development of DN is multifactorial. Well-known major pathogenic components including renal fibrosis, glomerular hypertrophy, oxidative stress and tubular inflammation were also a target of novel biomarkers to predict DN [22]. Urinary transferrin, tumor necrosis factor α, type IV collagen were markers of glomerular injury and known to possible predictors of microalbuminuria in type 2 diabetes mellitus. Urinary N-acetyl-ß-D-glycosaminidase was also known as a novel biomarkers of DN in type 2 diabetes mellitus [23]. Although these biomarkers are potentially useful, it is not easy to use them in clinical settings and more subsequent studies are needed to validate them.
It generally accepted that microalbuminuria is strongly associated with DN [5, 25]. However, urinary ACR is influenced by various factors including patient’s general conditions, comorbidities, medications, and improper urinary sampling [26]. In this study, (Fibrinogen×ESR)/ EI showed a moderate power as a diagnostic marker of microalbuminuria as well as early CKD. Hemorheologic study can be simultaneously done with a routine blood sampling, (Fibrinogen×ESR)/ EI could be readily acquired within minutes with less than 0.5mL of blood. Thus, it would be a convenient method to assess DN in children or old, debilitated patients whose proper urine collection is difficult and also it can be used as a complementary tool for detection of DN in patients whose ACR may be unreliable.
Study participants included prediabetic subjects. Since majority of prediabetic subjects were normoalbuminuric, subgroup analysis only with prediabetic subjects did not showed a statistical significance. However, (Fibrinogen×ESR)/ EI showed best diagnostic value in ROC curve to predict microalbuminuria in predibetic subjects. Value of AUC (95% Confidence intervals) were 0.636 (0.473–0.800) for (Fibrinogen×ESR)/ EI, 0.623 (0.459–0.788) for ESR/ EI and 0.624 (0.503–0.744) for Fibrinogen/ EI, respectively (data not shown). Hemorheologic changes occur in very early stage of DN without albuminuria [18]. It is also known that prediabetic status was also independently associated with diabetic complication including DN [27]. Thus, our hemorheologic marker could help to evaluate DN not only overt diabetes but also prediabetes and early stage of DN. Furthermore, we are following-up on these patients in this study to see if those with increased (Fibrinogen×ESR)/ EI but without diabetic nephropathy at time of the study are more prone to develop DN later on. Following study could enhance the clinical value of our hemorheologic parameter.
Our study had some limitations. First, this was a cross-sectional study. Thus, we could not explain the causal relationship only by the result of this study. Second, all study population consisted of Korean men and women recruited at a single institution. So there are some limitations regarding the ability to generalize our results. Third, we were unable to obtain histories of smoking, and exercise which can affect RBC deformability. Lastly, the study was conducted on adults with Type 2 diabetes only. Children, especially those with Type 1 diabetes, might benefit from this method, and further study with different population is warranted.
Conclusion
We demonstrated that (Fibrinogen×ESR)/ EI correlates well with urinary ACR and GFR, and that it had a predictive value for the presence of DN with a relatively high sensitivity and specificity. Hemorheologic assessment which can be done at point-of-care system with a small amount of blood, would be a convenient method to assess DN especially in children or old, debilitated patients whose proper urine collection is difficult and also it can be used as a complementary tool for detection of DN in patients whose ACR may be unreliable.
Footnotes
Acknowledgments
None.