



Abstract
PURPOSE:
To explore the peripapillary capillary density distribution and its correlation with nerve fibre layer in superficial and deep retinal layers of healthy Chinese.
METHODS:
Images of superficial and deep retinal capillary networks were obtained by optical coherence tomography angiography (OCTA) using a CIRRUS TM HD-OCT Model 5000 system and analyzed by Image-Pro Plus (Medical Cybernetics, Version 6.0). Peripapillary capillary density was defined as the mean optical density of the annular region between two concentric circles of 3.085 mm and 3.835 mm diameter. Parafoveal capillary density was defined as the mean optical density between the foveal avascular zone (FAZ) boarder and a 2.5 mm diameter circle. Retinal nerve fibre layer (RNFL) thickness was also measured and the correlation with capillary density determined.
RESULTS:
Mean peripapillary capillary density was 4.16±1.06 in the superficial and 2.92±0.80 in the deep layer. Corresponding mean parafoveal densities were 2.65±0.55 and 2.51±0.55. Capillary densities were higher in the superficial layer of all quadrants for both peripapillary and parafoveal regions (P < 0.001). A significant correlation between peripapillary capillary density and RNFL thickness was found in the superficial layer (r = 0.305, P < 0.05). A negative correlation between age and capillary density was found in both peripapillary and parafoveal regions (P < 0.001).
CONCLUSIONS:
Peripapillary capillary density in the superficial layer highly correlated with RNFL thickness. Regional and age-related differences in peripapillary and parafoveal capillary density should be considered when diagnosing and monitoring individuals with diseases affecting retinal capillary density.
Keywords
Introduction
The retinal vascular system plays a very crucial role in its normal function maintain [1–5]. Retinal vascular morbidity, such as retinal vessel occlusion, diabetic retinopathy, or inflammation will cause retinal dysfunction and lead to severe visual acuity impairment [6–10]. Many techniques have been used to measure vessel blood flow, such as confocal scanning laser microscopy [11], fundus fluorescein angiography (FFA) [12] and indocyanine green angiography (ICGA) [13]. However, these methods are invasive, cannot reveal capillary flow rates, and are usually obscured by dye leakage in morbid cases. Furthermore, due to the two-dimensionality of the fundus photographic technique, conventional FFA and ICGA are unable to reveal differences among retinal layers. In contrast, optical coherence tomography angiography (OCTA) is a new noninvasive imaging technique that uses flow-based information to visualize the retinal and optic disc circulation in separate layers. Quantification of capillary density by OCTA may be of substantial diagnostic value to ophthalmologists.
Currently, AngioVue (Optovue, Inc., Fremont, CA, USA) is the most frequently used software tool for quantification of vascular density. Vascular density is defined as the percentage area occupied by blood vessels, with the blood vessels being defined as pixels having values above a specific threshold level [14]. The mean brightness of the central foveal avascular zone (FAZ) is measured, and this brightness value is used as the threshold, with any brightness value larger than the threshold indicative of a vessel. For the choriocapillaris, a lower brightness threshold is used to mitigate artifacts caused by larger vessels with higher brightness [15]. Using these methods, differences in quadrant capillary density distribution were found across the papillary but not the parafoveal region [16–19].
In the present study, we developed a new method for grading OCTA images and used it to explore the capillary density across peripapillary and parafoveal regions in both superficial and deep retinal layers. The goals of this study were threefold: (1) to evaluate the reproducibility of a new method for grading the capillary vascular distribution density; (2) to assess differences in peripapillary and parafoveal capillary distribution densities by quadrant and by retinal layer; (3) to explore the correlation between capillary density and RNFL and between capillary density and age.
Methods
Study population
Ethics approval was obtained from the Zhongshan Ophthalmic Center Ethics Review Board (Approval number: 2018KYPJ130). The study was conducted in accordance with the tenets of the World Medical Association’s Declaration of Helsinki. Written informed consent was obtained from all participants.
Inclusion criteria were no ocular problems other than mild refractive error, age between 18 and 70 years, visual acuity of 20/25 or better according to routine ocular examination, and spherical equivalent range from –3.0 to 1.0 diopters (D). Subjects with a history of diabetes, hypertension, taking regulary vascular-related drugs, or other vascular pathologies, refractive error beyond the specified limits, pathologic ocular conditions including glaucoma, inflammatory conditions, history of ocular trauma, and prior ocular surgery were excluded from the study.
Optical coherence tomography angiography image acquisition and processing
All subjects underwent OCTA using an AngioPlex OCTA system (Zeiss, Inc., Dublin, CA, USA) run by a single operator. The device has a high acquisition speed of 70,000 A-scans per second. The scan area was 6×6 mm for all subjects. Analyses were performed on OCTA images generated from the superficial and deep retinal vascular plexuses.
All images were graded by a single examiner (X.D.). Poor-quality images were identified and excluded based on the following criteria: (1) evidence of poor fixation, including double vessel pattern and motion artifacts, (2) presence of blink artifacts with a width of more than 5 pixels, (3) media opacity, marked by shadowing or obscuration of vessel signal in the field of view or a signal strength index less than 50, or (4) segmentation error in outlining vascular networks. The first 30 images from 30 subjects was used in the. The first 30 images from 30 eyes analyzed on two consecutive days were used for the intra-observer reproducibility study.
Imaging analysis procedure
Image analysis was performed using Image-Pro Plus (Media Cybernetics Inc., MD, USA). We used the 6×6 mm scan mode in our study, so raw images covered an area of 6×6 mm retinal region. We used this scale to standardize the magnification of each image. Then, two concentric circles of 3.085 mm and 3.835 mm diameter were placed on the image around the papillary area forming an annulus. A 2.5 mm diameter circle was placed around the fovea, [20] the inner border was defined as the outer limit of the FAZ. Capillaries were defined according to the Horton-Strahler scheme, [21] optical density in regions of large and small retinal vessels were dropped. The capillary density was calculated by the formula: capillary density = mean optic density in the region of interest / mean optic density in the 100-μm diameter foveal center. The schema for quadrant splitting of the macular and papillary areas is shown in Fig. 1.
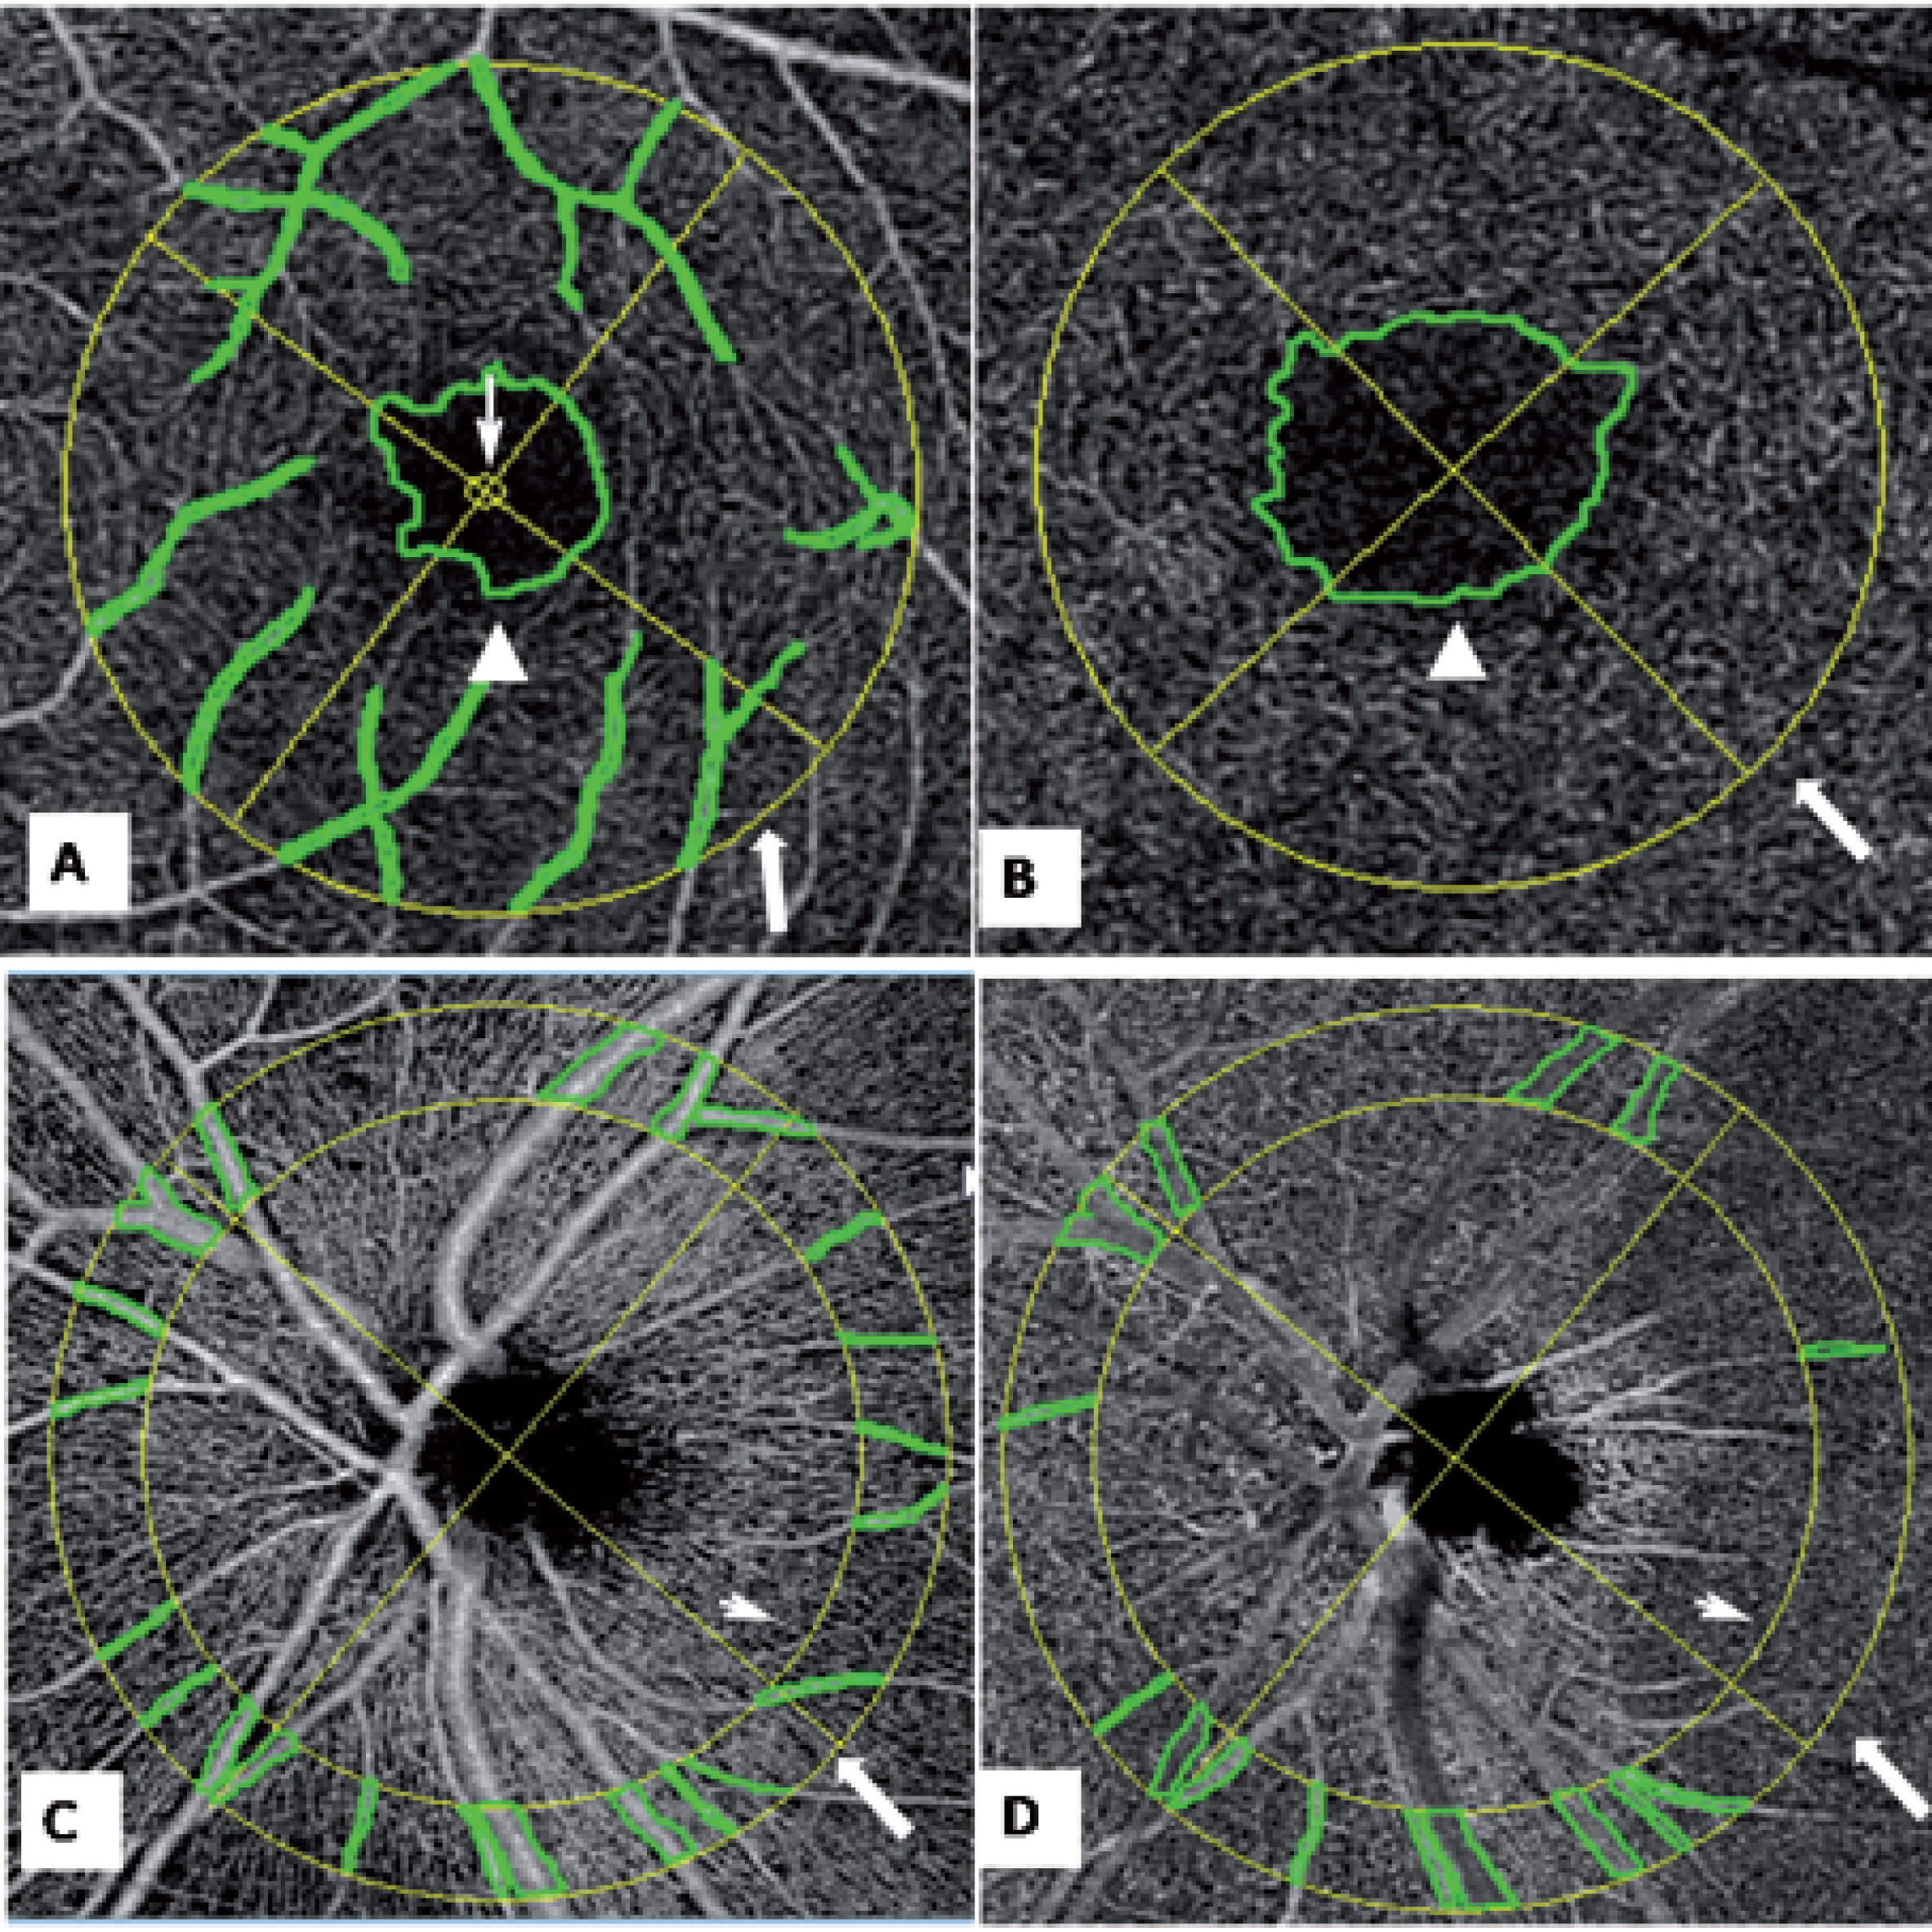
The schema for selection of the peripapillary and parafoveal region of interest. (A, B) The superficial (A) and deep layer (B) in the peripapillary region. Marked are the central 100 μm (narrow arrow), border of the foveal avascular zone (white triangle), outer border with diameter 2.5 mm (wider arrow). (C,D) Superficial (C) and deep layers (D) of the parafoveal region, Marked are the inner border with diameter of 3.085 mm (narrow arrow) and outer border with diameter 3.835 mm (wider narrow).
Numerical data were tested for normality using the Shapiro-Wilk test. Normally distributed variables are expressed as mean±standard deviation (SD). The paired t-test was used to compare results between repeat sessions. The 95% limits of agreement (LoA) (mean difference between two repeated measurements±1.96 SD) were calculated to evaluate repeatability (narrower LoA range indicating better agreement). Consistency of repeated measures was further illustrated by Bland-Altman plots. All data analyses were performed using Stata software (release 12.0, Stata Statistical Software). P < 0.05 was considered statistically significant.
Results
Reproducibility of our new method
Thirty images from thirty subjects were selected for the intra-observer reproducibility analysis (Table 1). The ICC between the two sessions ranged from 0.85 to 0.95, and the mean difference in corresponding measures between the two sessions ranged from 0.00 to 0.06. Bland-Altman plots for the two sessions are shown in Figs. 2 and 3.
Intra-observer reproducibility of retinal capillary density measures using our new method
Intra-observer reproducibility of retinal capillary density measures using our new method
ICC: Intra-class correlation coefficient. 95% LoA: 95% Limit of agreement.
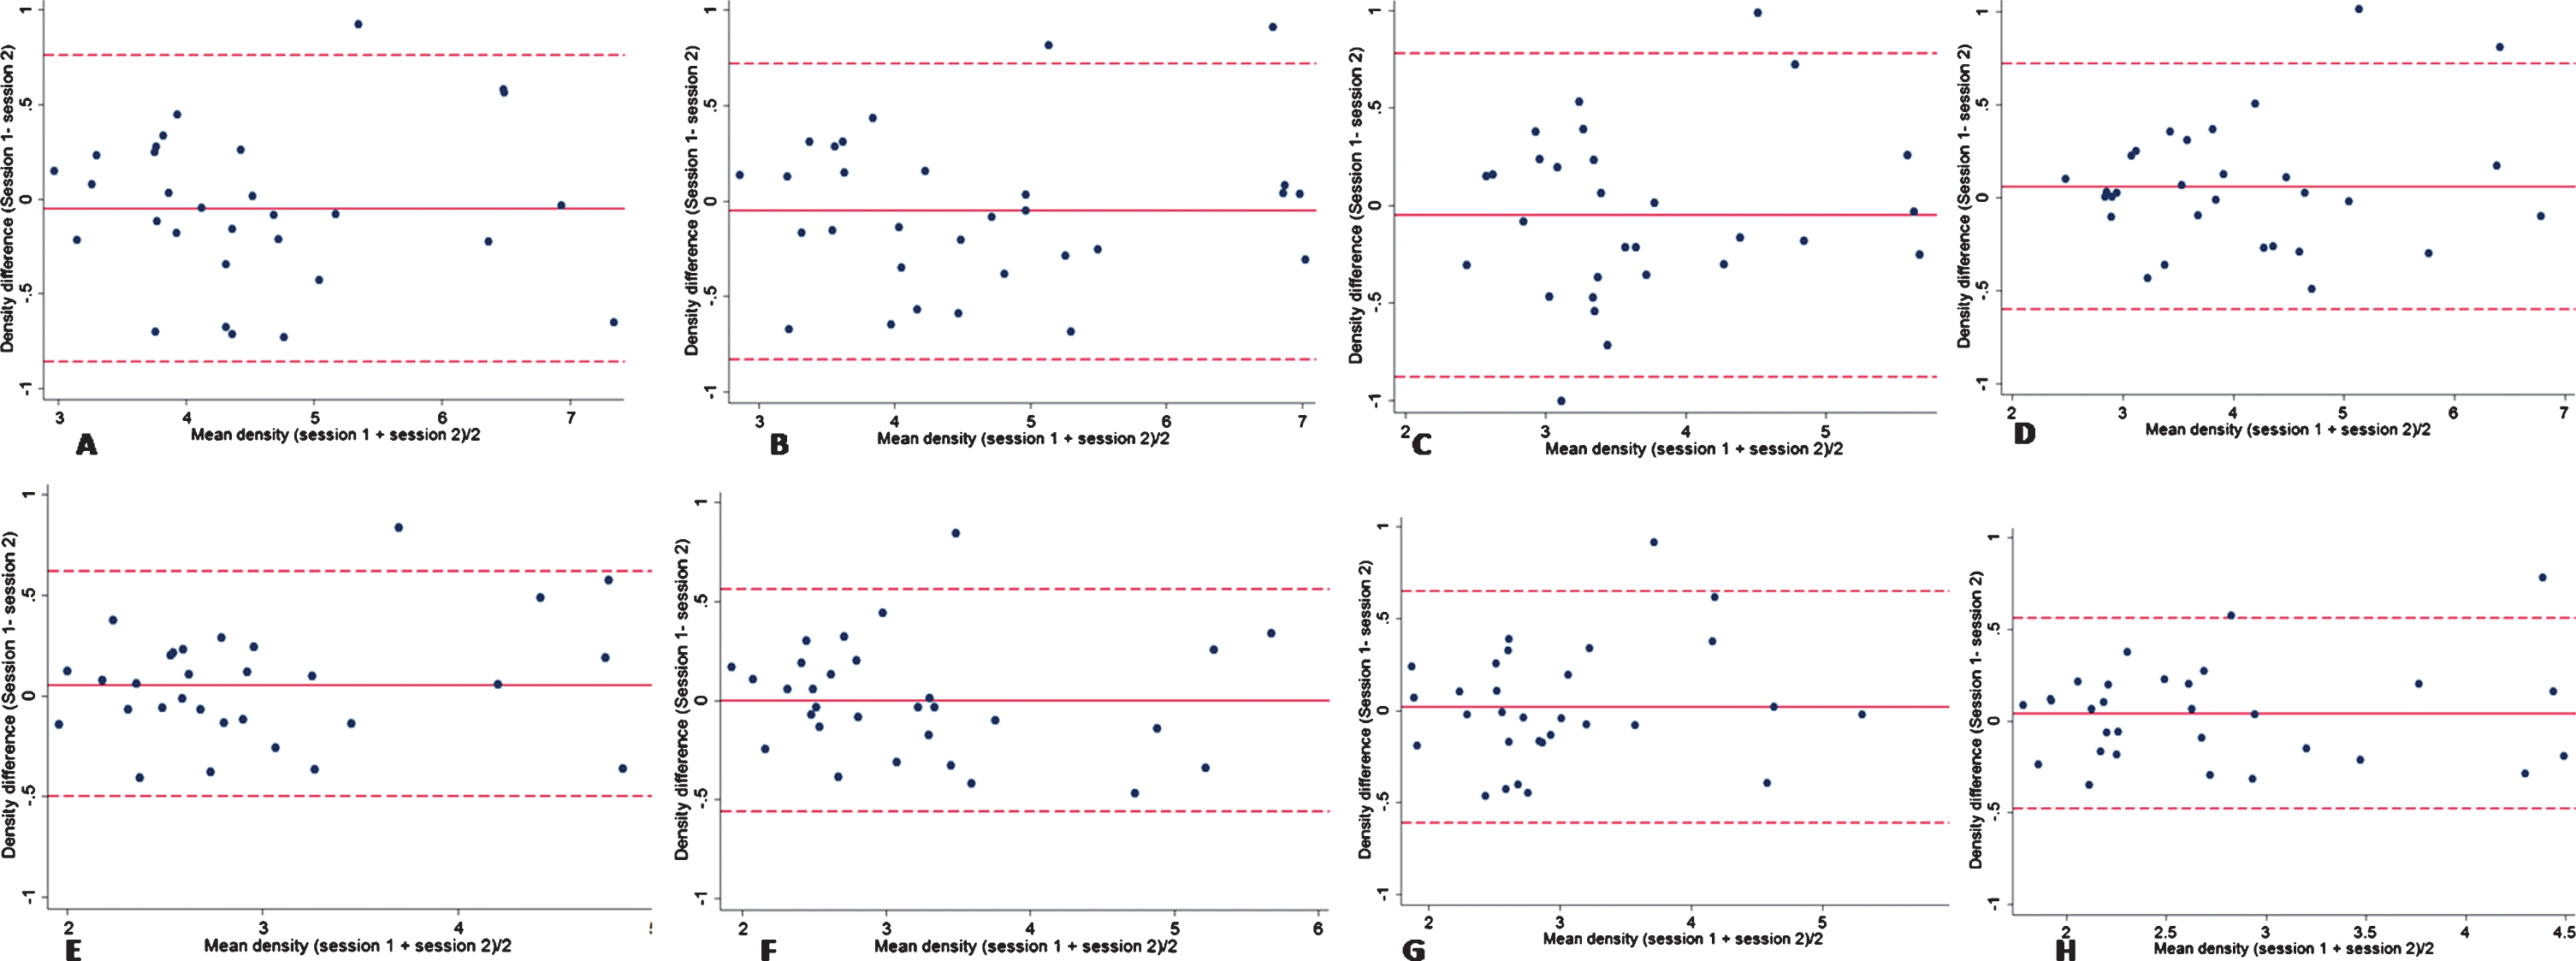
Bland-Altman plots of capillary density in superficial and deep layer for the four quadrants around the papilla. (A)-(D) The superior (A), inferior (B), nasal (C) and temporal (D) quadrant in the superficial layer around the papilla. (E)-(H) The superior (E), inferior (F), nasal (G), and temporal (H) quadrant of the deep layer around the papilla.
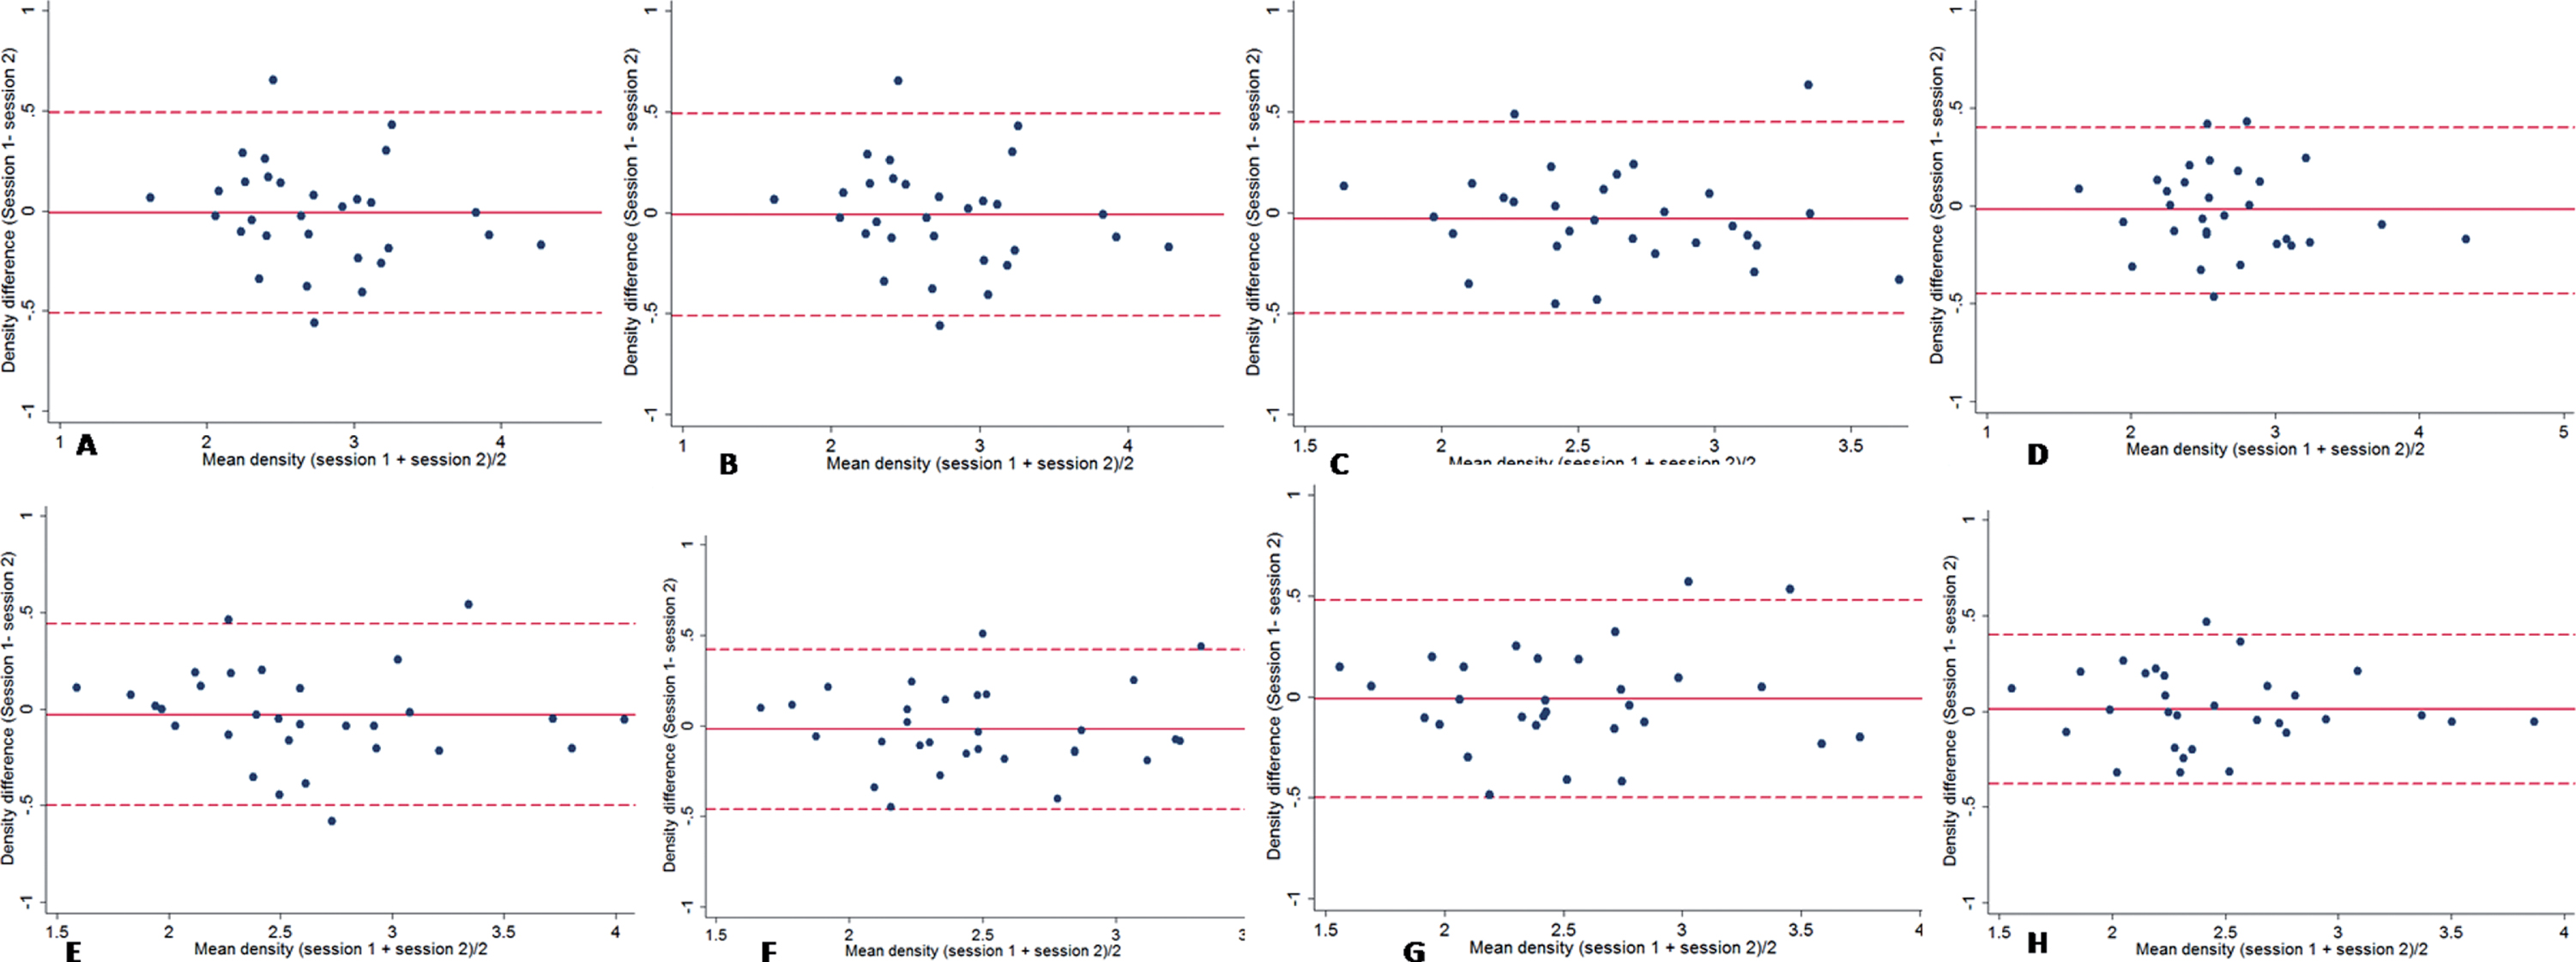
Bland-Altman plots of capillary density in the superficial and deep layers of the four quadrants around the macula. (A)-(D) The superior (A), inferior (B), nasal (C), and temporal (D) quadrant of the superficial layer around the macula. (E)-(H) Superior (E), inferior (F), nasal (G), and temporal (H) quadrant of the deep layer around the macula.
A total of 63 eyes (63 subjects) were enrolled in the distribution analysis (mean subject age: 44.5±13.2 years; 51% male). The capillary density distributions of peripapillary and parafoveal areas are shown in Fig. 4. The overall peripapillary capillary density was 4.16±1.06 in the superficial and 2.92±0.80 in the deep layer. Corresponding parafoveal values were 2.65±0.55 and 2.51±0.55. The capillary density in the superficial layer was higher than the deep layer in all four quadrants, both in peripapillary and parafoveal areas (all P < 0.05).
Correlation between superficial peripapilllary capillary density and RNFL thickness
There was a significant correlation between the superficial peripapillary capillary density and RNFL thickness (ICC = 0.305, P < 0.05, Fig. 4). Furthermore, a similar distribution pattern was found, with vertical quadrant (nasal/temporal) density higher than the horizontal (superior/inferior) quadrant density in the superficial layer (Fig. 5).

Scatter plots of retinal nerve fibre layer thickness against capillary density in the superficial retinal.

Distribution of peripapillary and parafoveal capillary density and retinal nerve fibre layer in the four quadrants.
Table 2 shows the change in capillary density with increasing age. A negative correlation between age and capillary density was found in the superficial and deep layers in both the peripapillary and parafoveal areas. No significant trend was found between RNFL thickness and age.
Changes in general capillary density with age
Changes in general capillary density with age
The image captured by OCTA is a white-on-black background picture. According to the image-forming principle of OCTA, higher optical density indicates a stronger blood signal and thus high capillary density. We used raw images to grade the optic density, which is simple and explicit, with a short learning curve. In the reproducibility study, the measured differences clustered around 0 with no obvious tend as illustrated by Bland-Altman plots. Therefore, this method is reproducible and can be applied in clinical and scientific research.
The optical density captured by OCTA may be influenced by the optic media, refractive error, and imaging quality. To adjust for these influences, all values were normalized to the mean optical density value in a circle of diameter 100 μm around the foveal avascular zone (FAZ). The ratio of optical density in the region of interest (ROI) to that in the reference area was used as an index of ROI vascular signal. In previous studies, FAZ was chosen as the reference. However, we chose the circle of diameter 100 μm as we found it was more stable and comparable among subjects.
In this study, we focused on peripapillary and parafoveal optical densities as they are valuable for early diagnosis and monitoring of treatment efficacy. Sharma et al 19 reported that the peripapillary blood density in acute stage non-arteritic anterior ischemic optic neuropathy (NAION) was significantly lower than in a control group, while no significant difference was found after 7 days’ treatment between groups. Moreover, the optical density was also considerably elevated in patients with alleviated optic disc edema. Based on these findings, they concluded that blood density could be utilized to monitor the severity of ischemic optic neuropathy. Wang et al 20 found that after an attack of acute primary angle-closure glaucoma, peripapillary retinal vessel density was lower in the affected eye than the fellow eye, even though RNFL and ganglion cell thickness were similar. Yarmohammadi et al 21 found the microvascular density and perfusion were lower in confirmed or suspected primary open-angle glaucoma than healthy eyes. Therefore, optic disc-related diseases may be associated with early changes in the distribution of peripapillary microperfusion. Teng et al 22 found that the blood area and parafoveal choroidal vessel density were significantly lower in eyes with macular hole than fellow healthy eyes. Further, the blood density of choroidal capillary vessels was negatively correlated with FAZ area and was significantly elevated after successful macular hole surgery.
The OCTA image shows capillary density is greater in the superficial retinal layer than the deep layer. In contrast, Wang et al. [15] and Shahlaee et al. [14] found that capillary density was lower in the superficial layer in both macular and papillary areas, while in another report, Wang et al. [22] found higher mean foveal vascular density in the superficial than the deep layer (28.5% vs. 25.3%). To explain this deliemma, results from histological studies should be a golden standard. In a histological study by Tan, [23] they used perfusion-based histological labelling techniques to quantify the capillary density in donor eyes and found higher capillary density in the RNFL and retinal ganglion cell (RGC) layer (13.6% and 26.7%, respectively) than in the inner layer (11.3% and 16.1% in the superficial and deep inner nuclear layers, respectively), and a subsequent study combining speckle variance OCT and histology supported this conclusion [24].
For peripapillary region analysis, we selected concentric circles with inner and outer diameters of 3.085 mm and 3.835 mm around the papillary region (i.e., a width of 0.75 mm) because the RNFL measured a ring around the papillary at 3.46 mm [25]. This value could be used for analysis of the correlation between RNFL thickness and capillary density. We found the capillary density in the vertical direction was much higher than in the horizontal direction, similar to the distribution found in the RNFL [26]. The proportional relationship between RNFL thickness and capillary density closely resembled that between RNFL thickness and hyperreflective bundle width (that is, the nerve fiber bundle width as observed by adaptive optics scanning laser ophthalmoscopy). Takayama et al. [27] reported that the distribution of nerve fiber bundle widths around the disc had a double peak, as did that of RNFL thickness as evaluated by a circle scan around the optic disc on OCT images, and RNFL thickness was positively correlated with nerve fiber bundle width. Considered together with the current result that higher peripapillary capillary density predicts greater RNFL thickness, radial peripapillary capillaries (RPCs) may be the capillary network primarily responsible for RNFL nourishment.
In the present study, we found that capillary density decreased dramatically with age in both peripapillary and parafoveal regions. This may explained by narrowing of the central and branch retinal artery with age, leading to reduced perfusion pressure and lower flow rate. No significant trend was found in the cutaneous microvasculature [28]. These findings are consistent with previous studies [15, 22].
In conclusion, this study describes a novel method for quantification of capillary density in superficial and deep retinal vascular plexuses of healthy eyes. These regional and age-related differences in peripapillary and parafoveal capillary density will be useful for diagnoses and monitoring of individuals with diseases that affect capillary density.
Funding
Supported by Science and Technology Program of Guangzhou (201607010070) and National Natural Science Foundation of Guangdong (2016A030313364).
Conflict of interest
The authors have no financial or other conflicts of interest concerning this study.