
Abstract
Hematocrit increases during exercise and is usually decreased after regular training. However the interpretation of these facts is ambiguous since hematocrit is both a determinant of oxygen supply and the major determinant of blood viscosity. Classically hematocrit was assumed to impair blood flow, but it has been evidenced to exert a biphasic effect on it. In order to cope with these two apparently opposite effects of hematocrit, hemorheologists have proposed the concept hematocrit/viscosity ratio (h/η). This h/η ratio is related to tissue oxygenation in vascular diseases (eg, POAD) but not in healthy subjects. h/η displays a bell-shaped curve as a function of hematocrit and the hematocrit value corresponding to the maximal h/η can be assumed to be a theoretically optimal hematocrit. We propose to analyse exercise-related alterations in hematocrit according to this theoretical approach, viscosity at high shear rate being reconstructed with Quemada’s equation from actual plasma viscosity and red cell rigidity at various hematocrit levels. While theoretical and actual h/η are fairly correlated in athletes both before and after exercise, actual hematocrit is lower at rest and higher after exercise compared to the theoretical one. The main statistic correlate of these discrepancies between actual and predicted hematocrit is red cell rigidity. Submaximal exercise acutely decreases the h/η ratio (despite increasing both hematocrit and viscosity). This change is well predicted by the model and there is a strong correlation between predicted and actual h/η ratio. Endurance training tends to increase h/η and to reduce the discrepancy between predicted and actual hematocrit. Accordingly trained athletes have a higher h/η (both model-predicted and actual) than sedentary subjects, and a lower hematocrit, this lowering being rather correlated to training volume than to fitness improvement. On the whole, this approach suggests that homeostatic “viscoregulation” in athletes results in a fine tuning of h/η which seems to be a closely regulated parameter. Hematocrit alterations in this context are an adaptation involved in this regulation.
The two faces of hematocrit
Among the various parameters studied by hemorheologists, hematocrit is by far the most widely investigated. For physicians it gives useful information about hydration status and red blood cell volume. In some cases like polycythemia vera it is excessively elevated and associated with a clinical ‘hyperviscosity syndrome’.
Therefore, hematocrit has two faces. It is a measure of the oxygen-carrying cells and thus of the capacity of oxygen transfer of blood, and is also the major determinant of blood viscosity.
This ambiguous aspect of hematocrit (that is both beneficial and deleterious for oxygen supply to tissues) has been wonderfully depicted by John Dormandy in his Fåhraeus lecture 1983 titled ‘The dangerous red cell’ [13]. After summing up all the body of literature that demonstrates increased cardiovascular risk linked to excess erythrocythemia, this author proposed a challenging hypothesis: “Do humans have too much red cells?” He suggested that our prehistoric ancestors had excess red cells in order to cope with the risk of hemorrage. According to this hypothesis, our systemic hematocrit is slightly higher than ideal.
Is there an optimal hematocrit?
In fact the idea that there is a value of hematocrit that yields an optimal supply of oxygen to tissues despite its viscosity-increasing effect is older than Chien and Dormandy’s works [11].
The optimal hematocrit hypothesis is logic, but some studies have provided results that seem to be in disagreement with it. Experimentally induced chronic excessive erythrocytosis does not induce a decrease in O2 delivery and exercise performance as assessed with VO2max [17]. An explanation for this finding can be that there are adaptive mechanisms to excessive erythrocytosis [16]. A recent comprehensive review on this issue has been recently published by W. Reinhart [23].
Biphasic shape of the curve describing the relationship between hematocrit and blood flow
According to the classical Poiseuille model which still appears in all medical textbooks, any rise in haematocrit is likely to increase blood viscosity and thus to impair blood flow. However, this is true in rigid tubes (and thus may be relevant to atheromatous arteries which have lost most of their vasoactive properties) but in physiological conditions things are more complex. In a normal vessel whose endothelium is able to release NO in response to shear stress, the effect of an increase in hematocrit is actually biphasic. Moderate increases in hematocrit like those observed in physiology (eg, during exercise) increase blood flow due to a shear-induced NO release which in turn triggers vasodilation [31].
Interestingly, in patients at high vascular risk whose endothelial function is presumably impaired, blood viscosity is associated with a rise in blood pressure and in vascular risk. In a series of 3620 men followed over 10 years, every 1% increment in hematocrit was associated with 7% higher incidence of hypertension after adjusting for risk factors [15, 19]. Therefore, Poiseuille’s low is still correct when vessels become rigid, while it fails to describe reality when vasoreactivity is efficient.
In acute and chronic erythropoietin-treated mice, Schuler and coworkers have provided an impressive demonstration of the relevance of this concept. Clearly, exercise performance displays as a function of haematocrit a bell shaped curve that closely mirrors the previously discussed theoretical curve of h/η as a function of hematocrit [25].
Homeostatic regulation of hematocrit
The late Leopold Dintenfass (1921–1990), a pioneer of hemorheology, postulated in the middle of the XXth century that there were «viscoreceptors» that triggered an hematocrit lowering mechanism in response to an increase in blood viscosity [12].
This mechanism was further elucidated by the team of Walter Reinhardt who demonstrated that plasma viscosity was able to inhibit erythropoietin release by the kidney [27] (Fig. 1).
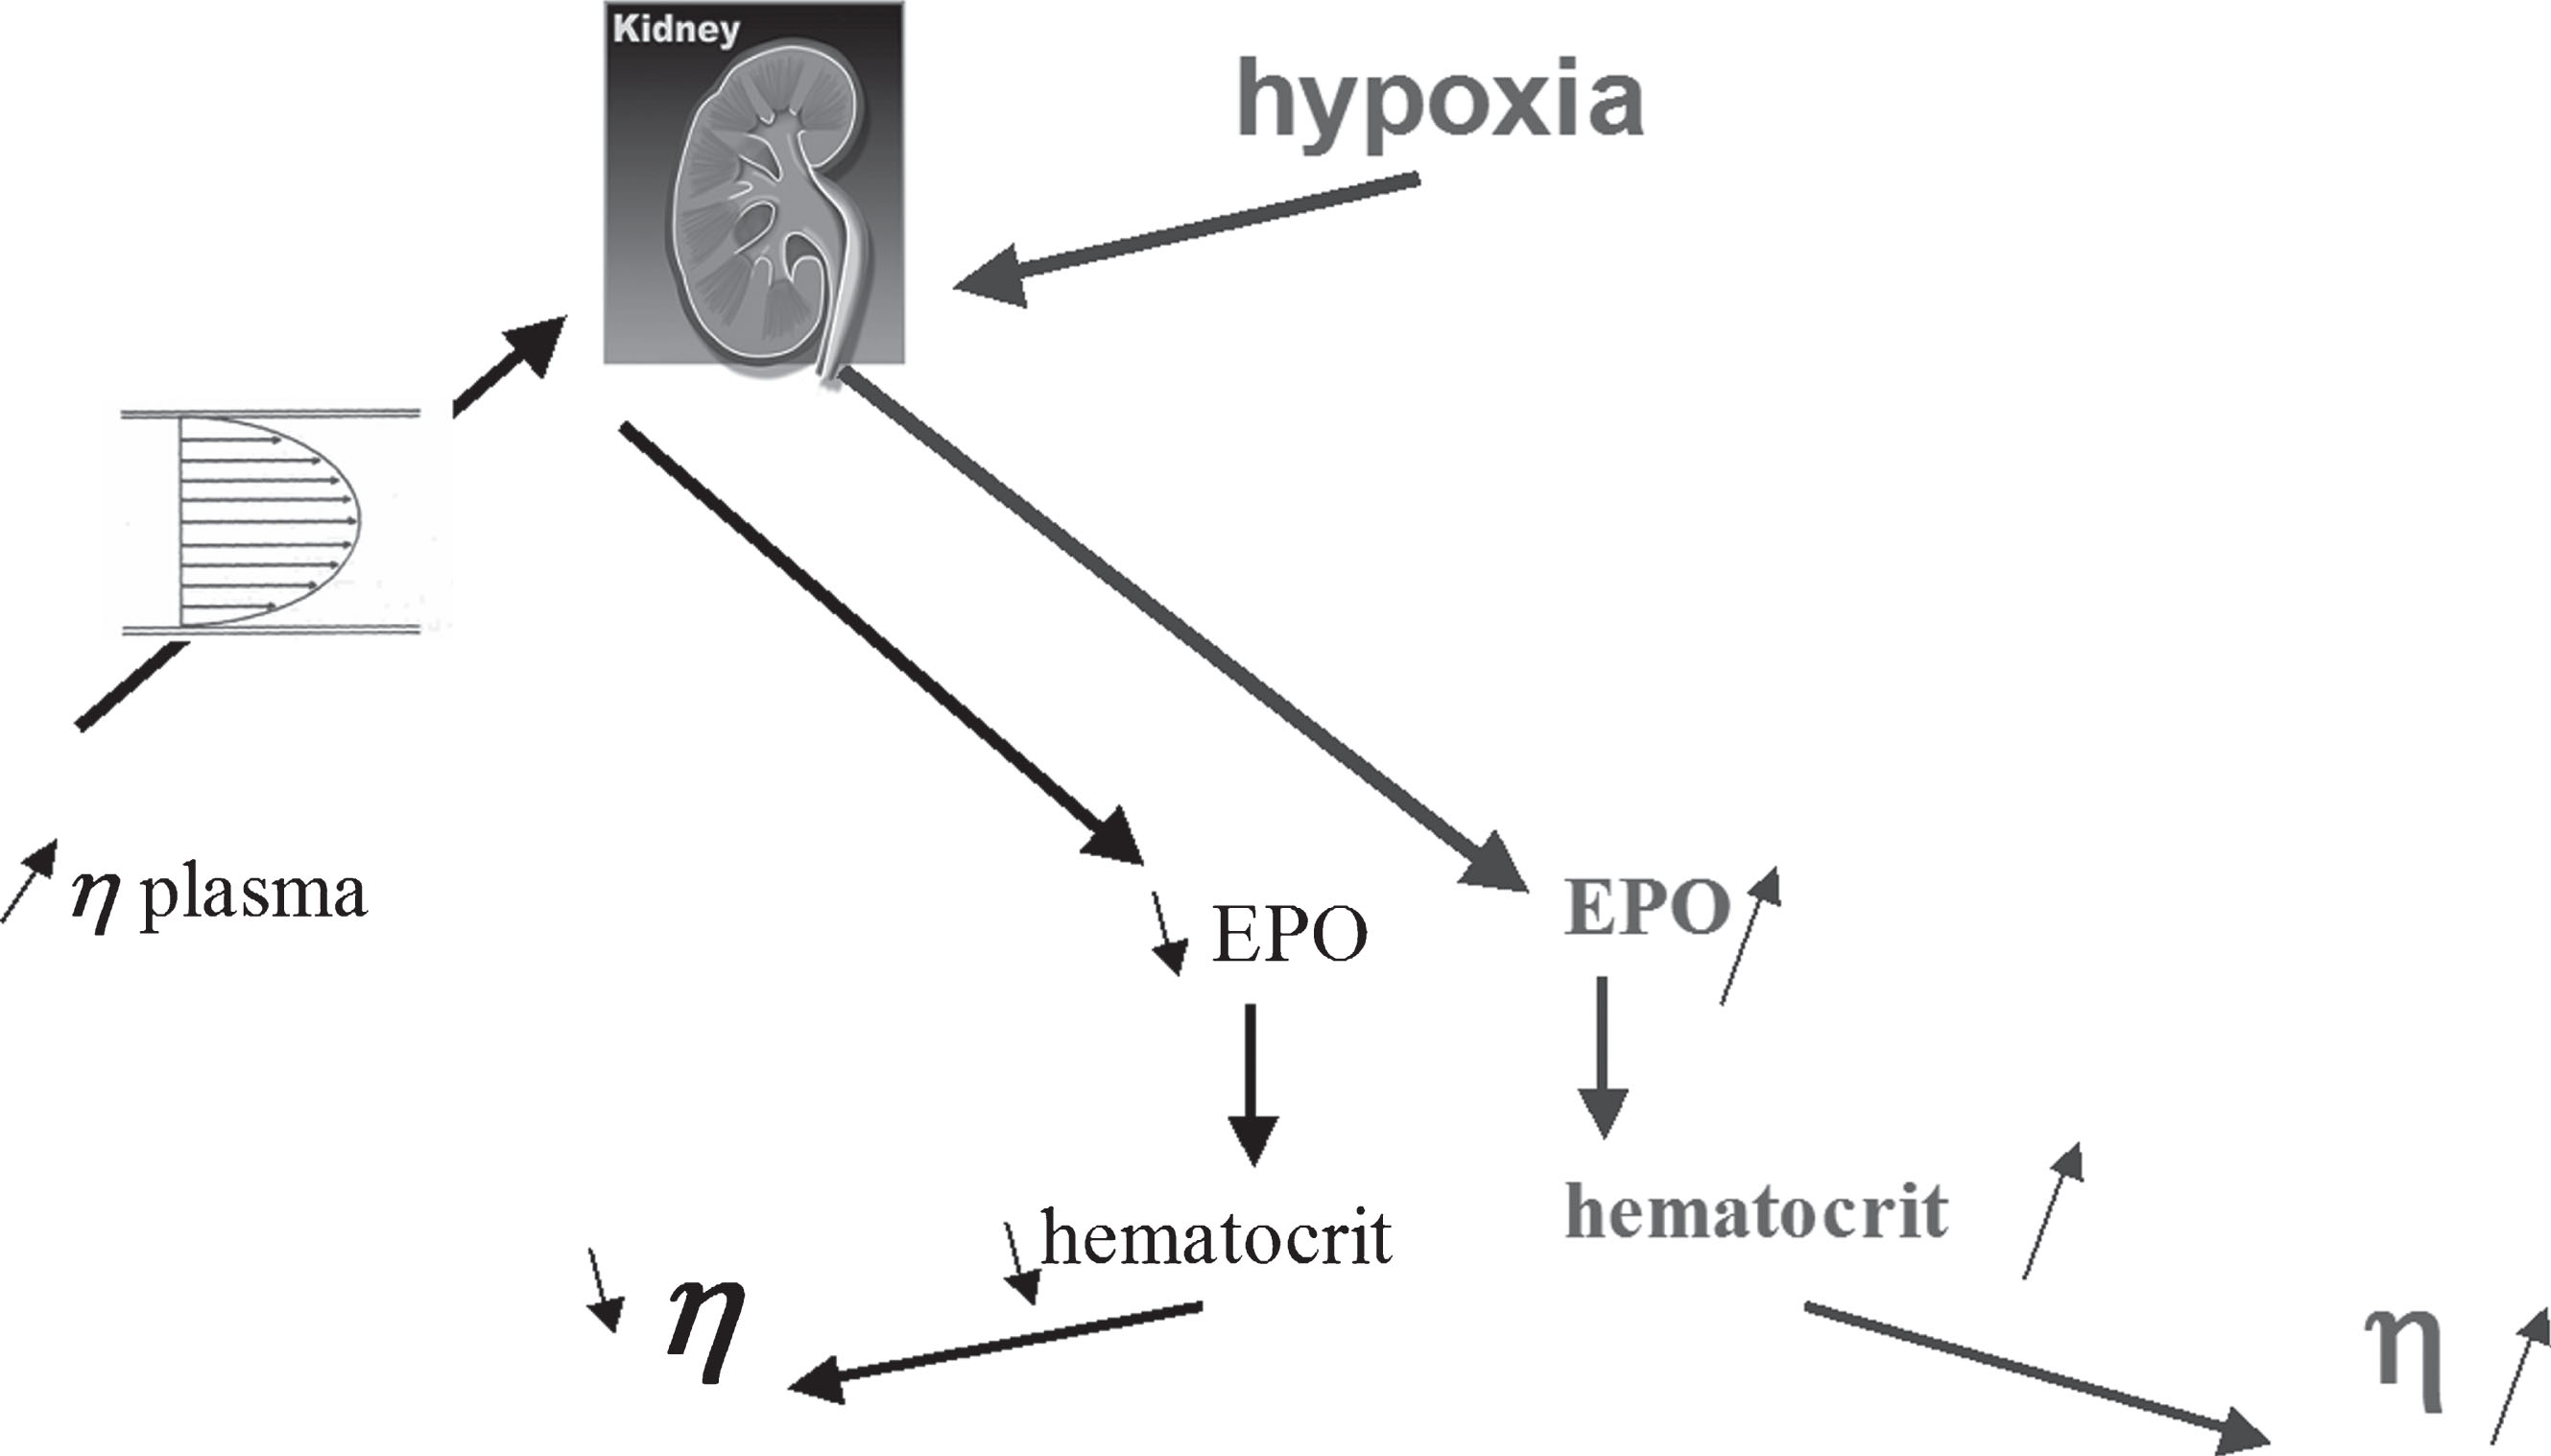
The two faces of EPO: a hormone increasing hematocrit in response to hypoxia and decreasing it in response to plasma hyperviscosity.
There are presumably other viscoregulatory loops. One of the most impressive was described by J. Vogel and coworkers 15 years ago. In transgenic mice overexpressing erythropoietin and thus exhibiting a higher hematocrit, they evidenced an increase in RBC flexibility, presumably linked to increased plasma NO levels, so that whole-blood viscosity was maintained at a normal level [33].
In humans, another mechanism is likely to explain the findings of Pichon and coworkers that reported in elite athletes, that the increase in hematocrit induced by training in altitude can be fully compensated by a parallel decrease in plasma viscosity so that whole blood viscosity is not increased [21]. This mechanism seems to be related to the parallel training-induced decrease in plasma viscosity but can be considered to some extent as an homeostatic adaptation which requires further attention.
Actually exercise can exert over the time three separate effects on blood rheology, all of them being explained in part by changes in hematocrit [2, 3]. Briefly, the short term effect of exercise is a transient increase in blood viscosity, whose main mechanisms are a rise in hematocrit and plasma viscosity resulting from hemoconcentration and plasma enrichment in proteins released by the lymphatic network. The middle-term effect (over a dozen of postexercise hours) is a decrease in blood viscosity due to a reversal of hemoconcentration resulting in some degree of dilution, with a decrease in hematocrit and plasma viscosity. The long-term effect is due to regular activity which modifies some aspects of metabolism and body composition (lipid profile, somatotrophic axis, insulin sensitivity) that are reflected in red cell properties (aggregation and deformability) and are usually also associated with a lower hematocrit reflecting increased plasma volume. Markers of this profile are correlated with measurements of aerobic capacity. This picture is usually found in endurance trained individuals, but in other varieties of training (eg, resistance exercise) it may be somewhat different.
In most series of athletes aerobic working capacity (VO2max) is negatively correlated to hematocrit, showing that low viscosity and hematocrit are a determinant of fitness. Accordingly, in polycythemic patients with chronic obstructive pulmonary disease (COPD) phlebotomy or hemodilution improve exercise tolerance [9]. This finding demonstrates that hematocrit should not be too high. The most likely explanation for this is that this treatment reverses a hyperviscosity situation responsible for impaired exercise ability.
However, it is well known that one of the most popular forms of doping is the use of various techniques (autoperfusion of red cells, erythropoietin injection) increasing erythrocyte count and hematocrit up to a supraphysiological level. The rationale for this procedure is that the higher hematocrit will be, the higher oxygen transfer to muscles, but the physiological facts reminded above are in complete disagreement with this. This as lead hemorheologists to define a “paradox of hematocrit in athletes” [1].
The fact is that doped athletes with high hematocrit win races, while this seems absurd if one considers the classical hemorheological paradigm of haematocrit being the major factor of viscosity and thus peripheral resistance. The explanation is that in conditions of high flow a higher hematocrit is beneficial for optimal performance, as evidenced in isolated muscles by the team of P. Gaehtgens. According to these investigators, in working skeletal muscle (compared to resting muscle) the optimal hematocrit is likely to be shifted to higher values [14]. Therefore, in exercising skeletal muscle, high hematocrit does not impair blood flow, and can increase oxygen supply and thus maximal performance [1]. However at rest, in conditions of low flow, cases of venous thrombosis have been observed, showing that high haematocrit is not a so safe doping procedure, most probably because it results in blood hyperviscosity in low shear low flow conditions [24].
Biophysical models to predict optimal hematocrit?
Since several mathematical models of blood viscosity are available in the literature, there have been attempts to use them for predicting the optimal hematocrit.
Stark [28] compared several formulas describing the dependence of viscosity on hematocrit and found most of them rather powerful.
Schuster [26] used more specifically Einstein and Arrhenius equations, and concluded despite major simplifications, they were able to predict ‘optimal’ hematocrit values around 40% which were in good agreement with observed values. Moreover, theoretical optimal hematocrit values in marine mammals around 65%, were predicted, in agreement with current measurements.
Relevance of the hematocrit/viscosity ratio
Classical hemorheologic literature [29] has established the h/η ratio as an index of blood’s overall oxygen transport capacity. This ratio displays, plotted against hematocrit, a bell-shaped curve whose top is likely to occur at the optimal hematocrit value (Fig. 2).
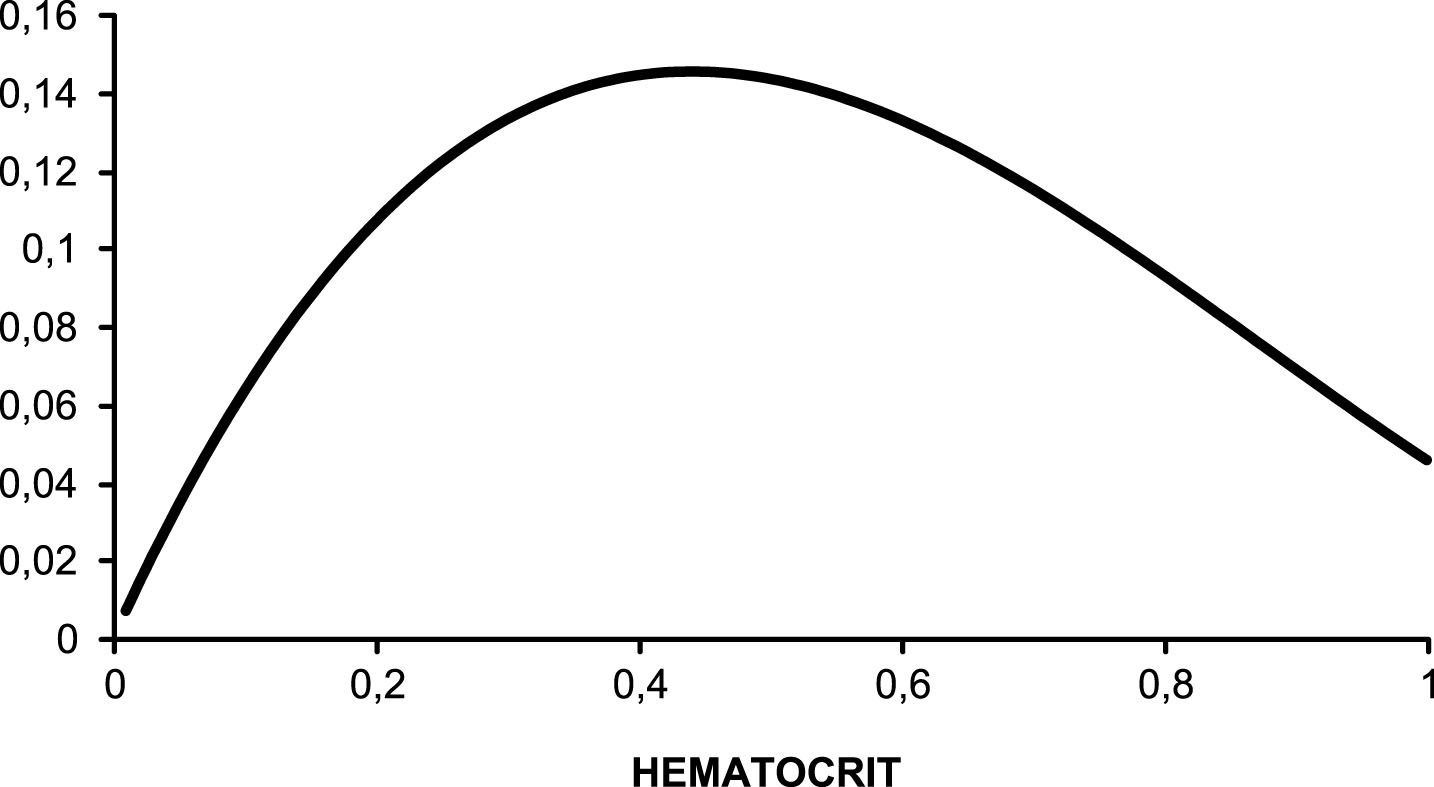
The theoretical model of optimal hematocrit, showing that hematocrit/viscosity (predicted with Quemada’s model) displays a bell shaped curve as a function of hematocrit. The optimal value of hematocrit is the value which results in the highest value of the ratio hematocrit/viscosity. Example based on viscometric measurements at very high shear rate (1000 s–1).
Recently several reports have provided some evidence of the relevance of this h/η ratio.
Philippe Connes [10] has reported a link between low and recurrent leg ulcers in patients with sickle cell anemia. The same team investigated the relationships between h/η ratio and microvascular oxyhemoglobin saturation measured by spatial resolved near-infrared spectroscopy (NIRS) at cerebral and muscle levels in healthy subjects, patients with sickle cell SC disease, and patients with severe sickle cell anemia [34]. They found that this h/η ratio was positively correlated with oxyhemoglobin saturation at both the cerebral and muscle level, and concluded that respectively). These findings suggest that h/η is likely to modulate the amount of oxygen available for tissues, but the strengths of the associations appear to be rather weak. This suggests that other factors regulate microvascular blood flow and oxygenation, such as vascular geometry and vasomotor reserve. However this study is in agreement with the theory of h/η and optimal hematocrit. This team also calculated those optimal hematocrit values via curve fitting of the h/η ratio versus haematocrit data, and they found that it was lower in sickle cell anemia than sickle-hemoglobin C disease, and was shear rate dependent in sickle cell anemia [30].
Norbert Nemeth [20] has extensively studied this issue in various species and confirmed that there is a bell-shaped curve as assumed by the theoretical models. This bell-shaped aspect is clearly found with viscosity measurements at high shear rate and vanishes at low shear rate.
We recently investigated this issue of optimal hematocrit on the basis of the h/η ratio paradigm, using some databases of previous works performed by our team, with the equation of Quemada [22]:
Where ηr is relative blood viscosity ηb/ηpl.
According to this very classical model, the curve of theoretical optimal h/η plotted vs hematocrit was reconstructed and the value of hematocrit corresponding to the top of this curve was considered as the “theoretical optimal hematocrit”.
This calculation yields a curve of as a function of hematocrit which is very similar to the theoretical one assumed by classical authors and to the actual curve as recently published by Nemeth [20] and by Schuler [25]. Furthermore, model-predicted values of optimal h/η and hematocrit are well correlated with the actual values in all the various populations investigated. Therefore, this simple model may be used as an additional parameter for interpreting a measurement of blood viscosity. In addition to ηb, ηpl hematocrit, and the parameter k, we can obtain theoretical h/η, actual h/η, theoretical maximal hematocrit, and the discrepancy between theoretical and actual values of hematocrit and h/η
The fair correlations observed in various populations between predicted and actual values of hematocrit and h/η suggest that this model-based approach is accurate. The fact that correlations are closer for h/η than hematocrit may lead to think that h/η is actually the regulated parameter rather than hematocrit itself, in accordance with the theory of the bell-shaped curve.
It is important to add that there are discrepancies between theoretical and actual values of hematocrit and h/η. Rather than reflecting an inaccuracy of the model, these discrepancies seem to have some physiological relevance, since they are correlated to other parameters.
First of all, the analysis of discrepancies between theoretical and actual values shows that actual values of both h/η and hematocrit are slightly lower than predicted. In particular, predicted and actual hematocrit are well correlated but actual is on the average 1% lower than the predicted optimal value.
This seems to be in disagreement with the abovementioned theory of John Dormandy assuming that our prehistoric ancestors had excess red cells in order to cope with the risk of hemorrage, and that our systemic hematocrit is therefore slightly higher than ideal. On the other way about, we may have an hematocrit lower at rest than ideal in order to maintain the possibility to increase our hematocrit during exercise without impairing blood flow.
Accordingly, we observe in both athletes and sedentary subjects that this discrepancy between predicted and ideal values vanishes when exercise is prolonged. Thus acute exercise sets h/η closer from its predicted ideal value, ie, the value which is assumed to be associated with a higher oxygen delivery rate. The discrepancy between actual and ideal resting hematocrit is correlated to the maximal rise in hematocrit during exercise [6].
This could lead to think that during exercise the rise in hematocrit is a mechanism involved in the improvement of oxygen transfer to tissues.
When athletes are well trained, hematocrit at rest is closer from ideal, and its exercise-induced rise is lower. Presumably, these subjects have an optimized oxygen supply to muscles and don’t need to further increase hematocrit during exercise for improving it [4].
Accordingly, in a sample of young endurance athletes we observed that aerobic working capacity (VO2max), which is classically known to be negatively correlated to resting hematocrit, is also positively correlated to the discrepancy between actual and ideal resting hematocrit, showing that this “reserve for increasing hematocrit” may be one of the determinants of fitness [8].
However, in the long term, endurance training reduces this discrepancy between the actual hematocrit and the ideal hematocrit, so that trained athletes compared to sedentary subjects have a higher h/η (despite their lower hematocrit). In that case the abovementioned “reserve” is no longer needed. This issue is not completely clear and requires further research.
Another determinant of the discrepancy between predicted and measured h/η is red cell rigidity and its exercise-induced change. Thus keeping in mind that the optimal hematocrit should not be the same in the various parts of the vascular bed, its theoretical prediction with Quemada’s equation appears to predict a value higher than actual hematocrit but well correlated to it, and the agreement between optimal and actual hematocrit is dependent on red blood cell flexibility [5]. This may suggest that impaired red cell deformability is not beneficial for exercise performance and that in this case the ability to improve h/η may be a compensatory mechanism.
Overtraining in athletes
Overtraining, nowadays rather termed “unexplained underperformance syndrome”, is the situation where performance decreases despite increased training volumes. This is clearly a multifactorial situation, although exercise volume remains a central explanatory mechanism. In previous papers we reported that a mild hyperviscosity of blood was one of the components of this syndrome. One of its signs, the feeling of heavy legs, was correlated to red cell aggregation [32]. The French Society for Sports Medicine (SFMES) proposes a clinical scoring useful for detecting such situations, and a rise in this clinical score is associated with higher blood viscosity, which represents some extent a reversal of the training-induced increase in blood fluidity [2]. Interestingly, the exercise-induced rise in h/η that gets it closer from its predicted ideal value is impaired when athletes quote elevated scores on the overtraining questionnaire. This leads to think that the ability to increase h/η in order to get it closer from its predicted ideal value is a factor of fitness, and that its impairment is associated with a loss of performance. This aspect needs to be further investigated. In addition, when overtraining score increases, the gap between actual and predicted optimal hematocrit is decreased, so that hematocrit is closer to its predicted value.
This leads to think that the body sets hematocrit below its ideal value in sedentary (or less fit) subjects in order to cope with the need of increasing blood viscosity factors in case of exercise without impairing O2 supply to tissues. This adaptation appears to be no longer needed in chronically fit athletes that thus have a value of hematocrit (and h/η) closer to ideal.
Intrauterine fetal hemorheology
A very special situation where this issue of optimal hematocrit is interesting to study is fetal blood and its relationships with hemodynamics, because vascular reactivity of the fetus is not efficient, and at the end of intrauterine life hematocrit reaches very high values. Physiological studies on fetal blood in narrow glass tubes have suggested that fetal optimal hematocrit might be as high as 60% [18]. In a database of 28 intrauterine cord punctures (between 19 and 33 weeks gestation) with doppler measurements of resistance in umbilical arteries, we found that theoretical ‘optimal hematocrit’ was well correlated to actual but systematically much lower than the actual one (12% hematocrit units below). By contrast the predicted value of h/η was exactly the same than the actual one. Interestingly, these parameters were correlated to hemodynamics.
Umbilical artery resistance index measured with doppler was correlated with actual hematocrit and with the discrepancy between ideal and actual hematocrit. This leads to think that the discrepancy between ideal and actual may reflect a ‘viscoregulatory mechanism’ maintaining hematocrit below that theoretical value in order to avoid excess vascular resistance [7].
Conclusion
As summarized above, there is now an increasing evidence that the theory of ‘optimal hematocrit’ is relevant to human physiology and pathophysiology, and mostly in exercise hemorheology. Past controversies are related to a too simplistic interpretation of the relationships between hematocrit (and other viscosity factors) and both blood oxygen supply and exercise performance. We should be well aware that a moderate increase in hematocrit (and/or viscosity) in physiological conditions may be beneficial rather than deleterious for muscular activity. However, hematocrit levels achieved in doped athletes are sometimes far above the predicted ideal values obtained in physiological studies. Due to the specific conditions of microcirculation in exercising muscles this does impair exercise performance, but probably results in increased thrombotic risk, although literature on this issue remains scarce. Our study of fetal circulation shows that a high hematocrit is correlated to artery resistance and thus deleterious for blood flow.
We propose that the development of models predicting optimal hematocrit, as illustrated here, can provide a tool for better understanding hematocrit physiology and pathophysiology in exercising humans. We think that the calculation of a model-derived “optimal hematocrit” is an useful add-on to the classical hemorheological profile of a blood sample.
Footnotes
Acknowledgments
This oral communication was presented at the 1st Hemorheology Days. July 19-21, 2017, Puchberg/Schneeberg, Austria.