
Abstract
AIM:
Aim of this study was to firstly describe reproducible, objective perfusion parameters of contrast-enhanced ultrasound (CEUS) kinetics of parathyroid gland adenoma (PA) using perfusion analysis software (VueBox®, Bracco, Italy). Thereby the efficiency of quantitative CEUS for characterization of PA should be evaluated comparing US to postoperative histopathological findings after PA resection.
MATERIAL AND METHODS:
42 patients with symptoms/lab work suggestive of pHPT presented a parathyroid gland lesion in B-mode US, which was consequently analyzed by dynamic CEUS. CEUS was performed by one experienced examiner after i.v.-injection of max. 2.4 ml sulphurhexaflouride microbubbles saving digital DICOM cine loops (up to 25 s) and images. PA were evaluated during arterial, venous and late phase (up to 3 min.) for perfusion characterization. A retrospective, blinded VueBox® perfusion analysis of arterial phase of 28/42 PA was performed by a second, independent examiner placing 3 ROIs manually in the PA (center, rim of PA, surrounding thyroid gland tissue) to objectify findings. US findings were correlated to postoperative histology after PA resection.
RESULTS:
Out of 42 patients with PA findings in CEUS, perfusion analysis could be performed in 28/42 cases only as some CEUS cine loops had too much moving. In three cases the second examiner could not detect PA retrospectively, in 25 cases PA were characterized correctly resulting in a sensitivity rate of 89.3 %. VueBox® perfusion analysis confirmed that PA present a persisting hypervascularization of the rim with higher TTP (mean 7.93 s centrally, 8.36 s rim-sided), mTT (mean 56.6 s centrally, 64.5 s rim-sided) and lower PE (mean 10542.93 rm2 centrally, 8909.21 rm2 rim-sided) peripherally followed by a central wash-out during later phases. RT was comparable in all defined regions.
CONCLUSION:
VueBox® analysis of parathyroid gland CEUS examinations seemed to be a valuable tool for quantification of a PA’s perfusion and can help to detect and localize hyperfunctional parathyroid glands prior to surgery.
Keywords
Introduction
Preoperative localization of parathyroid gland adenomas (PA) in the case of primary hyperparathyroidism (pHPT) represents an inevitable requirement for a rapid, safe, targeted and less complicated surgery [1–3]. Different imaging techniques such as scintigraphy, positron emission tomography (PET), single-photon emission computed tomography (SPECT) or cross-sectional imaging such as computed tomography (CT), magnetic resonance imaging (MRI) or conventional ultrasound (US) are available and more or less well analyzed regarding their sensitivity in detection of PA [4–15]. Depending on the imaging technique sensitivity rates over 90 % are reported for localization and characterization of PA [6–9, 13]. In this context, our group already showed that contrast-enhanced ultrasonography (CEUS) based on detection and characterization of microcirculation and microvascularization turned out as a reliable diagnostic tool to localize PA in patients with pHPT [16]. Even in the presence of concomitant goiter, double adenomas and patients with previous neck surgery CEUS revealed advantages compared to other diagnostic techniques, especially 99mTechnetium-sestamibi scintigraphy [17, 18]. However, for correct and reliable application of CEUS a well-experienced examiner is required, which is the most important limitation for a widespread availability as standard diagnostic procedure [17]. More reliable and thus also less examiner-dependent, modern computer software which enable a quantification of an organ’s or lesion’s perfusion are available to simplify CEUS interpretation of parathyroid gland adenoma and to make diagnostic exploration easier [19, 20]. A contrast perfusion quantification program such as VueBox® (Bracco, Italy) implies a detailed quantitative analysis using color-coded maps and perfusion curves. Thereby, reproducible perfusion parameters can be acquired in order to evaluate the kinetics of a lesion’s microvascularization [21], which can be performed and interpreted more easily by less experienced examiners too.
Aim of this study was to initially describe reproducible perfusion parameters of PA using VueBox® analysis of CEUS examinations [22]. Thereby, the efficiency of VueBox® for diagnosis of PA in patients with pHPT should be assessed by correlation to histopathological results after parathyroid gland resection.
Methods
The study was approved by the Institutional Review Board of the University Hospital of Regensburg (# 11-101-0168). Written informed consent by all patients was obtained prior to any investigations.
US DICOM data of CEUS examinations of 42 subsequent patients with suspicion of PA in B-mode US were retrospectively analyzed. The suspicion was based on clinical signs of and/or lab work suggesting the presence of a pHPT assessed by the local department of surgery. Exclusion criteria were persistent or recurrent pHPT, secondary HPT and/or allergy to contrast agent.
All US examinations were performed by one experienced examiner (>10 years experience with over 3000 US examinations per year) using multifrequency linear probes of 6–9 MHz in virtual convex mode. Every examination included fundamental B-scan in the axial and sagittal plane and Doppler sonography techniques such as Color Coded Doppler sonography (CCDS) and Power Doppler (PD). The US examinations were stored digitally as DICOM cine loops or images on the ultrasound machine and in PACS in axial and/or sagittal plane of the parathyroid regions for subsequent evaluation. After detection of focal parathyroid gland lesions, the same examiner performed CEUS after i.v. – bolus injections of up to 2.4 ml sulphurhexaflouride microbubbles (SonoVue, Bracco, Italy) in Contrast Harmonic Imaging Technique (CHI) with a reduced mechanical index (MI) of 0.16. Parallel imaging of CEUS and B-mode was used to dynamically evaluate parathyroid lesions from (early) arterial (10–45 s) up to a late phase (2 min. or more). The initial arterial loop was documented continuously up to 25 s scanning bilateral parathyroid regions alternately followed by loops of 5–10 s for further evaluation of wash-in and wash-out kinetics (Fig. 1). A persisting arterial hyperenhancement of the rim followed by a central wash-out up to the late phase were considered signs of PA. If signs of PA were present in B-mode and CEUS, the loops were secondly stored on an external harddrive for secondary VueBox® analysis by an independent examiner.
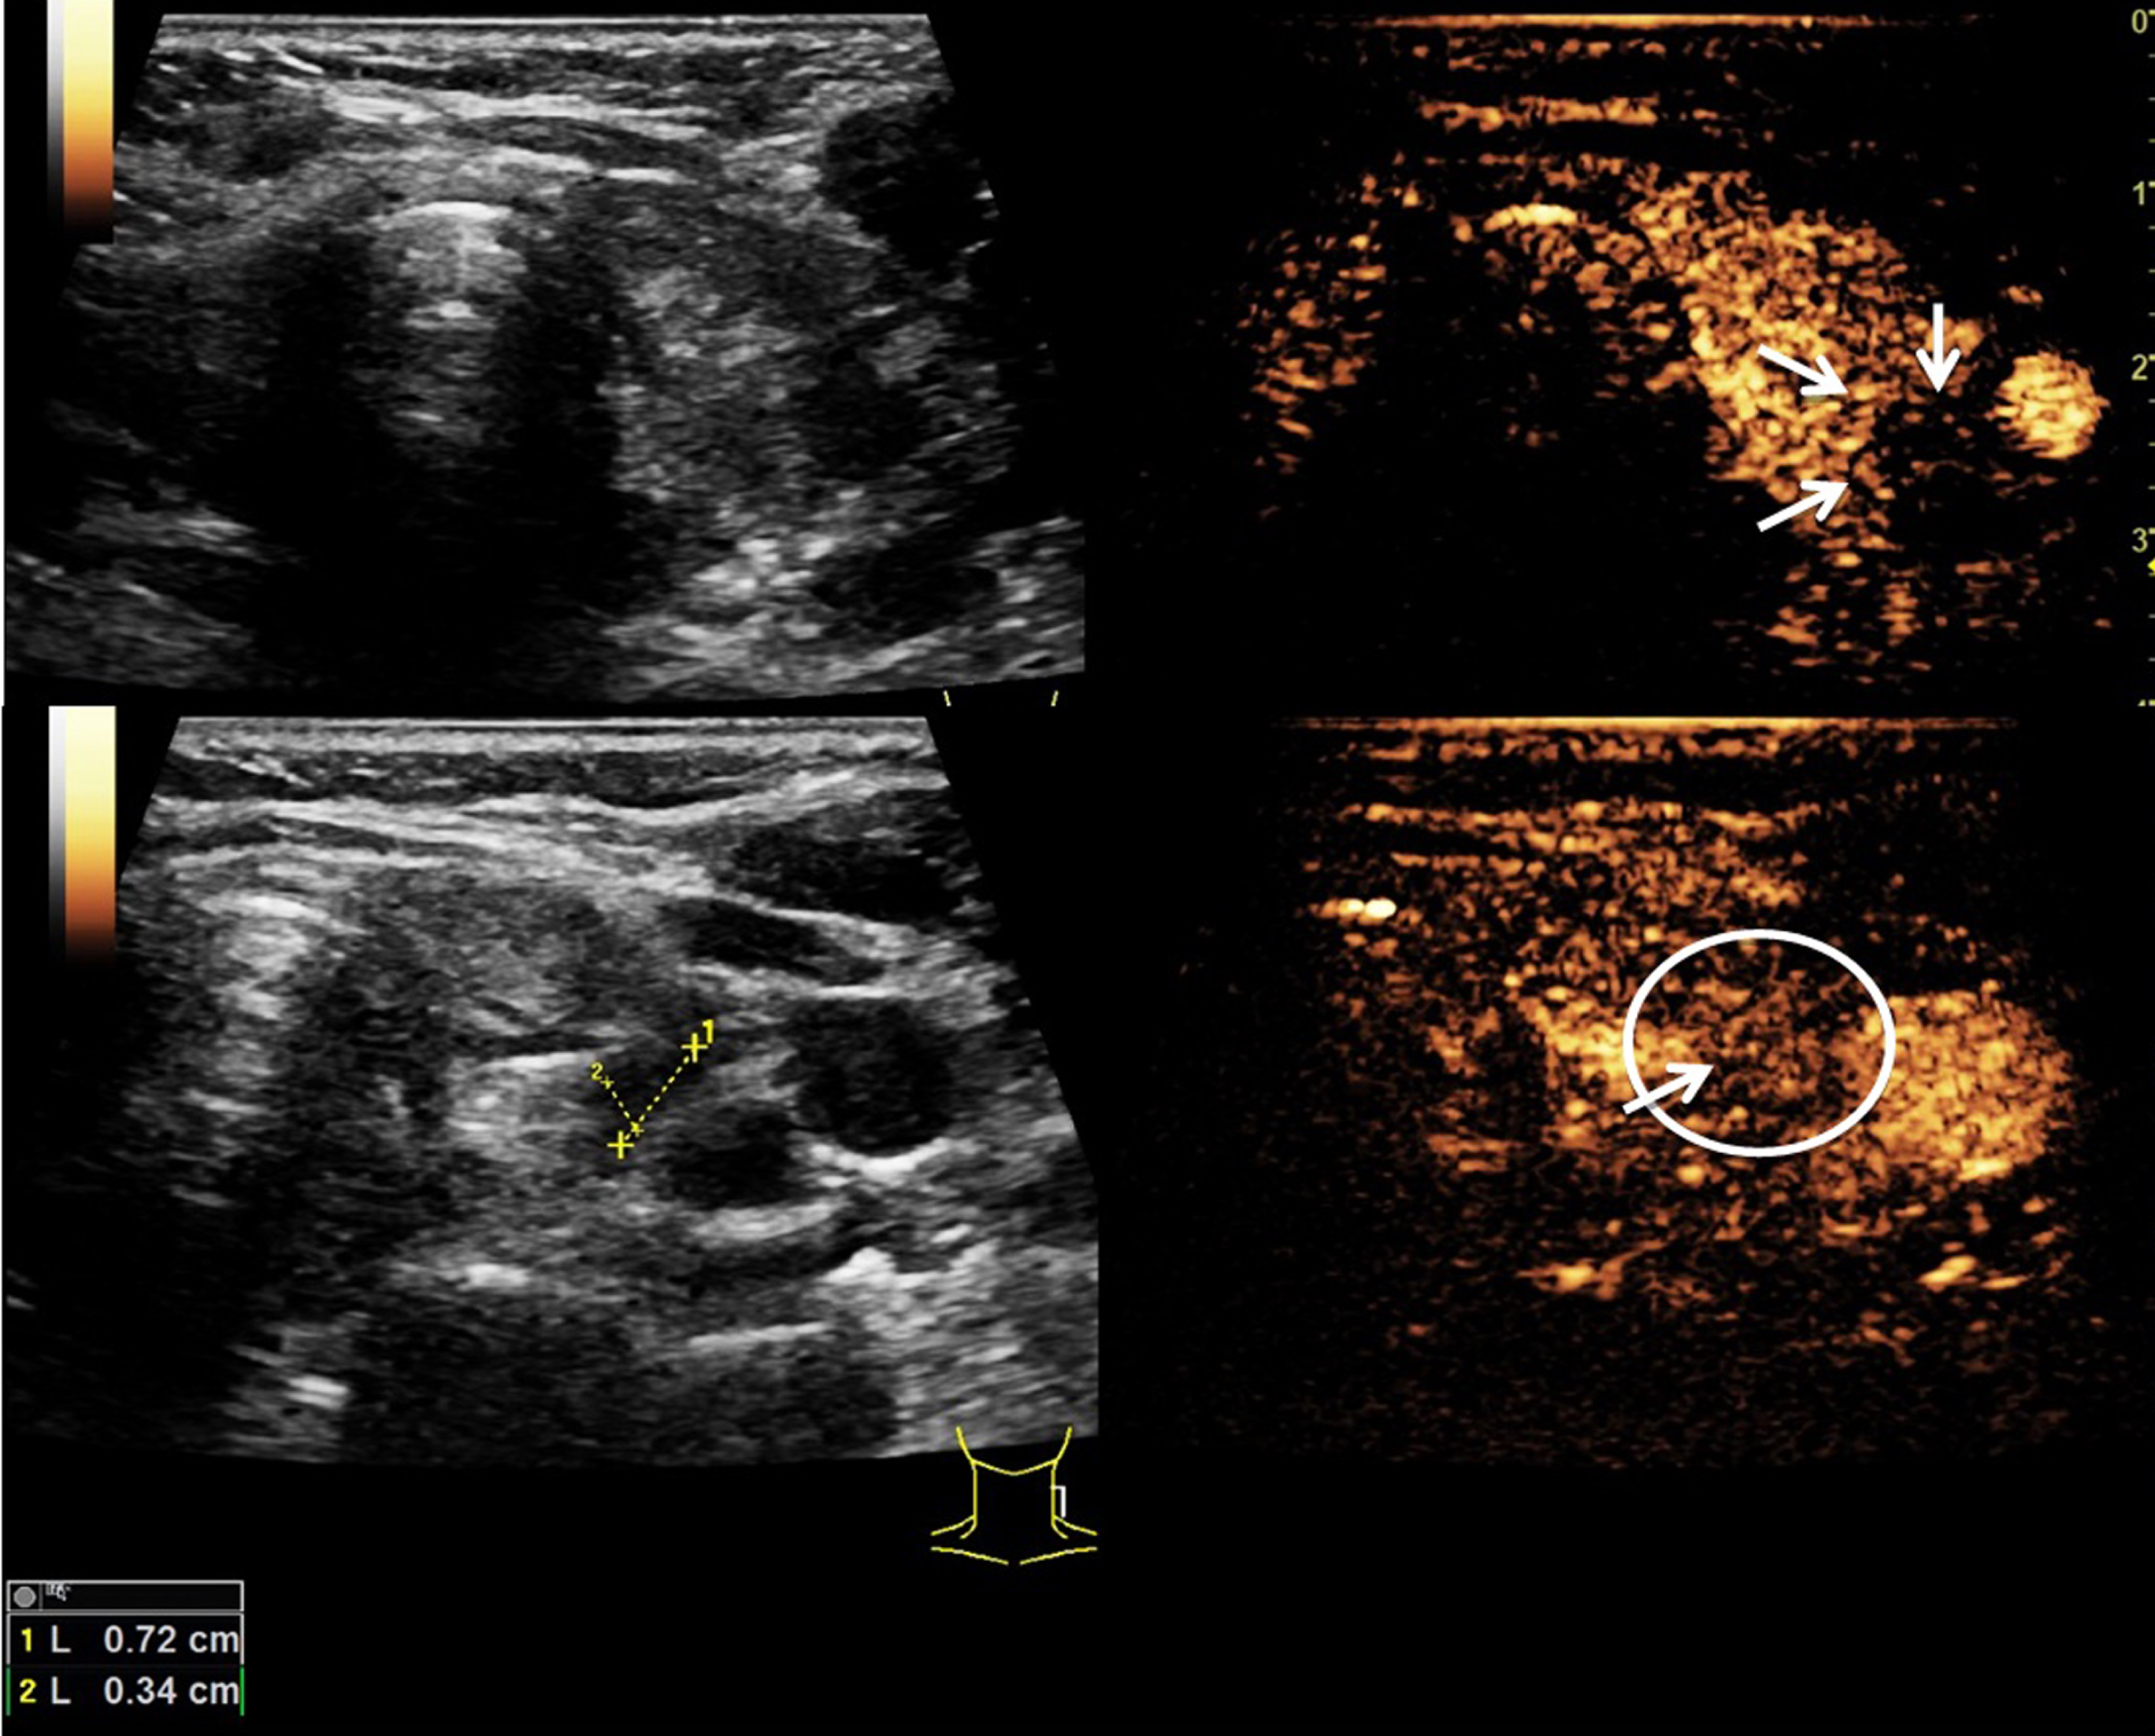
B-mode (left) and CEUS (right) of a patient with concomitant goiter and intrathyroidal nodules as well as a parathyroid gland lesion (see white arrows upper right image). During arterial phase (at 13 s, upper images, arrows) the lesion shows a rim hypervascularization followed by a central wash-out during later contrast phases (at 55 s, bottom image, circle and arrow). Findings were suggestive of a PA. Postoperative histopathological results after surgical resection confirmed US findings.
VueBox® is an external CEUS perfusion analysis software with already integrated motion correction. Using digitally stored DICOM cine loops, evaluation of organs’ or lesions’ perfusion is enabled after linearization of the DICOM clips and application of curve-fitting models. US data were anonymously transferred to VueBox® for a retrospective reading by a second, blinded examiner. Analysis was performed in dual screen mode (B-Mode and CEUS) starting with a synchronisation of B-mode and CEUS of the first arterial loop. Next, regions of interest (ROIs) were placed manually in the center of the suspected tumor, the margin of the parathyroid gland lesion and in the thyroid gland as reference region (Figs. 2 and 3). Results of the software’s perfusion analysis were presented as parametric images (color-coded maps) and fitted and linearised time intensity curves (TIC). An automatic calculation of reproducible perfusion parameters including absolute peak enhancement (PE) as expression of echo power (in rm2), mean Transit Time (mTT in s), Time to Peak (TTP in s), and Rise Time (RT in s) of parathyroid lesions and thyroid gland for reference reasons was performed [21, 22].

VueBox® analysis of another patient with parathyroid gland lesions suspicious of PA. After synchronization of externally stored US B-mode and CEUS loops a linearization is performed. By manual placement of differently colored ROIs inside the target lesion, at its rim and in the thyroid tissue as reference region, a TIC-analysis can be performed to acquire reproducible perfusion parameters. This figure shows an application example of VueBox® for measurement of the mTT in the PA’s center (green ROIs), in its periphery (yellow ROIs) and in the reference thyroid tissue (lilac ROIs). The fitted curves (bottom left) represent the results of the table (bottom right) graphically. The highest mTT could be measured at the PA’s rim followed by its center. The thyroid presented the lowest mTT.
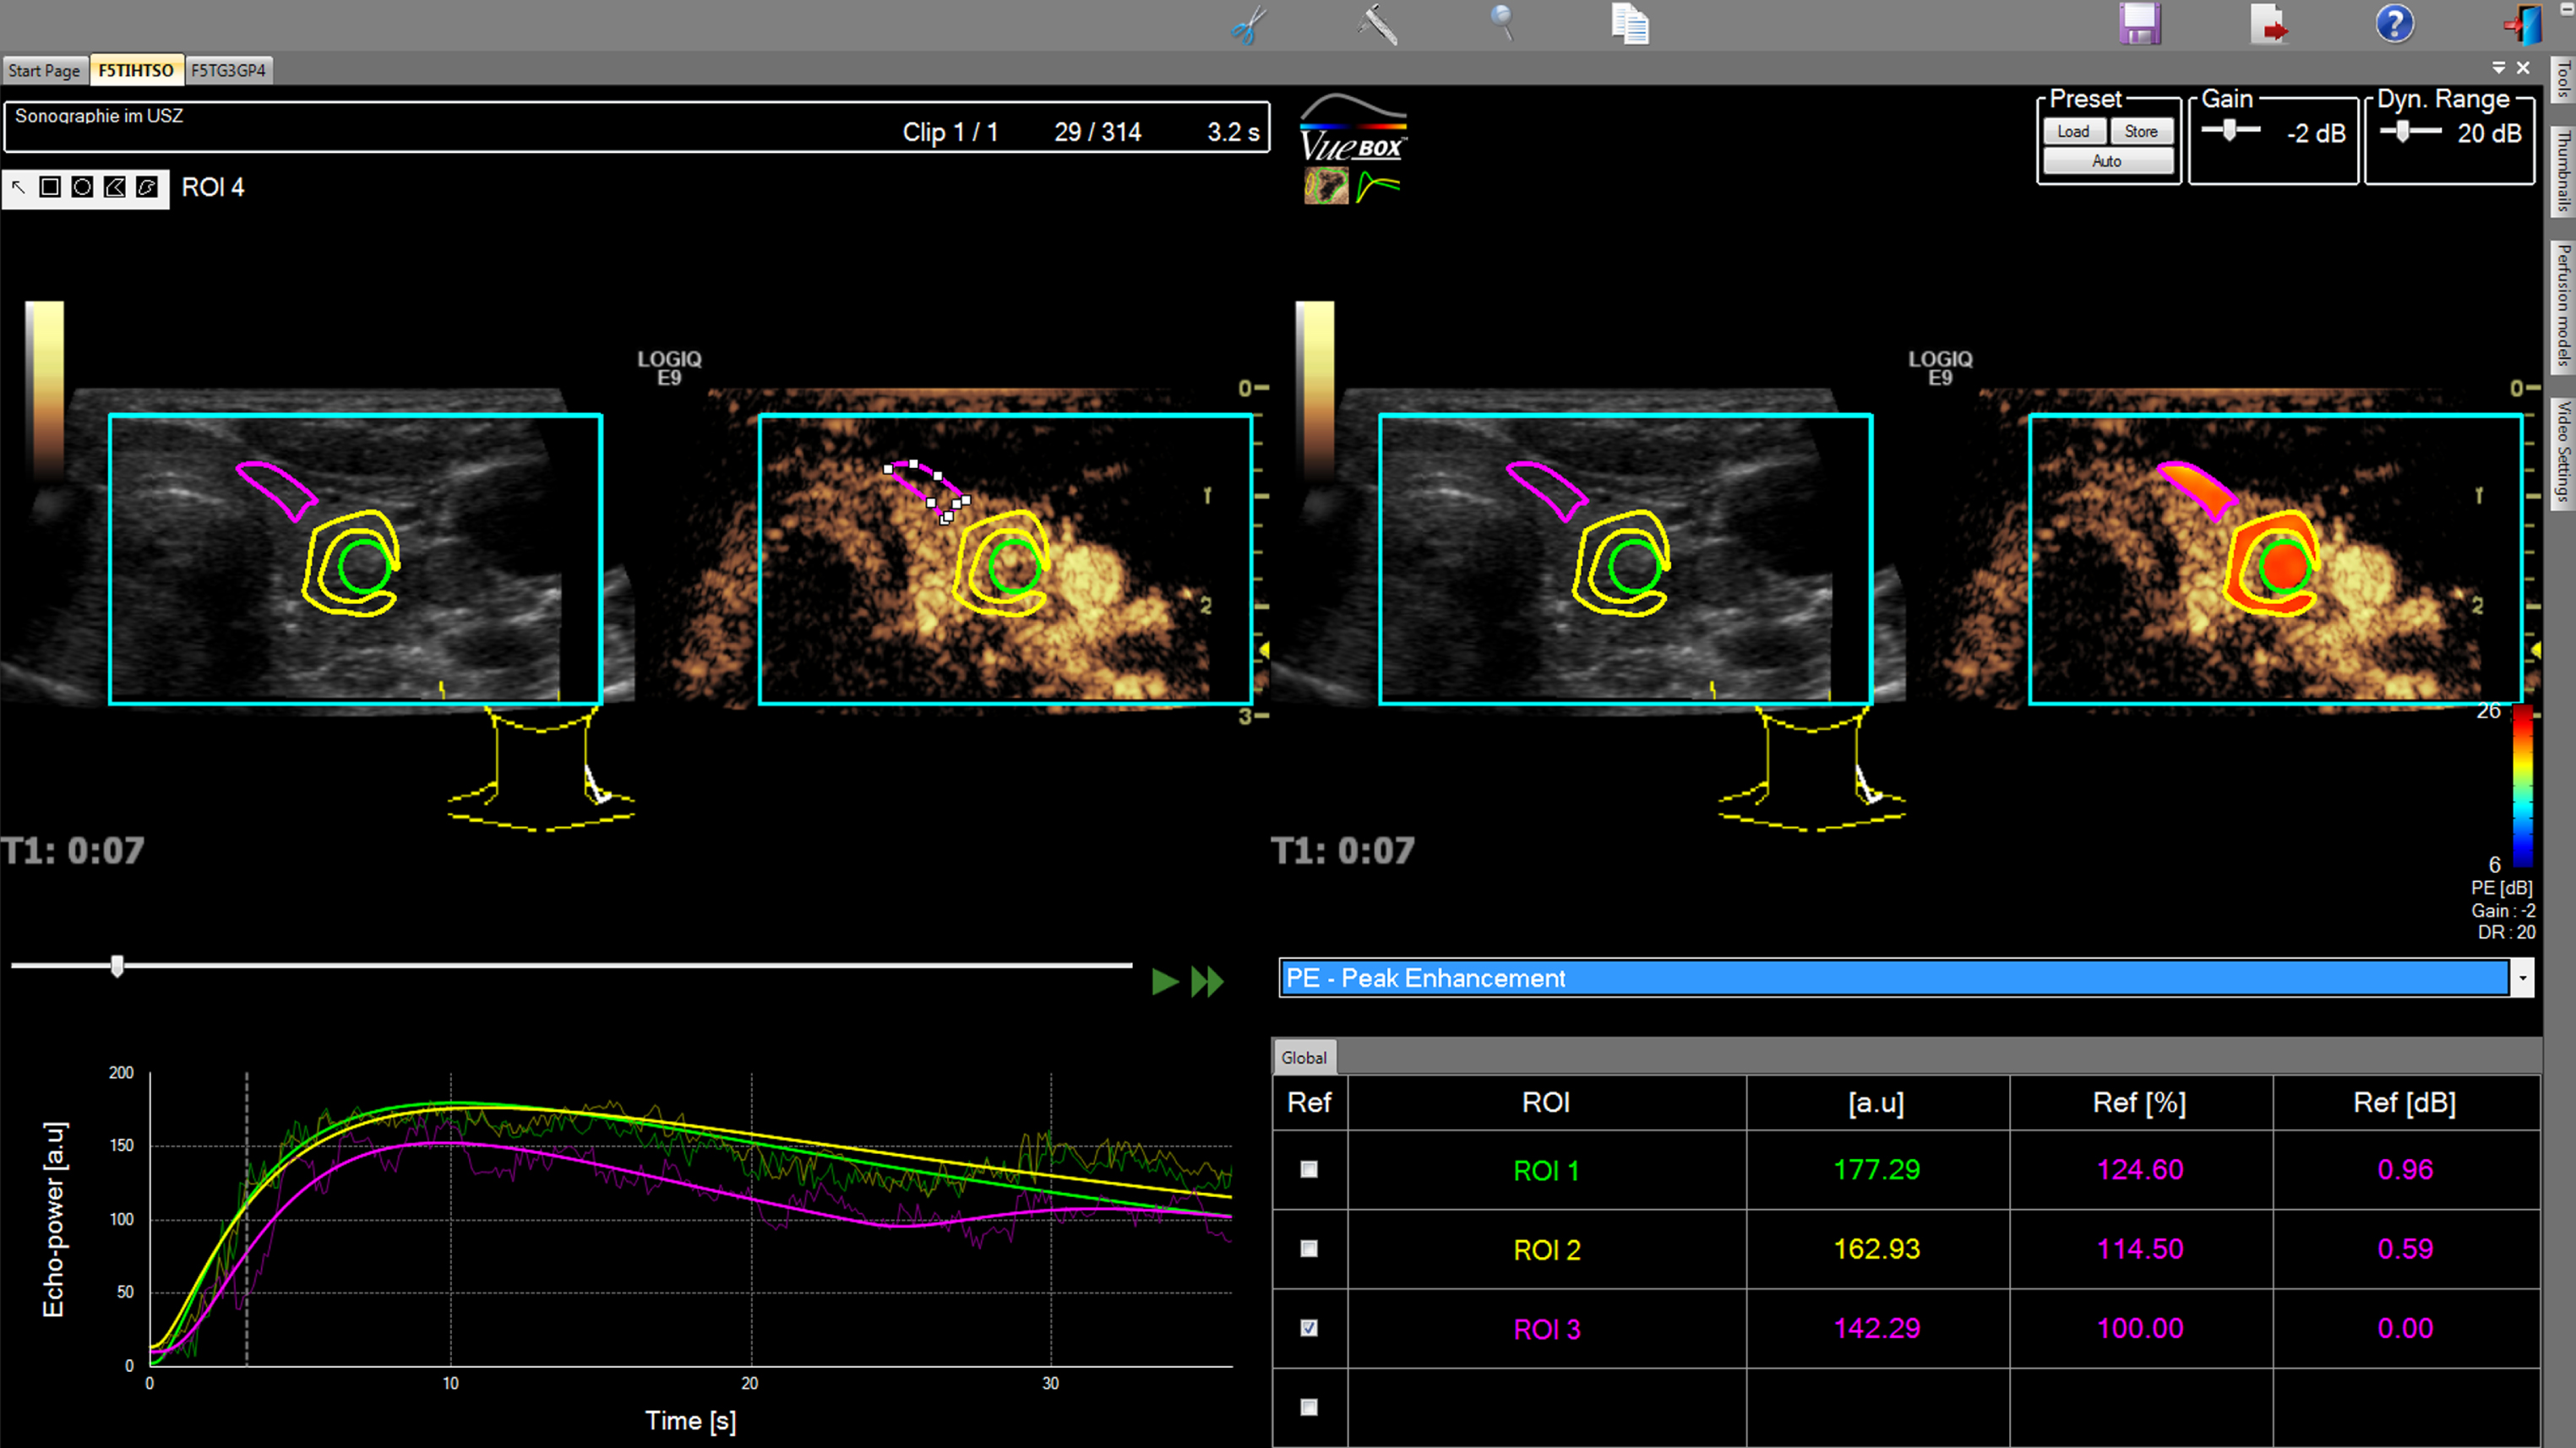
VueBox® analysis of the same patient as in Fig. 2 with parathyroid gland lesion suspicious of PA. After manual placement of differently colored ROIs inside the target lesion, at its rim and in the thyroid tissue as reference region, a TIC-analysis can be performed to acquire reproducible perfusion parameters. This figure shows an application example of VueBox® for measurement of the Peak Enhancement in the PA’s center (green ROIs), in its periphery (yellow ROIs) and in the reference thyroid tissue (lilac ROIs). The fitted curves (bottom left) represent the results of the table (bottom right) graphically. Values in PA were higher than in the reference region though PE was lower at the rim compared to central measurements.
US findings were correlated to histopathological results after surgical resection of PA to confirm findings. Complete removal of hyperfunctioning parathyroid glands was documented by intraoperative measurement of parathyroid hormone serum levels (IOPTH). Follow-up of the calcium serum level was performed immediately and after 8 weeks.
Statistical analysis was performed using SPSS (24, IBM) and Microsoft Excel (Version 14.7). Arithmetic mean value±standard deviation are given for all analyzed perfusion parameters. For statistical analysis a one-factorial ANOVA was used to verify changes between center and rim of a tumor and also between tumor and surrounding tissue. The sensitivity rate was defined as number of all correctly characterized PA in relation to all examined PA.
Results
A total number of 42 patients with lab findings of pHPT and suspected PA in B-Mode US were examined in the local US department using CEUS performed by an experienced examiner. Qualitative reading of CEUS loops showed an arterial hyperenhancement of the lesions’ rim in 27 of 42 cases and a late central wash- out in all 42 cases indicating the presence of PA. Sensitivity of CEUS was 100 %. IOPTH monitoring during PA resection showed a sufficient decrease in all cases indicating the complete resection. Postoperative histopathology confirmed presence of parathyroid gland adenoma in all 42 cases.
A secondary perfusion analysis of the enlarged parathyroid glands was performed by an independent, second reader to evaluate the efficiency of VueBox®. As some CEUS cine loops had too much moving artifacts or did not document a single gland over a sufficient time period, only 28 of 42 cases could be analyzed by VueBox®.
PA could be correctly detected and characterized in 25 of 28 cases using VueBox® perfusion analysis. In 3 cases the second examiner failed to correctly position the ROIs suggesting that the reader could not identify and characterize these lesions. Therefore, the resulting sensitivity rate for PA was 89.3 % using VueBox®.
Comparing both techniques, CEUS performed by an experienced examiner was superior to perfusion analysis using VueBox® in detection of PA.
VueBox® analysis confirmed that adenomas of the parathyroid gland show a hypervascularization of their rim in arterial phase presenting a higher TTP and lower PE at the rim side of lesions compared to central areas. The mean PE in the center was 10542.9 rm2±2205.94 rm2 (28–14954.8 rm2), at the rim 8909.21 rm2±15258.46 rm2 (28–62055.4 rm2), in the thyroid gland 9174 rm2±15539.2 rm2 (28–58626.5 rm2). The mean TTP in the PA center was 7.93 s±5.46 s (0.94–26.97 s), at the rim 8.36 s±5.52 s (2.4–26.59 s) and inside the thyroid 7.99 s±4.92 s (1.18–25.73 s). The RT did not essentially differ neither in rim side and central areas of the PA nor in the reference tissue. The peripheral mean RT was 5.54 s±4.2 s (rim, 0.5–17.4 s) and the central mean RT was 5.26 s±4.09 s (0.51–18.3 s). The mean RT inside the reference tissue was 5.56 s±4.32 s (1.15–18.8 s). The mTT at the rim side of PA (mean 64.5 s±93.9 s, 5.21–441.3 s) was higher compared to the mTT in the center of parathyroid lesions (mean 56.6 s±81 s, 4.3–399.5 s), though the mTT of the thyroid gland was comparable to the mTT in the PA center (mean 59.5 s±68.86 s, 4.38–308.5 s). These results are summarized in Table 1. None of the parameters quantified using the VueBox® software was significantly changed: center versus rim versus surrounding tissue.
Overview of secondary measured perfusion parameters of PA using VueBox®
Overview of secondary measured perfusion parameters of PA using VueBox®
PE = Peak. Enhancement, TTP = Time to Peak, mTT = Mean Transit Time, RT = Rise Time. All given parameters represent absolute perfusion values of PA after manual placement of ROIs in the center and the rim side of the lesion as well as in the thyroid tissue as reference region.
In this study B-mode and CEUS were used to detect and characterize non-ectopic parathyroid gland lesions suspect of PA in patients with pHPT. Lesions >1 cm can often be assessed by conventional techniques such as B-mode and CCDS [23]. However, ectopic or smaller parathyroid lesions (<1 cm) can be difficult to detect and differentiate from the surrounding tissue, e.g. when concomitant goiter is present, as well as from lymph nodes as they show similar findings in B-mode US [24, 25].
Using CEUS, a differentiation of focal parathyroid lesions from lymph nodes is enabled as PA present with persisting hypervascularization at their rims whereas lymph nodes show a central hypervascularization. These findings underline the advantage of CEUS for assessment of parathyroid gland lesions compared to B-mode US alone or other cross-sectional imaging techniques e.g. CT or MRI or scintigraphy. Though B-mode US is reported to be less sensitive in PA detection compared to scintigraphy, Agha et al. reported sensitivity rates of >95 % for PA detection using CEUS compared to 60.8 % for sestamibi scintigraphy [5, 18]. Even if i.v. – contrast media are used, a differentiation of PA and lymph nodes can be difficult as both lesion types show a homogenous contrast enhancement in CT or MRI. Only by application of late contrast phases (1–3 min.) a wash- out of a suspicious lesion can be detected which enables a differentiation of lymph nodes and PA. This kind of diagnostic procedure is limited in CT examination as it would lead to a double radiation exposure of patients and is hardly applicable during clinical routine.
In this study a second off-line evaluation of CEUS DICOM data was performed to evaluate the VueBox® efficiency. VueBox® findings proved that patients with PA showed a measureable hypervascularization of their rim and were centrally hypovascularized [14, 17]. However, CEUS was superior to the perfusion quantification program concerning the detection of PA resulting in a higher sensitivity rate. CEUS enables a quantification of microvascularization including capillaries and gives important preoperative information about parathyroid gland adenomas. An intratumoral hypovascularization of parathyroid gland adenomas (mean mTT 56.6 s) up to a depth of 4 cm was shown with contrast enhancement of the PA’s rim over a mean transit time of about 64 s compared to the thyroid gland with a mean mTT of 59 s. These findings suggested that a differentiation of PA might be simplified by use of VueBox® though it doesn’t seem to be an applicable tool for clinical routine yet. Significant differences in tumor perfusion have already been reported in hepatic applications using VueBox®: Wildner et al. could quantify significant perfusion differences between hepatocellular and cholangiocellular carcinoma, which could not be achieved in this study [22]. However, our results suggest that further prospective studies with larger patient cohorts are required to potentially detect significant quantifiable differences in PA perfusion.
In three cases the second reader was unable to detect three parathyroid gland lesions by misplacing the ROIs. Because of that an experienced examiner is needed for secondary perfusion analysis of the CEUS cine loops as a retrospective detection of lesions in externally, anonymously stored cine loops can be difficult. Furthermore, cine loops for VueBox® analysis have to be long enough (complete arterial phase of one lesion) and should be free of moving artifacts to acquire reproducible and reliable perfusion values [20, 21]. Some loops in our study had a maximum continuous length of 25 s only, because the US examiner tried to assess both sides of the parathyroid gland lesions during the arterial phase after one single bolus injection of microbubbles. Therefore, in some cases the actual effective maximum peak enhancement has been missed in the documented loops so that findings need to be interpreted cautiously. Due to that fact, VueBox® alone is not feasible yet for detection of PA in routine use and B-mode and CEUS have to be performed and interpreted correctly first by an experienced examiner. To rule out this limitation and to gain loops of sufficient length, a prospective study with two i.v. – bolus injections of contrast medium should be performed to firstly detect the PA and secondly characterize them [16, 17]. Though a second injection could help eliminating this limitation, it would be quite cost-intensive and seems not to be applicable during clinical routine as it would be time-extensive too.
Perfusion analysis of PA using VueBox® showed that perfusion parameters of PA differ sufficiently from the measurements in the thyroid gland so that a more reliable detection and characterization of PA is enabled. Though an experienced examiner is needed to acquire high-quality cine loops for secondary reading, the software enabled a quantitative assessment of PA’s vascularization, which can be used for follow-up examinations after resection if findings could be well objectified. Compared to computer assisted softwares for CT or MRI for detection of focal lesions [26], VueBox® is a non standardized software which cannot detect possible PA automatically but needs manual placement of ROIs inside or around target lesions by an experienced examiner.
All US findings of PA were correlated to postoperative histopathology and all examined lesions were confirmed to be PA.
In comparison to scintigraphy B-mode US and CEUS offer the advantage of radiation free examinations, which are even more cost effective. However, Karakas et al. reported no further advantage of CEUS compared to sestamibi scintigraphy and SPECT for PA detection, but mentioned their limited cohort of 25 patients only. In contrast, Agha et al. reported higher sensitivity rates for CEUS in detection of PA compared to scintigraphy [18]. Berber et al. confirmed these results reporting a superiority of US over sestamibi scintigraphy scans [25]. Furthermore, side effects of other i.v. – contrast agents of CT or MRI such as kidney or thyroid injuries are not described using CEUS [27]. Sulphurhexaflouride microbubbles can easily be reapplied if needed without side effects, which sometimes is needed for a more detailed detection and characterization of PA. In clinical routine, more than one imaging technique is usually applied for preoperative PA localization to minimize surgical extent. Bergenfelz et al. reported in this regard, that the risk of postoperative hypocalcemia decreases with the use of localization techniques, though in clinical routine more than two imaging modalities are performed in a few individual cases only [28].
Conclusion
B-mode and CEUS of parathyroid glands have a high diagnostic value for localization and characterization of PA in patients with pHPT when conducted by an experienced examiner. Though perfusion quantification softwares offer the additional advantage of quantitative perfusion analysis, which can support less experienced examiners in PA evaluation, VueBox® application still requires an experienced examiner and does not seem to be applicable to clinical routine yet.