
Abstract
INTRODUCTION:
This aim of this study is to investigate the individual effects of varying concentrations of thrombin and fibrinogen on clot microstructure (characterised through the fractal dimension of the incipient clot network, d f ) and clot formation time (T GP ) using a fibrin-thrombin clot model. d f and T GP markers are measured using a haemorheological method that has already been investigated for whole blood.
METHODS:
This is an in vitro study using three thrombin concentrations (0.1, 0.05 and 0.02 NIH/ml) and two fibrinogen concentrations (8 mg/ml and 12 mg/ml) to investigate a fibrin-thrombin clot model. The haemorheological changes were measured at the gel point using d f and T GP .
RESULTS:
Fractal dimension (d f ) increased with increasing concentrations of thrombin both at 8 mg/ml (1.60±0.024, 1.67±0.022, 1.74±0.079) and 12 mg/ml fibrinogen concentrations (1.63±0.02, 1.87±0.019, 1.95±0.014). On the other hand, T GP decreased for both 8 mg/ml (1089±265, 637±80, 223±22 seconds) and 12 mg/ml fibrinogen concentrations (2008±247, 776±20, 410±20 seconds). In contrast to previous studies investigating whole blood, T GP increased with higher fibrinogen levels.
CONCLUSIONS:
The findings from this fibrin-thrombin clot model confirmed that d f and T GP can detect changes in the incipient clot following manipulation of fibrinogen and thrombin concentration. d f increases (indicating stronger clot) with higher concentrations of thrombin and fibrinogen. On the other hand, T GP decreased as expected with higher thrombin level but not with higher fibrinogen concentrations.
Introduction
Recent studies based on haemorheological techniques allowed quantification clot microstructure in various clinical conditions [1–5]. An oscillatory shear technique can detect the establishment of the incipient clot at the gel point. As described previously, this technique not only measures the biophysical properties of the clot in terms of clot structure (fractal dimension, d f ), but also measures real-time clot formation time (time to the gel point, T GP ) [3]. Blood is a complex haemorheological system and hence fibrin-thrombin gels have been studied as simplified clot models to determine the individual effects of these two important molecules and their interaction on clot microstructure as measured by d f and T GP . Fibrin-thrombin gels have been studied as simplified clot models for more than 70 years [6]. Despite the technical difficulties at that time [7], the pioneering work of Ferry and Morrison based on fibrin-thrombin gels gave a greater insight in understanding the effects of fibrinogen and thrombin concentrations on the optical and mechanical properties of clots [6]. Their work showed that higher concentrations of fibrinogen, and to a lesser extent of thrombin, resulted in increased rigidity and opacity of the resultant clots. Subsequently, a countless number of studies used fibrin-thrombin gels to define the three-dimensional structure of fibrin clots and characterise their kinetic, viscoelastic and optical properties [8–11], which would have not been possible without the utilisation of these clot models. Hence, the aim of this study was to investigate the effects of different concentrations of fibrinogen and thrombin on the incipient clots of a fibrin-thrombin gel system.
Methods
Reagents and sample preparation
Purified, plasminogen-depleted Human fibrinogen and human-α-thrombin were obtained from Enzyme Research Laboratories Ltd, UK. The fibrinogen and thrombin were prepared as stock solutions of 44.44 mg/ml and 500 NIH/ml, respectively, by re-hydration as per manufacturer’s instructions then dispersed into small vials and frozen at –80°C. When required, fibrinogen and thrombin were removed from the –80°C freezer and allowed to thaw at room temperature. Thrombin was diluted to 50 NIH/ml using Tris Buffered Saline (TBS) solution (20 mM Tris, pH 7.4, and 0.9% NaCl, Sigma Aldrich, UK) before being placed “on ice” during sample preparation. Thrombin activity is expressed using National Institute of Health (NIH) units rather than true concentration. Thrombin activity at the time it was supplied by the manufacturer was certified at 500 NIH/ml, but it is important to note that thrombin activity falls rapidly at room temperature. To avoid this, samples were stored at –80°C until the day of the experiments and then placed on ice during sample preparation and only added to the final mixture seconds before loaded into the rheometer. To reduce surface tension during the experiment, 600μl of 1% Tween-TBS solution (prepared by adding 0.5 g of Tween®-20 to 49.5 g of TBS solution) was added to each sample. The appropriate amounts of TBS, Tween-TBS, fibrinogen, CaCl2 were mixed (in that order) in a universal container to give the required final concentrations of 8 mg/ml and 12 mg/ml fibrinogen and 0.005 M CaCl2. Thrombin was then added to initiate the gelation process at the required final concentration (0.02, 0.05, 0.1 NIH/ml). Experiments for each sample were repeated 3 times.
Instrumentation and rheological measurements
Rheological measurements of fibrin-thrombin gels were performed using a narrow gap double-wall concentric cylinder measuring geometry in a TA instruments ARES-G2 rheometer with a semi-automated loading procedure. A total of 5.1 ml fibrin-thrombin mixture was transferred to the ARES-G2 rheometer measuring geometry. A temperature of 24°C (±0.1°C) was maintained using a shell water bath system that encompassed the measuring geometry. After loading the sample, a pre-shear conditioning step was immediately activated at a shear rate of 100 s–1 for 10 seconds. Following the conditioning step small amplitude oscillatory shear measurements were performed sequentially with time at test frequencies of 3.2 Hz, 1.6 Hz, 0.8 Hz and 0.4 Hz at a strain of 20%. Using these measurements, the gel point (GP) was determined for each experiment. From the GP measurements, the fractal dimension, d f , of the incipient clot fibrin network is calculated alongside the time taken to form the incipient gel, T GP as has been previously described [17].
Statistical analysis
A two-way between groups ANOVA was conducted to evaluate the effects of various thrombin and fibrinogen concentrations on d f and T GP . Pearson correlation analysis was used to assess relationship between d f and T GP . Differences were assumed to be significant at p < 0.05. IBM SPSS® statistical software package version 22 and MS Excel 2016 were used to perform the analysis and prepare graphs.
Results
Figure 1 shows frequency sweep data for samples with 8 mg/ml fibrinogen and 0.1, 0.05 and 0.02 NIH/ml thrombin. At a concentration 0.1, 0.05 and 0.02 NIH/ml, d f was 1.68, 1.61 and 1.56 respectively. This is consistent with formation of a denser clot microstructure at higher thrombin concentrations.
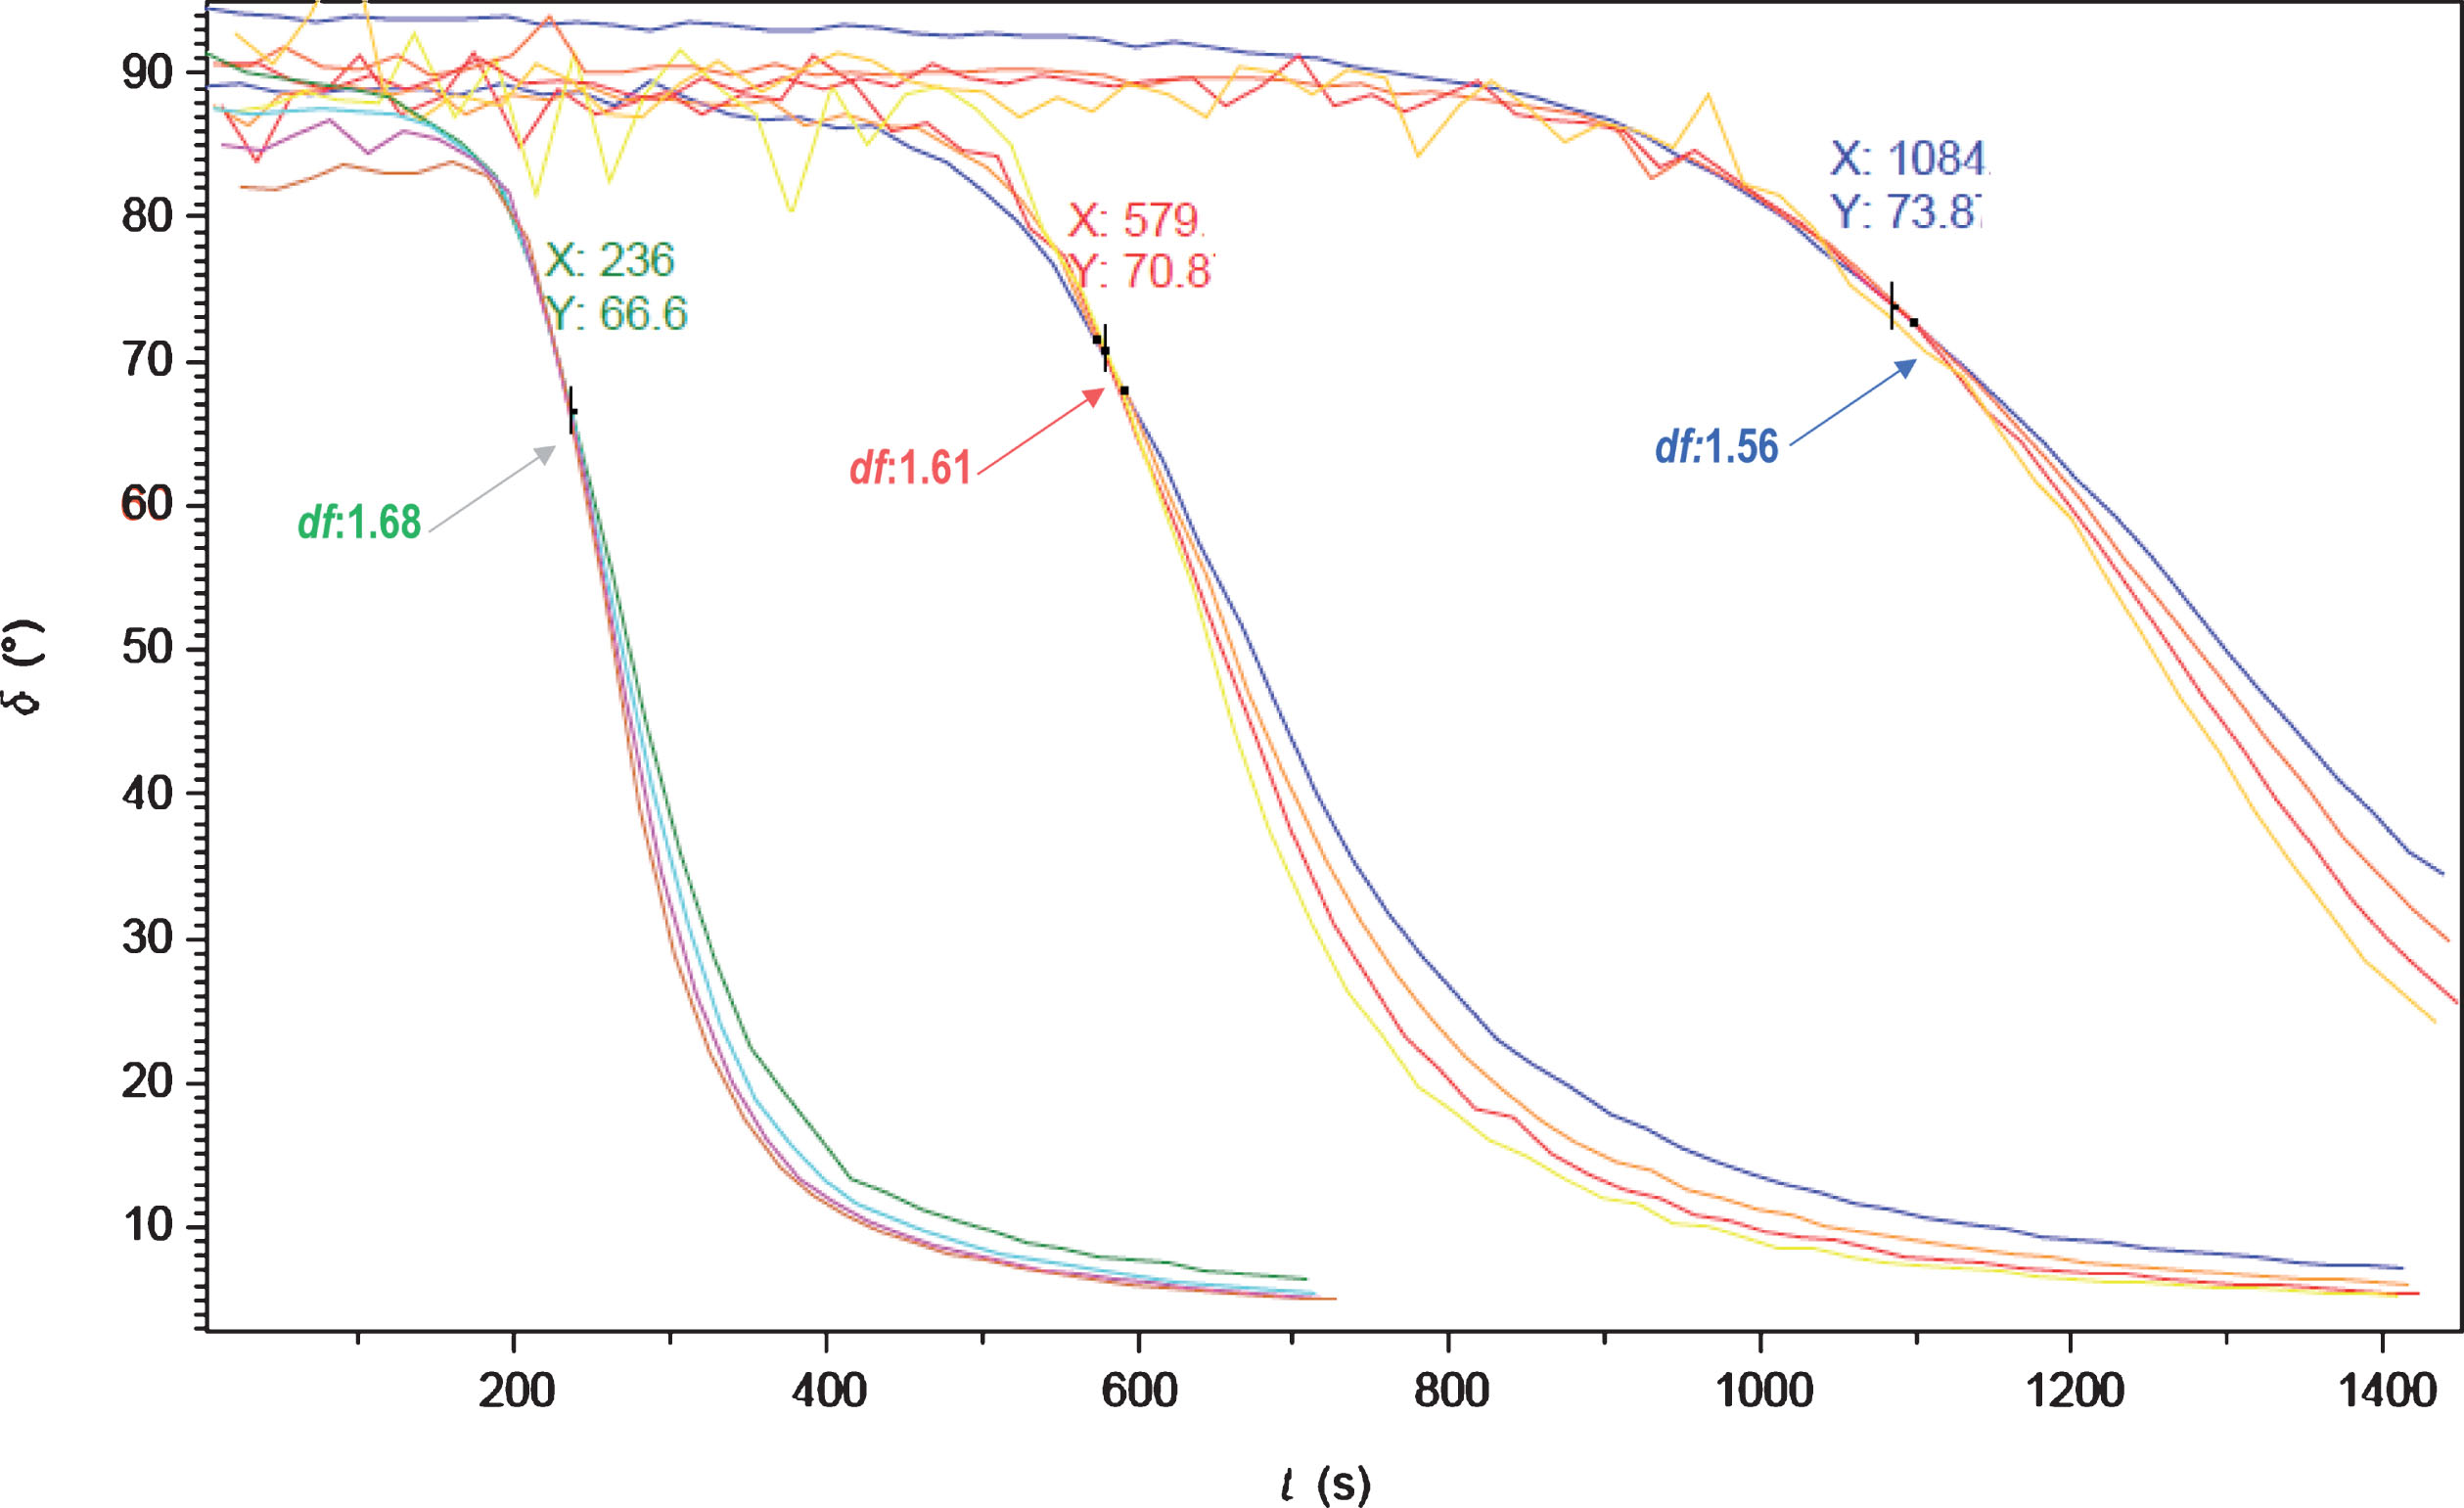
A graphical representation of frequency sweep experiment of 8 mg/ml fibrinogen with 0.1 (green), 0.05 (red) and 0.02 (blue) NIH thrombin. At concentrations 0.1, 0.05 and 0.02 NIH/ml, d f was 1.68, 1.61 and 1.56 respectively. This is consistent with denser clot microstructure at higher thrombin concentrations. X axis is time in seconds and Y is δ phase angle.
Descriptive results (mean and standard deviation) for all concentrations are summarized in Table 1 and graphical representations are shown in Figs. 2 and 3. There was an increase in d f with increasing concentrations of thrombin and fibrinogen indicating a stronger and more compact incipient clot. On the other hand, T GP was shorter with increasing concentrations of thrombin but surprisingly it is more prolonged with higher concentrations of fibrinogen as illustrated in Fig. 2. For example, at constant thrombin concentration of 0.02 NIH/ml, T GP at 12 mg/ml fibrinogen is almost doubled as compared to 8 mg/ml (2008±247 secs and 1089±265 secs respectively).
d f and T GP results based on varying concentrations of fibrinogen and thrombin
P < 0.0001 as detected by ANOVA, values reported as means and standard deviation.
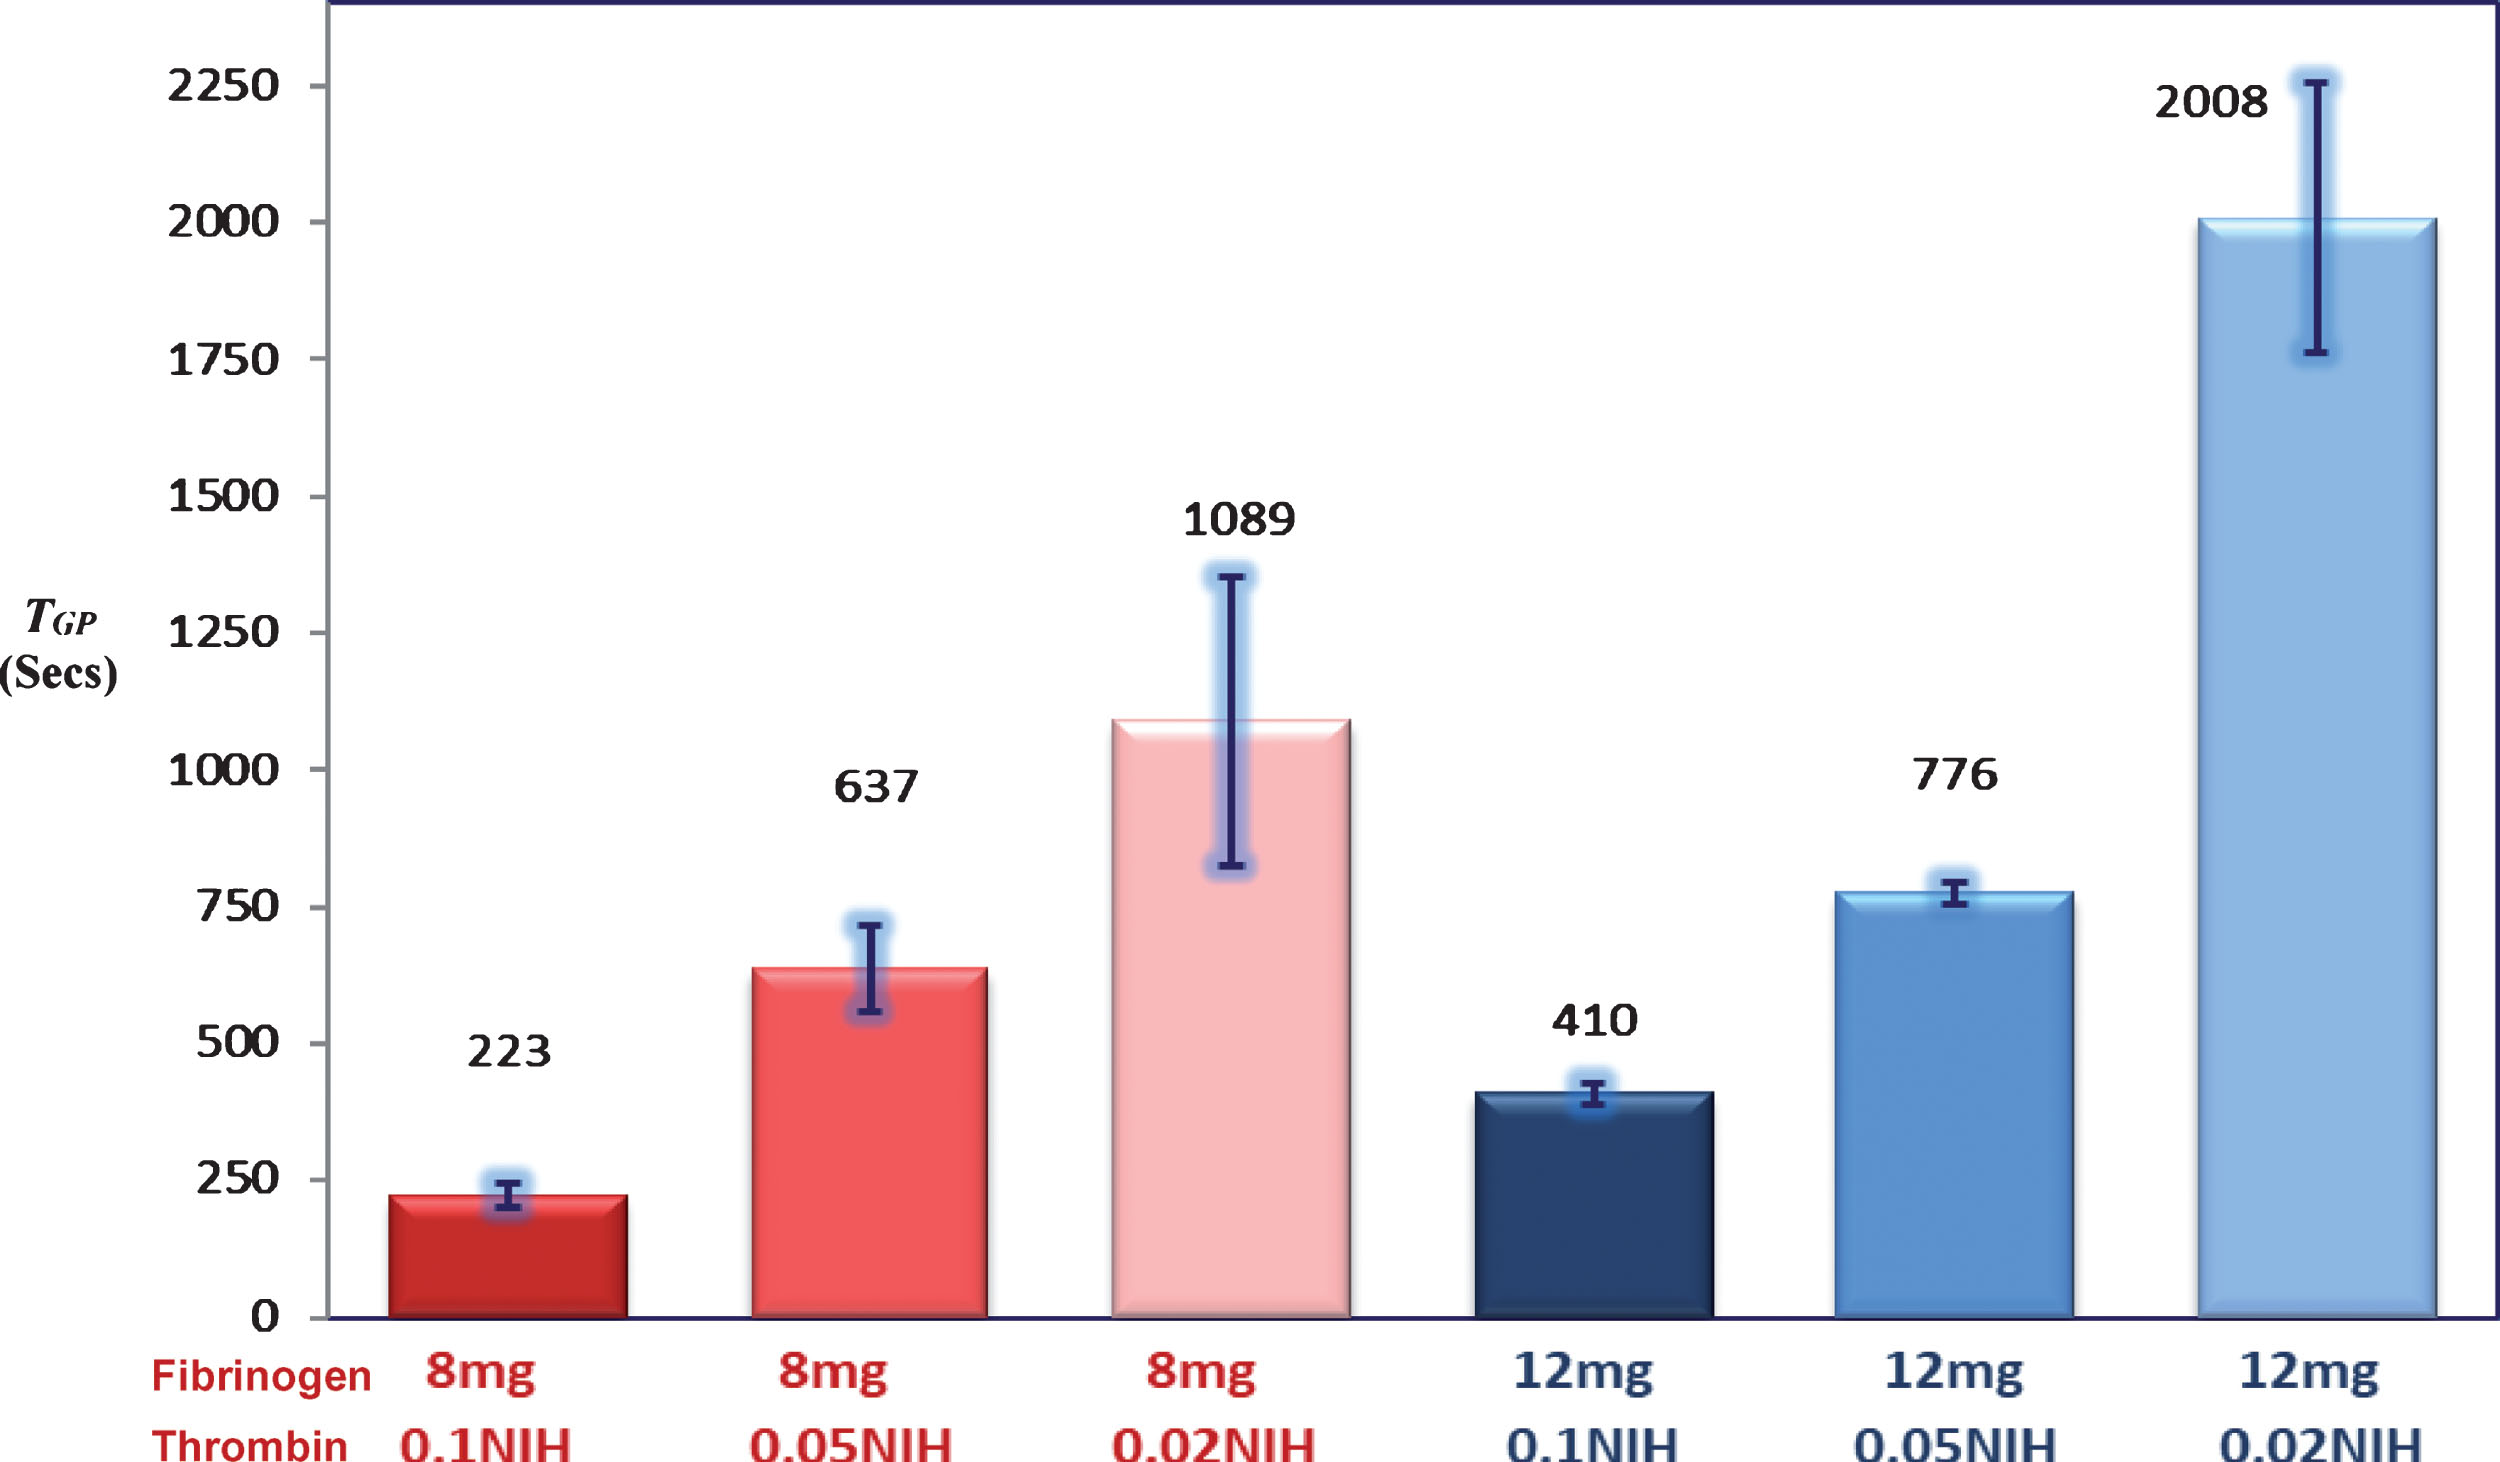
The effects of varying fibrinogen and thrombin concentrations on TGP (mean and standard deviation).
A two-way between groups ANOVA was conducted to explore the impact of varying thrombin and fibrinogen levels on d f and T GP . There was a statistically significant main effect for both fibrinogen [F(2, 12) = 66.95, P < 0.00001] and thrombin [F(1, 12) = 58.87, P < 0.00001] on d f with a large effect size for both variables (partial η2 = 0.85 and 0.91, respectively). For T GP , there was a similarly significant effect for fibrinogen [F(2, 12) = 33.5, P < 0.0001] and thrombin [F(1, 12) = 102.68, P < 0.00001] with a large effect size for both variables (partial eta squared = 0.74 and 0.95, respectively). Post-hoc comparisons using Tukey HSD test indicated that the mean d f and T GP values for all concentrations were significantly different from each other.
The correlations between T GP and d f
The relationship between d f and T GP was investigated using Pearson product-moment correlation coefficient. There was a strong, negative correlation between d f and T GP [r = –0.545, n = 18, p = 0.019], when analysing the whole set of results. This indicates increasing concentrations of thrombin is associated with high d f values (denser blood clot) but shorter T GP (clotting time). However, the correlation was even stronger when analysing the experiments with fibrinogen 12 mg [r = –0.986, n = 9, p < 0.00001] and 8 mg [r = –0.781, n = 9, p = 0.013] separately. This is again illustrating the effect of fibrinogen with regard to clotting time (i.e. T GP ), which is in contrast to thrombin is more prolonged with higher fibrinogen concentrations. Figure 4 illustrates this graphically showing two distinct regression lines for each fibrinogen concentrations.

The effects of fibrinogen and thrombin concentrations on d f (mean and standard deviation).
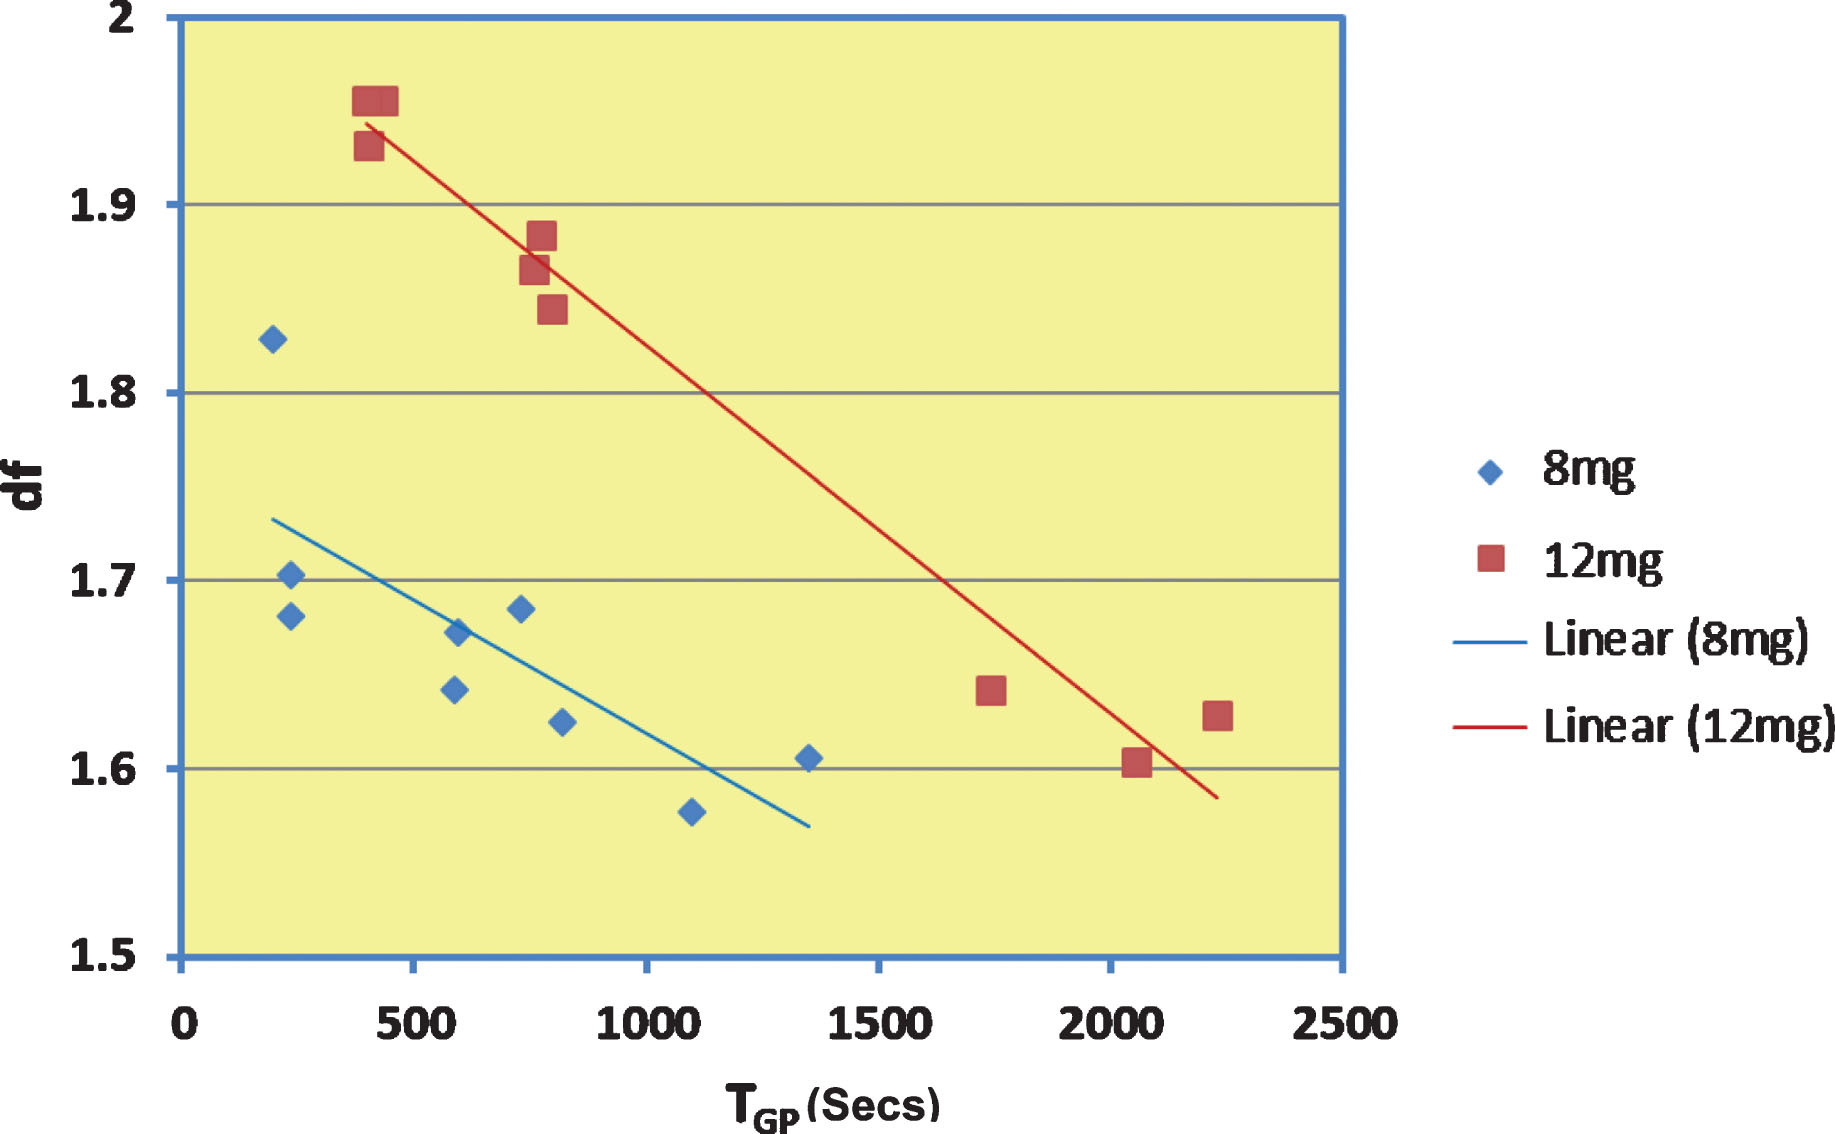
The correlation between TGP and d f withvarying fibrinogen and thrombin concentrations. This shows strong negative correlations. The blue values/lines are for 8 mg fibrinogen whereas the red are for 12 mg fibrinogen.
Fibrinogen is transformed into the insoluble fibrin network structure under the influence of thrombin. These two clotting factors are the most important molecules in maintaining normal haemostasis in living organisms. Using fibrin-thrombin gel modelling is the simplest way to study the interaction and effects of these two important clotting factors on clot microstructure. It has been reported in several studies that abnormal levels or structure of these factors are linked to a prothrombotic or haemorrhagic states [12–14]. The results from these experiments are consistent with what has been published in whole blood with the exception that higher levels of fibrinogen were associated with more prolonged gelation time reflecting an increased clot formation time. This is a very important observation that has to be explored in clinical studies and highlights the limitations of purely time-based coagulation tests, which may not always be appropriate to detect all types of coagulopathy. A recently published study that compared anticoagulated patients with Venous Thromboembolism (VTE) versus those with atrial fibrillation highlighted the limitations of time-based tests showing that patients with VTE have a more compact clot microstructure even though both groups had comparable INR values [2].
Fractal clusters formed by diffusion limited cluster–cluster aggregation (DLCCA) and reaction limited cluster–cluster aggregation (RLCCA) are reported to have higher d f values with slower aggregation [15, 16]. This indicates that higher d f values should be associated with increased T GP ; the additional time allows for more highly ramified structures to incorporate and form. However, this was not the case with whole blood [17] or fibrin-thrombin gels investigated in this study when manipulated by varying thrombin concentrations, which revealed opposite behaviour. An activation limited aggregation (ALA) mechanism has been proposed to explain the relationship between d f and T GP observed herein and in other works [11]. In ALA, an activation profile speed the formation of denser clots with relatively larger mass [11]. Therefore, it seems that the opposite results in regard with d f -T GP relationship noticed in this study could be explained by two different mechanisms. Varying concentrations of thrombin allow the fibrin-thrombin gel to behave in an ALA system mirroring whole blood clot formation. On the other hand, it behaves as DLCCA/ RLCCA system if we purely vary the concentrations of fibrinogen while thrombin is constant. This is an important observation revealing that fibrinogen behaves differently when independently manipulated. This may have clinical implications increasing the bleeding risks in patients with higher fibrinogen levels, if at any time the activation system fails resulting in longer time for a strong clot to form.
Limitations
This gelation model only included fibrinogen and thrombin. In the human body, coagulation is a very complex system consisting of multiple biochemical reactions. However, the purpose of this in-vitro study was to investigate a simple coagulation model before proceeding to more complex studies. The fact that fibrinogen, thrombin and temperatures were non-physiological is another limitation. This is due to rheometrical constraints and the fast rate of gelation, which is better controlled at lower temperatures. In contrast to the complex blood system, the model used in this study is a basic acellular system, which required higher fibrinogen for reproducible results. The fibrinogen and thrombin concentrations used are in the range described in previous studies [11, 18], which served the purpose of this study. As described above, thrombin concentrations are expressed as NIH activity units, which can be affected at room temperature. To avoid any inconsistencies, thrombin was stored appropriately, and all samples were prepared in the same manner. Hence, any reduction in thrombin activity will be proportional for all concentrations and experiments.
Conclusion
The findings from these experiments based on a fibrin-thrombin coagulation model are proof of concept that d f and T GP can detect changes in the incipient clot following manipulation of fibrinogen and thrombin concentration. It is reassuring that this technique confirmed d f , increases (indicating stronger clot) with higher concentrations of thrombin and fibrinogen. On the other hand, T GP decreased as expected with higher thrombin level but not with higher fibrinogen concentrations. This is an interesting observation that should be investigated further to check if it does translate to clinical studies.