
Abstract
BACKGROUND:
Hypotension and bradycardia are known side effects of general anesthesia, while little is known about further macro- and microhemodynamic changes during induction. Intriguing is furthermore, why some patients require no vasopressor medication to uphold mean arterial pressure, while others need vasopressor support.
OBJECTIVE:
Determination of macro- and microhemodynamic changes during induction of general anesthesia.
METHODS:
We enrolled 150 female adults scheduled for gynaecological surgery into this prospective observational, single-blinded trial. Besides routinely measuring heart rate (HR) and mean arterial blood pressure (MAP), the non-invasive technique of thoracic electrical bioimpedance was applied to measure cardiac output (CO), cardiac index (CI), stroke volume (SV), stroke volume variability (SVV) and index of myocardial contractility (ICON) before induction of anesthesia, 7 times during induction, and, finally, after surgery in the recovery room. Changes in microcirculation were assessed using sidestream dark field imaging to establish the perfused boundary region (PBR), a validated gauge of glycocalyx health. Comparisons were made with Friedman’s or Wilcoxon test for paired data, and with Mann-Whitney-U test for unpaired data, with post-hoc corrections for multiple measurements by the Holm-Bonferroni method.
RESULTS:
83 patients did not need vasopressor support, whereas 67 patients required therapy (norepinephrine, atropine or cafedrine/theodrenaline) to elevate MAP values to ≥70mmHg during induction, 54 of these receiving norepinephrine (NE) alone. Pre-interventional (basal) values of CO, CI, ICON, SV and SVV were all significantly lower in the group of patients later requiring NE (p < 0.04), whereas HR and MAP were identical for both groups. HR, MAP and CO decreased from baseline to 12 min after induction of general anesthesia in both the patients without and those with NE support. Heart rate decreased significantly by about 25% in both groups (–19 to –21 bpm). The median individual decrease of MAP amounted to –26.7% (19.7/33.3, p < 0.001) and –26.1% (11.6/33.2, p < 0.001), respectively, whereas for CO it was –40.7% (34.1/50.1, p < 0.001) and –43.5% (34.8/48.7). While these relative changes did not differ between the two groups, in absolute values there were significantly greater decreases in CO, CI, SV and ICON in the group requiring NE. Noteably, NE did not restore ICON or the other cardiac parameters to levels approaching those of the group without NE. PBR was measured in a total of 84 patients compiled from both groups, there being no intergroup differences. It increased 6.4% (p < 0.001) from pre-induction to the end of the operation, indicative of damage to microvascular glycocalyx.
CONCLUSION:
Non-invasive determination of CO provides additional hemodynamic information during anesthesia, showing that induction results in a significant decrease not only of MAP but also of CO and other cardiac factors at all timepoints compared to baseline values. The decrease of CO was greater than that of MAP and, in contrast to MAP, did not respond to NE. There was also no sign of a positive inotropic effect of NE in this situation. Support of MAP by NE must consequently result from an increase in peripheral arterial resistance, posing a risk for oxygen supply to tissue. In addition, general anesthesia and the operative stimulus lead to an impairment of the microcirculation.
Introduction
During induction of general anesthesia, development of hypotension is a familiar complication. Due to the negative influence of low mean arterial pressure (MAP) on organ perfusion and flow autoregulation, any decrease of MAP under 55–60 mmHg is often countered by quick pharmacological intervention with vasopressors [1]. The success of the intervention is judged solely on the basis of the attained level of MAP, tacitly presuming that normalization of MAP also implies normalization of cardiac output. However, precise data on frequency of occurrence and the time-course of change of MAP as well as of confounding cardiovascular and hemodynamic parameters such as cardiac output (CO) are sorely lacking, especially for the non-critically ill patient.
Actually, measuring CO would be paramount for evaluating the delivery of oxygen (DO2) to the tissue, since this function is described by the formula DO2 = CO×Hb×1.34×SaO2 (Hb = hemoglobin concentration, SO2 = arterial oxygen saturation of Hb). Another important relationship to be considered is that between MAP and CO, described by Darcy’s law: Taking central venous pressure (CVP) into account, then MAP - CVP = SVR×CO, where SVR = systemic vascular resistance [2]. Thus, MAP is strongly dependent on cardiac output and SVR, which is fundamentally determined by the tone of the arterial vessels. The effect of applying a pharmacological vasopressor, i.e., of raising SVR using medication like norepinephrine, may normalize MAP while masking a pronounced decrease in CO and, consequently, an infringement of oxygen delivery to the organs.
Despite its obvious relevance, cardiac output has rarely been monitored in conjunction with induction of general anesthesia, especially not in non-critically ill patients, as opposed to monitoring of blood pressure, a standard procedure. This is due in part to the considerable number of possible complications and the time and effort associated with implementing hitherto common methods of determining CO, like thermodilution, pulmonary artery catheterization, esophageal doppler or transesophageal echocardiography (TEE) [3, 4]. Clearly, by foregoing measurement of cardiac output it is not possible to detect and, thus, to treat possible decreases of CO.
Although there are some non-invasive methods available to measure CO, they have not been introduced into clinical routine for induction of general anesthesia. However, over the last years, protocols employing a new method based on thoracic electrical bioimpedance, called “electrical velocimetry” (EV), have evolved as a simple and reproducible, non-invasive alternative for the determination of aortic blood flow velocity and, therewith, of stroke volume on a beat-to-beat basis. This technique has been shown, in several studies, to measure CO with the same clinical accuracy as thermodilution and ultrasound methods (TEE) [5–8]. It was, therefore, tempting to test it.
Next to macrohemodynamic changes incurred during induction of general anesthesia, the microcirculation may be influenced. Confounders include changes in mean arterial pressure and cardiac output, use of vasopressors and fluid therapy. A likely target could be the endothelial glycocalyx (EG) which, in the last decade, has been identified as a structure coating nearly the total vascular system with a thickness of up to 1-2 μm [9, 10]. Together with soluble plasma proteins the EG forms the endothelial surface layer (ESL), the relevant interface between flowing blood and vascular endothelial cells which is responsible for vascular homeostasis. The ESL can be shed acutely in the course of inflammation, ischemia/reperfusion, hypervolemia and trauma [11–14]. Donati and colleagues were able to demonstrate shedding of the endothelial glycocalyx in vivo during sepsis by using an intravital microscope camera measuring the perfused boundary region (PBR), an indirect marker for the thickness of the EG/ESL [15].
Primary aim of the present prospective observational study was to establish the macrohemodynamic (blood pressure, cardiac output and dependent parameters such as cardiac index, stroke volume, stroke volume variability and index of cardiac contractility) and microhemodynamic (perfused boundary region) changes in female surgical patients of good cardiovascular health during induction and after the end of general anesthesia and surgery. Since our focus was on effects relating to general anesthesia, we did not discriminate among types of surgery.
On the basis of these measurements, three hypotheses were to be explored: Our first working hypothesis was that we could establish cardiac output as a pre-interventional marker of risk for developing arterial hypotension related to anesthesia. The second hypothesis was that induction of anesthesia further alters cardiac output and cardiac contractility. The third hypothesis to be addressed in the study was that patients prone to developing arterial hypotension in conjunction with anesthesia undergo changes in cardiac performance at a faster rate and/or to a greater extent than patients not in need of anti-hypotensive support.
Methods
The study was approved by the independent ethics committee of our institution (Ethics Committee of the Medical Faculty of the Ludwig-Maximilians-University Munich, Germany, trial registration no. 231-14). A total of 150 female patients undergoing gynecological surgery from 07/2014 to 10/2014 were enrolled in this study. All patients gave their written informed consent.
Anesthesia
Before transfer to the operating theatre, patients received oral anxiolytic premedication with midazolam. General anesthesia was then induced with sufentanil (plasma concentration 0,6 ng/ml), followed by propofol (plasma concentration 5 μg/ml) after adequate preoxygenation. Muscle relaxation was performed using cis-atracurium (0,2 mg/kg BW). Anesthestic drugs were applied via target controlled infusion (TCI, Fresenius Kabi, Bad Homburg, Germany), using the “Schnider model” to obtain comparable plasma and effect concentrations for each patient [16]. Intraoperative monitoring included end-tidal CO2, pulse oximetry, electrocardiogram and non-invasive blood pressure. According to the clinical standard, hemodynamic therapy with norepinephrine as vasopressor (or an alternative vasopressor, see Results) was given if mean arterial pressure was lower than 70 mmHg. Patients received either a bolus of norepinephrine or a bolus followed by continuous norepinephrine infusion. The anesthesiologist was blinded for macro- and microhemodynamic measurement.
Non-invasive cardiac output measurement
Cardiac output measurement was performed using the AESCULON™ monitor (Osypka Medical, Berlin, Germany and San Diego, CA, USA), which employs variations in thoracic electrical bioimpedance (TEB) resulting from changes in thoracic conductivity during the cardiac cycle to quantify the cardiac stroke volume. The principles of estimation of cardiac output and the algorithm are described elsewhere [17–19]. Four ECG electrodes (iSense EC Sensors, Osypka Medical, Berlin, Germany and San Diego, CA, USA) are placed at defined positions at the left side of the body, two at the base of the neck and two at the inferior aspect of the thorax in the midaxillary line at the level of the xiphoid process. Via two so-called “stimulating” electrodes, a high frequency (50 Hz) low amperage (2 mA) alternating current is applied across the left side of the body. The resulting voltage is registered by the two inner “sensing” electrodes, placed 5 cm below and above the stimulating electrodes, respectively. Changes in TEB are caused mainly by alternating orientation of the red blood cells (RBC) in the aorta during systole and diastole. During diastole the RBC in the aorta are situated in a random orientation, resulting in a lower conductivity. During systole RBC are aligned parallel to the blood flow and the applied external electrical current due to their disc-shaped bodies. This results in an increase in electrical conductivity and a decrease in impedance. These pulsatile TEB changes can be sensed by the electrodes. The AESCULON™ monitor uses the technology of Electrical Velocimetry™, which interprets the maximum rate of change of TEB as the ohmic equivalent of mean aortic flow velocity in the ascending aorta during left ventricular ejection. Stroke volume is calculated via the Bernstein-Osypka equation [17, 20].
Cardiac output (CO), stroke volume (SV), heart rate (HR), stroke volume variation (SVV, a surrogate indicator of cardiac preload responsivity) and the index of contractility (ICON) were calculated and recorded continuously during the period of measurement and documented in a standardized study observation form. Cardiac index (CI) was calculated on-line from CO and tables delivering body surface area (m2) on the basis of the individual’s body height and weight. The non-invasive mean arterial blood pressure (MAP) as a predictor of afterload was obtained from the anesthesia monitor (Dräger Infinity Delta XL, Dräger Medical, Lübeck, Germany) and documented. The detailed timepoints are shown in Fig. 1.
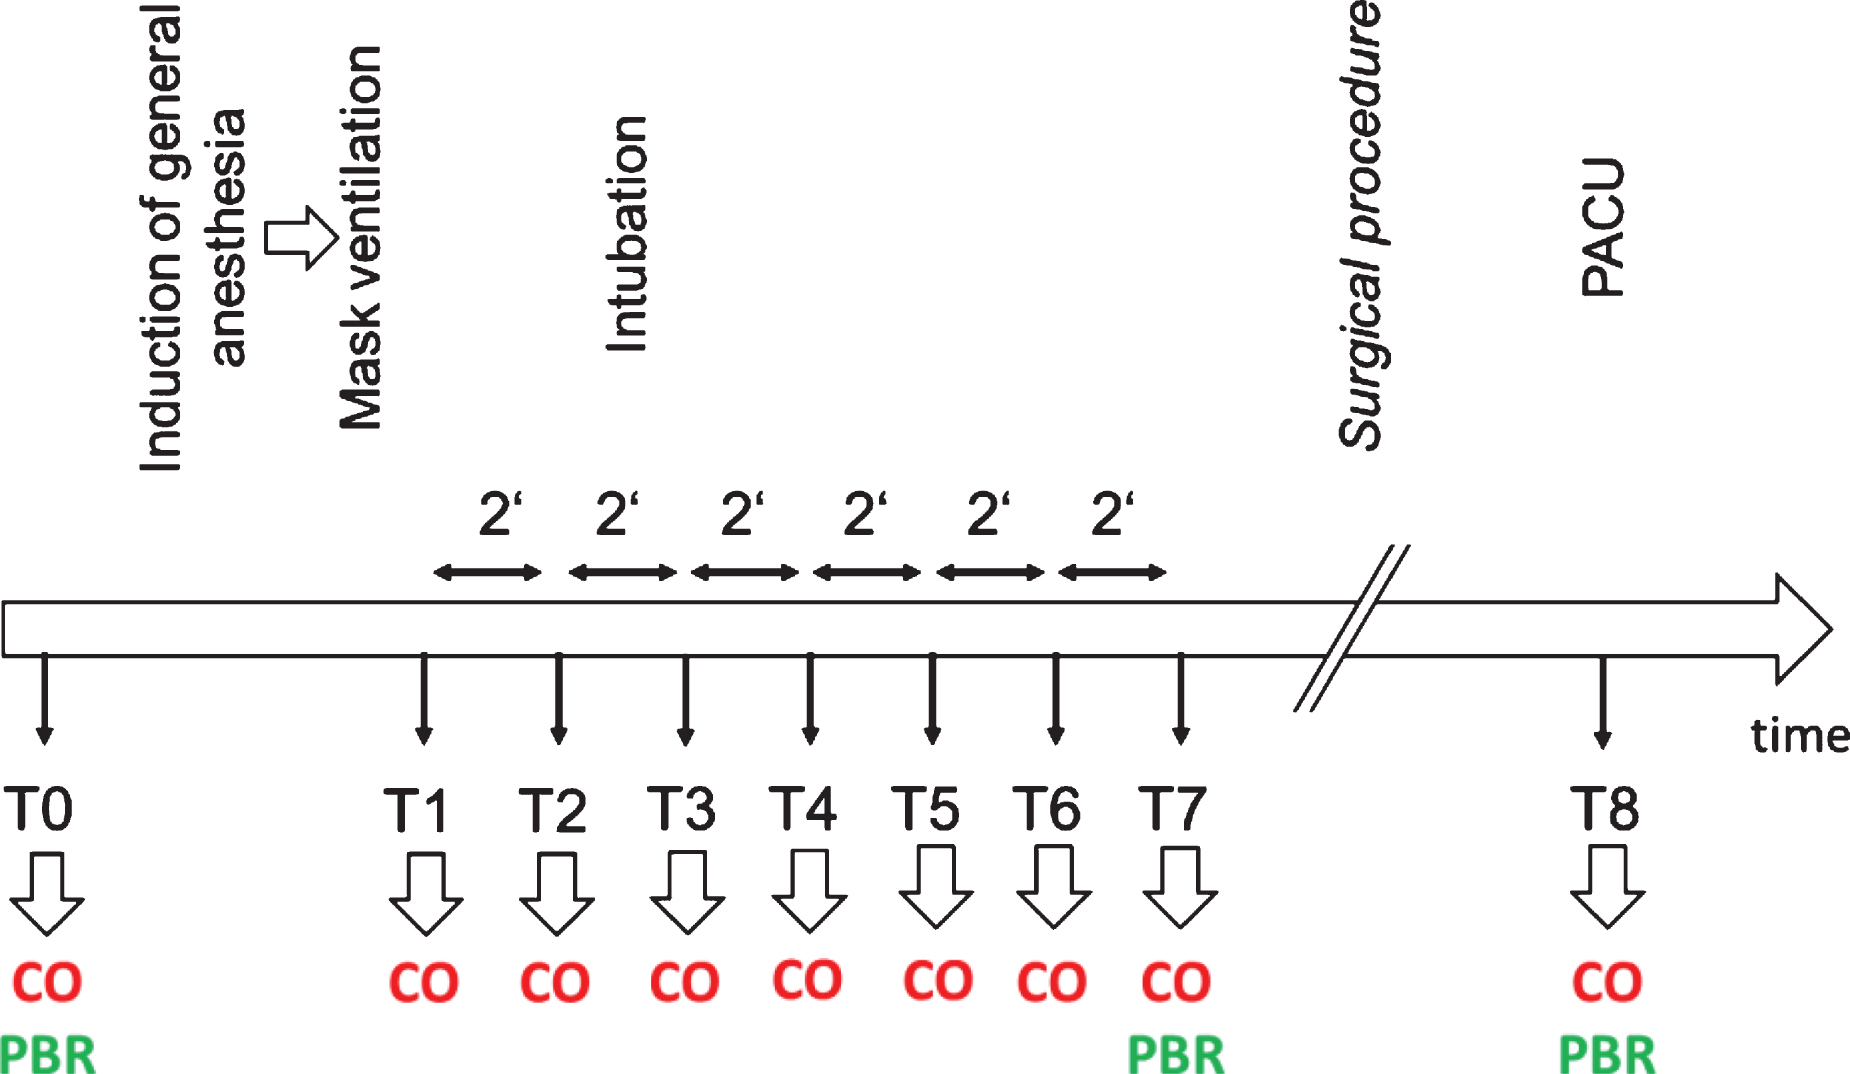
Study protocol. Figure 1 shows the timeline and timepoints of measurement. CO = measurement of macrohemodynamic parameters (cardiac output, stroke volume, heart rate and non-invasive blood pressure); PBR = measurement of the microhemodynamic parameter perfused boundary region; PACU = post-anesthesiological care unit.
Intra-vital microscopy to visualize the sublingual microvasculature was performed at bedside with a sidestream dark field (SDF) camera (MicroVision Medical Inc., Wallingford, PA) [21, 22]. The camera uses green light to detect hemoglobin of passing red blood cells (RBC), and obtains up to 840 measurements of the RBC column at one site. The images were automatically analysed by the GlycocheckTM software (Glycocheck BV, Maastricht, The Netherlands). This software establishes the lateral movement of the RBC into the endothelial glycocalyx, a physical parameter termed perfused boundary region (PBR, μm). Therefore, an intact endothelial glycocalyx is accorded a small PBR, because of a lower ability for RBC to penetrate the EG. Conversely, an increased PBR is to be expected should the RBC get into direct touch with the endothelial cells as a result of degradation of the endothelial glycocalyx [21]. The principle of deriving PBR is published elsewhere [15, 24]. Measurements of this parameter of microcirculation were performed before induction of general anesthesia (timepoint T0), 10–12 min after endotracheal intubation or placement of a laryngeal mask (timepoint T5-T7), and after the operation in the recovery room before admission to the patient’s ward (timepoint T8, see also Fig. 1).
Study protocol
Measurements of macro- and microhemodynamic parameters were obtained as shown in Fig. 1. Measurement was performed before induction of general anesthesia in the preoperative holding area (T0), and at timepoint T1, set at onset of tolerated controlled mask ventilation. The six 2-minute intervals following immediately upon T1, designated T2 to T7, were considered as the induction phase of anesthesia. Macrohemodynamic parameters were determined at each timepoint, microhemodynamic visualization and changes were established at T0 and once between T5 and T7. All measurements were again performed in the post-anesthesiologic care unit (PACU) (T8, Fig. 1).
The patients (n = 150) were divided, post hoc, into two groups: those who needed no intervention to maintain normal (>70mmHg) mean arterial blood pressure (n = 83), and those who required vasopressors (n = 67) to sustain a mean arterial blood pressure of at least 70 mmHg. Of the latter 67 patients, 13 received vasoactive drugs other than norepinephrine alone and were subsequently excluded from the study (see Results). The decision to use a vasopressor, or not, was drawn by the respective anesthesiologist in charge immediately after induction of anesthesia (timepoints T2–T3, Fig. 1). These persons were not involved in the study and blinded to cardiac output measurement.
Statistics
Data are presented as median and interquartile range (IQR) or 95% confidence interval. Hemodynamic data were normalized to basal values (T0 = 1) whenever comparisons between different parameters were to be investigated. Absolute values were used when investigating changes of a single parameter. For paired data, comparisons were made with Friedman’s test and Wilcoxon test, as appropriate. For unpaired data, comparisons were made with Mann-Whitney-U test. When indicated, post-hoc corrections for multiple measurements were performed using the Holm-Bonferroni method. Results from statistical tests were regarded as significant for p < 0.05 (IBM SPSS Statistics, Armonk, NY, USA and Microsoft Excel, Redmond, WA, USA).
Results
Patients’ details were: n = 150, age 48.0 years (38.8/62.3), weight 64.0 kg (58.0/75.8), height 165.0 cm (160.0/170.0), and ASA score 2 (ASA 1: n = 39, ASA 2: n = 96, ASA 3: n = 15). Of these patients, 83 required no intervention with vasopressors in order to maintain blood pressure > 70mmHg, 54 patients received norepinephrine, seven patients received cafedrin/theodrenaline, and two patients each atropine, norepinephrine plus atropine or norepinephrine plus cafedrin/theodrenaline. To avoid inhomogeneity, we excluded all 13 patients who received a hemodynamic therapy other than norepinephrine alone.
Macrohemodynamic parameters before anesthesia
Table 1 lists the values of the macrohemodynamic parameters as determined before anesthesia (basal timepoint T0) separately for the group later requiring no vasopressor intervention (n = 83) and the group later receiving solely norepinephrine during induction of anesthesia (n = 54). All parameters relating directly to cardiac performance, i.e., cardiac output (CO), cardiac index (CI), stroke volume (SV), stroke volume variability (SVV) and contractility index (ICON), differed significantly between the two groups. The values for CO, CI, SV and ICON were higher, that of SVV lower in the group, later not in need of vasopressor support (Table 1).
Absolute values of heart rate (HR), mean arterial pressure (MAP), cardiac output (CO), cardiac index (CI), stroke volume (SV), stroke volume variability (SVV) and index of contractility (ICON) prior to induction of general anesthesia (T0)
Absolute values of heart rate (HR), mean arterial pressure (MAP), cardiac output (CO), cardiac index (CI), stroke volume (SV), stroke volume variability (SVV) and index of contractility (ICON) prior to induction of general anesthesia (T0)
Furthermore, details are presented of relevant pre-existing morbidities and intake of cardiovascular drugs. The patients are separated into 2 groups, those later not requiring support of MAP by vasopressor (n = 83), and those receiving norepinephrine during induction (n = 54). Numerical data are median values with interquartile range, p = statistical probability of difference (Mann-Whitney U-test), * = p < 0.05.
Changes in heart rate, mean arterial blood pressure and cardiac output relative to their respective values before anesthesia (individual values at T0 set to the numerical value 1.00) are depicted in Fig. 2. All three parameters decreased significantly in all patients immediately upon induction of anesthesia, no matter whether the patients received therapy with vasopressor or not. In the case of HR, the maximum decrease was 25.6% (T7, no vasopressor) and 28.4% occurring at T8. Maximum decrease of MAP in the group without norepinephrine was 26.7% (19.7/33.3) and occurred at T7, and 26.1% (11.6/33.2) in the norepinephrine group, occurring at T2 (both p < 0.001 vs T0). Of note, there was a significant difference in MAP at T1 between both groups of patients: those who received norepinephrine presenting a lower MAP already at this earliest timepoint of induction of anesthesia. There was no significant difference between groups at later timepoints, i.e., when norepinephrine was being given, irrespective of whether the normalized (Fig. 2) or absolute values of MAP are regarded (Fig. 3A).
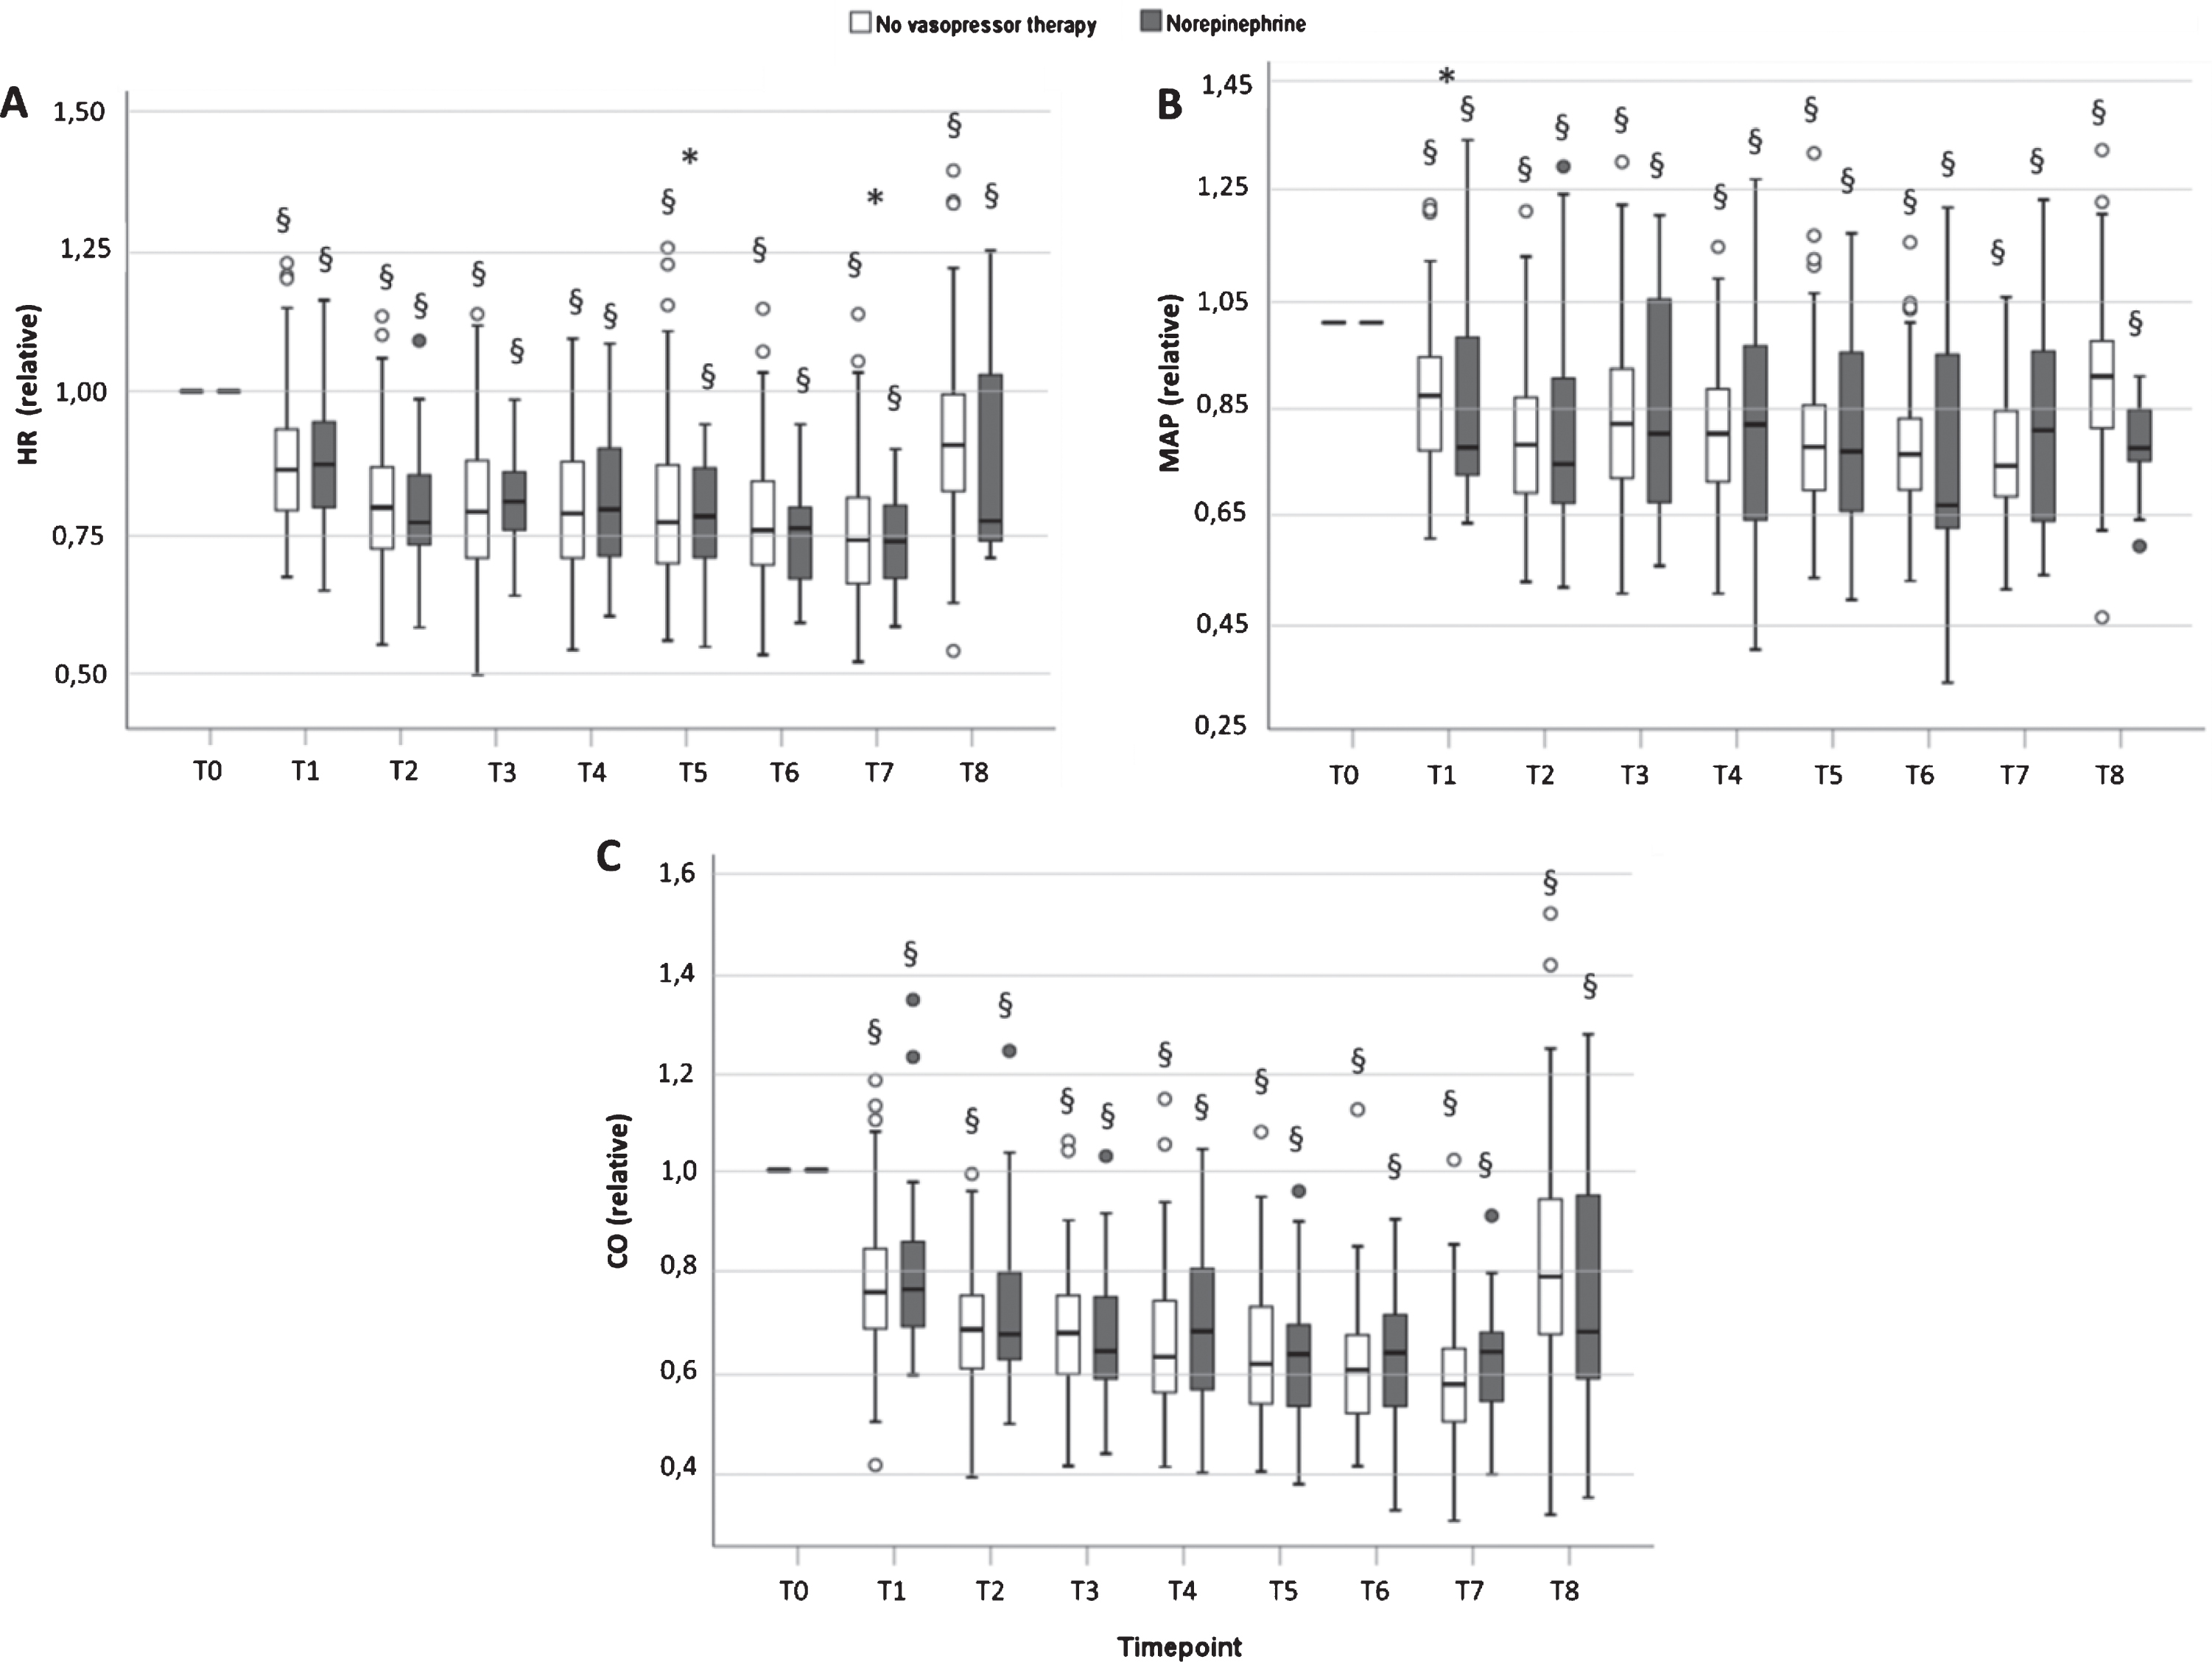
Relative changes of heart rate (HR, panel A), mean arterial pressure (MAP, panel B) and cardiac output (CO, panel C), normalized to the respective individual value at T0 (arbitrarily set to a value of 1.00). There is a significant difference of MAP between both groups directly after the start of induction of general anesthesia (T1, panel B, * = p < 0.05). All values from T1 to T8 are significantly lower than at T0 in both groups (§ = p < 0.001). Values are means +/– SD for n = 83 patients without need of vasopressor, and n = 54 patients receiving norepinephrine.
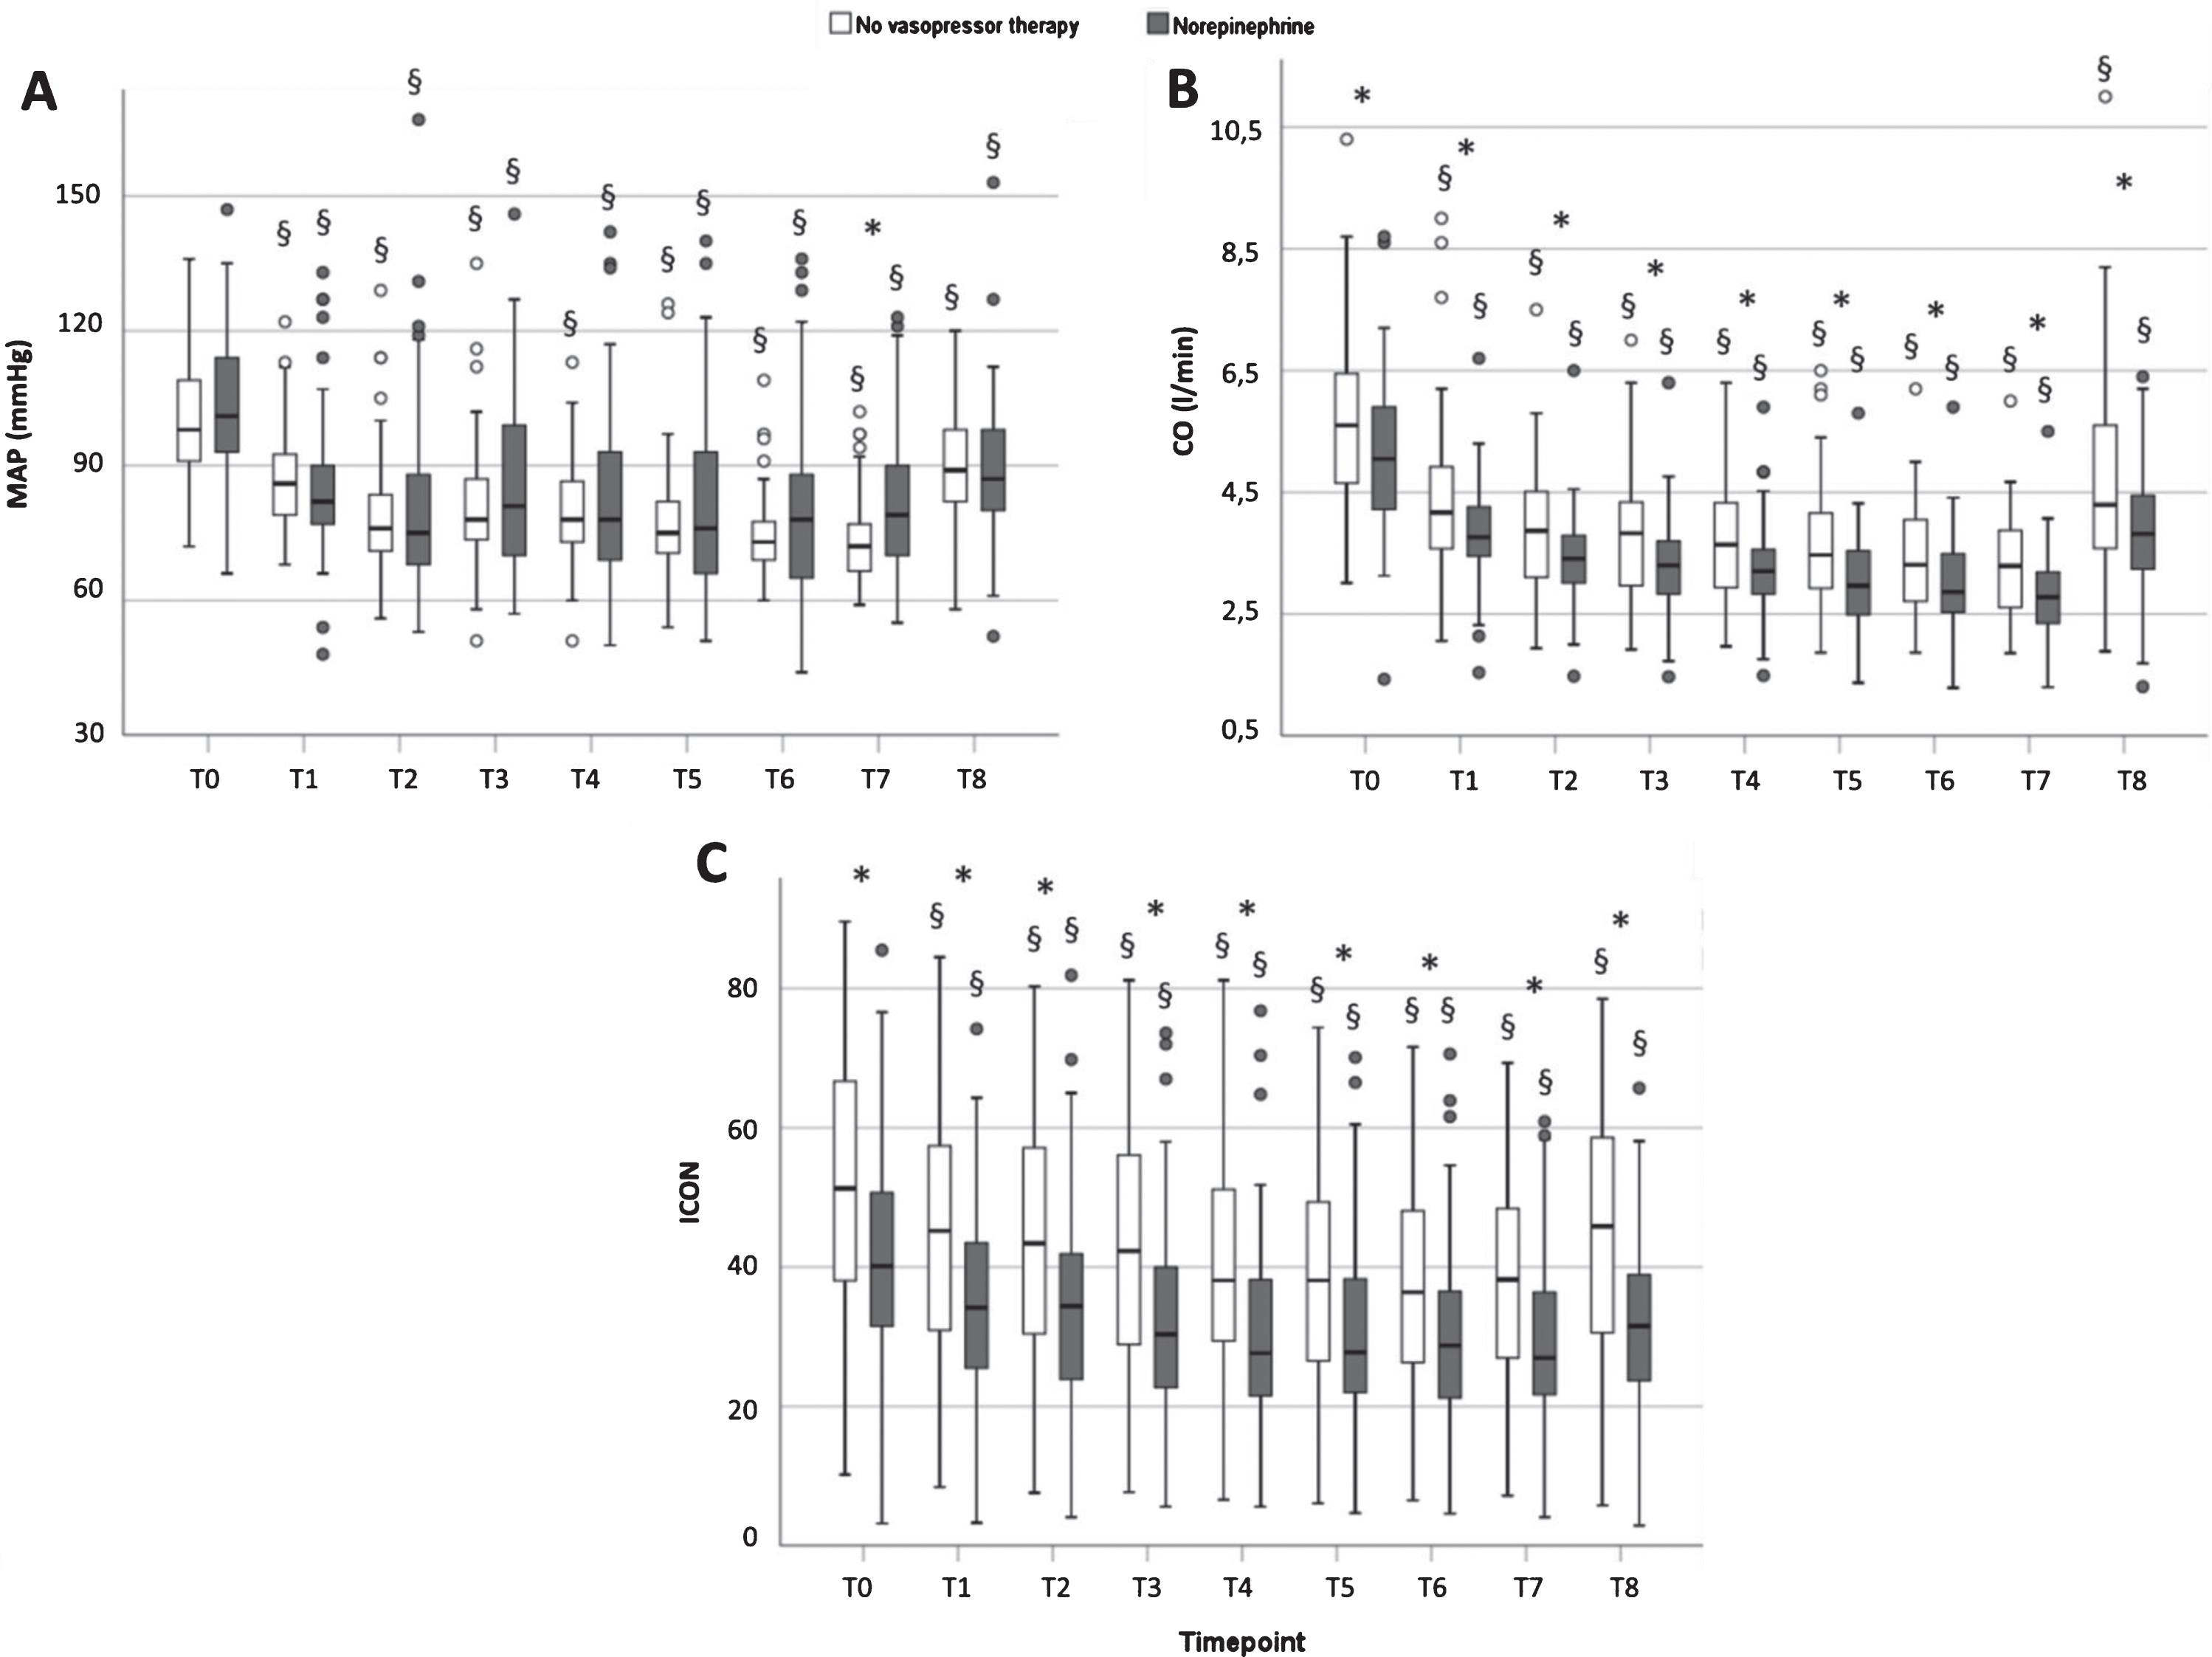
Absolute values of MAP (panel A), CO (panel B) and index of contractility (ICON, panel C) before, during induction of anesthesia, and post-intervention in the PACU. Data are box plots (medians with interquartile range and 95% confidence intervals); * = p < 0.05 for group difference no vasopressor therapy (83) vs norepinephrine (54); § = p < 0.01 vs basal (T0).
Concerning CO, maximum decrease vs T0 was 40.7% (34.1/50.1) at T7 in the group that received no vasopressors and 43.5% (34.8/48.7) at T7 in the group that received norepinephrine (p < 0.001 vs T0, both groups). Thus, there was a more pronounced decrease of CO than of MAP or HR in both groups. Although CO changed to a similar degree and at an identical rate in both groups when data was normalized to the pre-anesthetic level, this was not so for the absolute values. Figure 3B reveals that the absolute values of CO in the group requiring norepinephrine were consistently lower than those of the other group at each timepoint of measurement.
Whereas neither HR nor MAP exhibited significant changes from T2 to T7 in either group, and norepinephrine brought MAP up to the respective level of the patients without vasopressor, the CO continued to decline (Figs. 2 and 3). This occurred in both groups, i.e., irrespective of the administration of norepinephrine.
Figure 3C shows that also the index of contractility ICON behaved like CO, as did CI, SV and SVV (Fig. 4). Absolute values of cardiac index (CI), stroke volume (SV) and stroke volume variabiliy (SVV) decreased significantly from pre-operative values during induction of general anesthesia, not rising again until the post-operative phase (p < 0.001 for both groups, Fig. 4). While values for SVV did not differ between the groups beyond the timepoint T2, there were significant differences between both groups concerning the parameters CI and SV.In fact, CI and SV were consistently lower in the norepinephrine group at all times (Fig. 4).

Absolute values of cardiac index (CI, panel A), stroke volume (SV, panel B) and stroke volume variability (SVV, panel C) before, during induction of anesthesia, and post-intervention in the PACU. Data are box plots (medians with interquartile range and 95% confidence intervals); * = p < 0.05 for group difference no vasopressor therapy (83) vs norepinephrine (54); § = p < 0.01 vs basal (T0).
For all parameters, values determined in the post-operative anesthesiologic care unit (PACU, T8) were still significantly lower than the respective pre-operative values (T0 vs T8, both groups, p < 0.001, Figs. 2, 3 and 4).
Measurements of the perfused boundary region (PBR) were performed on a total of 84 patients (n = 49 without vasopressor intervention, n = 35 with norepinephrine support). Since there was no significant difference between groups at any timepoint of investigation (data not shown), the data of the 2 collectives were combined (Fig. 5). Over all, median PBR at baseline (T0) was 2.03 μm (1.89/2.21). There was no significant difference after induction of general anesthesia (p = 0.102). However, PBR had increased by about 6.4% at the end of surgery, rising significantly to a value of 2.15 μm (2.00/2.35) at T8 (p = 0.001, Fig. 5).

Panel A: Median absolute values of perfused boundary region (n = 84), T0 = before induction of general anesthesia, T7 = after induction of general anesthesia, T8 = at the post anesthesiologic care unit (PACU), * = significant difference (p < 0.01). Panel B: Intravital microscopic sublingual picture with sidestream darkfield technology. Panel C: Schematic illustration of perfused boundary region. EC = endothelial cell; E = redblood cell; EG = endothelial glycocalyx; PBR = perfused boundary region; RBC = red–blood-cell perfused lumen.
In the present prospective, single-blinded observational study, we focused on macro- and microhemodynamic changes during induction of general anesthesia. In this phase, attention is usually paid to one basic hemodynamic parameter: the arterial blood pressure. The routinely measured blood pressure is kept at an accepted mean level of > 70 mmHg by the anesthesiologist with the help of pharmacological vasopressors, abiding with the chief responsibilities of the anesthesiologist, i.e., maintaining homeostasis and sustaining oxygen transport.
In general, it is assumed that both macro- and microvascular blood flows are in normal, adequate ranges when heart rate and blood pressure are kept in normal ranges. However, to attain an intact microcirculation it is first of all necessary to provide an acceptable macrocirculatory condition and this requires both, adequate blood pressure and adequate flow of oxygenated blood from the heart [25]. Whilst blood pressure is easily measured non-invasively, the latter can best be judged by determining cardiac output. Unfortunately, changes in cardiac output during induction of general anesthesia are not monitored routinely and, thus, remain largely unexamined and uncontrolled. The invasive measuring techniques of CO available in the past have been reserved mostly for critically ill patients, i.e., situations in which undertaking method-related risks can be justified by the hoped-for gain in additional clinical information. This situation could now be changed with the advent of the technology of Electrical Velocimetry™, which interprets the maximum rate of change of thoracic electrical bioimpedance (TEB) as the ohmic equivalent of mean aortic flow velocity in the ascending aorta during left ventricular ejection. Stroke volume is calculated via the Bernstein-Osypka equation [17, 20]. The product of SV and the measured heart rate then yields cardiac output (CO). The beat-to-beat variability of SV (SVV) gives an impression of the susceptibility of SV to preload, largely determined by central venous pressure. The speed of systolic ejection serves as an index of myocardial contractility (ICON).
We applied the new, non-invasive TEB technique to establish whether cardiac output is affected by induction of general anesthesia and to elucidate why some surgical patients develop arterial hypotension during induction.
Unexpectedly, when pre-interventional data were compared for patients who did not develop arterial hypotension and those who later required vasopressor treatment during induction of general anesthesia,the latter group exhibited significantly reduced parameters of cardiac performance, while basal heart rate and basal mean arterial blood pressure were indistinguishable between the 2 groups (Table 1). Thus, low CO and also low cardiac index (CI) and index of contractility (ICON) prevailing before anesthesia predisposed towards development of hypotension, supporting our first study hypothesis.
Hopes that pre-interventional levels of CO, CI or ICON may serve as discriminators for predicting patients’ MAP response to anesthesia seem premature. The box-plots of the 3 parameters at T0 shown in Fig. 6 reveal considerable overlap of values between the two groups, despite clear and significant differences of the respective median values. The same holds true for SV and SVV (Table 1). Obviously, there must be some additional confounders of risk, perhaps to be found in the scope of pre-existing morbidities (hypertension, diabetes, cardiac insufficiency) and medication (beta-blockers, diuretics), as listed in Table 1.

Absolute values of CO (panel A), CI (panel B) and index of contractility (ICON, panel C) before induction of anesthesia (timepoint T0). Data are box plots (medians with interquartile range and 95% confidence intervals); * = p < 0.05 for group difference no vasopressor therapy (83) vs norepinephrine (54).
As a second major result of the present study, we found a significant decrease of cardiac output (and of CI, SV and ICON) at all timepoints compared to baseline values. Thus, induction of general anesthesia infringes cardiac function in non-critically ill patients undergoing surgery. Interestingly, at any given timepoint of measurement most values of all these parameters were significantly lower in the group of patients requiring norepinephrine, i.e., even during application of vasoconstrictor. These findings support the other two hypotheses of our study.
The further, third novel finding was that application of the vasopressor norepinephrine “normalized” MAP some 4–6 min after induction, but did not prevent the continuous declines in CO, CI, SV, SVV and ICON induced by onset of anesthesia in both groups of patients or even equalize them to the same level for both groups. This result is very important: Put into the context of Darcy’s law, it means that elevated systemic vascular resistance accounts for the norepinephrine induced rise in MAP of patients developing hypotension at the onset [2].
Absolute values of mean arterial pressure (MAP), cardiac output (CO), contractility index (ICON), stroke volume (SV), stroke volume variability (SVV) and heart rate (HR) at different timepoints (T0-T8)
Parameters are displayed in 2 groups, those later not requiring support of MAP by vasopressor (n = 83), and those receiving norepinephrine during induction (n = 54, subscripted NE). Numerical data are median values with interquartile range, p = statistical probability of difference (Wilcoxon-Rank-Test), n.a. = not applicable.
Elevation of peripheral vascular resistance as caused by norepinephrine is known to be based on arteriolar vasoconstriction. Continuously falling CO in conjunction with rising peripheral arteriolar vasoconstriction (to offset a loss of blood pressure) dramatically enhances the risk of microvascular flow disturbances, leading to regional or even generalized tissue hypoxia. For example, Dubin et al. have previously reported that patients with septic shock showed severe microcirculatory alterations that failed to improve with increases in MAP brought about by norepinephrine [26].
The final path of oxygen delivery to tissue is via the microcirculation [27]. To assess the patency of this conduit, we determined the perfused boundary region of sublingual microvessels. The PBR describes how far red blood cells can approach toward the endothelial cell surface away from the axial stream. This movement is impeded by an intact endothelial glycocalyx – in vivo better described as an endothelial surface layer (ESL) – and the PBR of sublingual vessels has been established as a valid marker of microvascular disturbance [28, 29]. Today, there is broad evidence for the impact of the endothelial surface layer on microvascular homeostasis and flow distribution [30]. To detect potential changes of the endothelial surface layer, we evaluated changes of PBR during induction of general anesthesia and again at the end of the respective surgical procedures. Though there was a numerical (5%) increase for PBR from baseline to after 10–12 min of induction of anesthesia, this alteration was not statistically significant. However, post-operatively PBR had increased by 6.4% (p = 0.001 vs basal). This is indicative of a deeper penetration of red blood cells into the ESL. Such a thinning or shedding of the ESL is known to develop as a result of extended hypoxia, among numerous other causes [14, 31]. Thus, these results obtained for PBR in our study substantiate the above made assumption that falling CO in the face of increasing peripheral arterial resistance critically infringes systemic tissue oxygenation, at least in some patients. This process starts during induction of anesthesia and progresses at least into the recovery room phase, well after the end of surgical interventions.
Interestingly, in the present study, relative changes of the heart rate were similar to changes of the MAP, only without a significant difference between groups directly after induction. A new finding, especially because it applies to patients who were mostly in good cardiovascular health, is that the decrease of CO was much more extensive than the decrease of MAP (median maximum decrease of CO 42.7% vs. MAP 26.4%). Another feature meriting attention was the kinetic of decrease of CO. This did not follow either the heart rate or mean arterial pressure. Furthermore, in absolute values, CO was slightly lower in the group who needed vasopressor than in the group without NE at all timepoints.
These facts, together with many of the aforementioned novel findings, lead to several questions: Do we treat mean arterial pressure at the cost of cardiac output? Should we use other vaso/cardioactive drugs in addition to or instead of NE to increase also cardiac output?
Since the work of Finnerty et al. and Harmsen et al., we know ofthe necessity to avoid hypotension to protect the brain [32, 33]. However, the target blood pressure is individual for each patient, depending, among other factors, on gender, age and preexistent arterial hypertension. More difficult is judging cardiac output, where we don’t know if the CO must be kept in narrow boundaries, even in patients without cardiovascular diseases. The decision to treat the CO leads to the next question: How should this be done?
At least in experimental hemorrhagic shock, norepinephrine is able to improve dynamic preload variables, most likely by shifting blood from “unstressed” to “stressed” volume [34]. In theory, under minimal sympathetic nervous tone, some 60% of total blood volume is hemodynamically inactive and constitutes a blood volume reserve (“unstressed volume”). Venoconstriction induced by activation of the sympathetic nervous system can recruit unstressed to the stressed volume, augmenting the hemodynamically active blood volume [35]. Pertinently, we found some significant differences in the decreases of stroke volume and stroke volume variability between groups when the absolute values were compared. However, SVV tended to be higher in patients requiring support of blood pressure only at the onset of observation (T0-T2), with no difference between groups at later timepoints of treatment with norepinephrine (Fig. 4). Since a fall in SVV indicates less reliance of heart performance on preload, this finding does not really support a marked benefit gained from norepinephrine–induced venoconstriction under the conditions of our study.
Another result was that myocardial contractility (reflected by the parameter ICON) was higher at every timepoint in the group which needed no vasopressor therapy than in the vasopressor group, when considering absolute values (cf. Fig. 3). Potentially, a lower preoperative contractility could be a major risk factor indicative of an intraoperative requirement of norepinephrine. However, according to our data, application of NE failed to elevate ICON to levels approaching those of the group without noradrenergic augmentation (Fig. 3). This surprises, because a positive inotropic action via beta-adrenoceptors should be expected upon infusion of NE. Part of the discrepancy could be owing to differences in the respective comorbidities, e.g., the fact that the NE group comprised more patients with arterial hypertension (23 vs 7) and, consequently, a higher incidence of medication with beta-blockers (11 vs 2, Table 1).
In view of the unexpectedly, but uniformly poor responses of the parameters CO, CI, ICON, SV and SVV to norepinephrine infusion, as opposed to the marked action on systemic vascular resistance, one may consider testing epinephrine instead to enhance cardiac performance during induction of general anesthesia. Epinephrine has greater pharmacologic action on beta-adrenoceptors and less on alpha-adrenoceptors than norepinephrine.
The present study has some limitations due to its design, being a prospective, observational, single-blinded study, and not a prospective, interventional study. For example, the vasopressor therapy was not standardized, some patients receiving atropine or cafedrine/theodrenaline, or combinations of these with norepinephrine. This necessitated exclusion of some patients. Second, we employed only one method to evaluate macrohemodynamic changes. Consequently, we cannot compare the measured values and test for reliability, but this was not aim of the study anyway. After all, the adopted method of electrical velocimetry was tested afore in several clinical studies [5–8, 17–20]. Third, because of mask ventilation during induction of general anesthesia, pressure and tidal volume are not standardized. Thus, some parameters, especially SVV, may present with greater scatter.
Summary and conclusions
The present study provides, for the first time, data concerning cardiac output during induction of general anesthesia in patients with good cardiovascular health using electrical velocimetry. Induction causes a significant (within minutes) decrease of CO and related parameters of cardiac function. The magnitude of the reduction of CO (about –45% vs pre-interventional value) exceeded the familiar drop in mean arterial pressure (approx. –25%) in those patients able to maintain adequate MAP of > 70 mmHg following induction. Patients needing vasopressor norepinephrine to sustain MAP experienced the same percentage fall in CO, but presented a significantly lower absolute CO already prior to induction. Likewise, pre-interventional cardiac index, stroke volume, stroke volume variability and cardiac contractility differed between both groups. These are novel and unexpected findings. Low values of CO, CI, SV, SVV and ICON thus pose as risk factors for the development of arterial hypotension during induction of anesthesia. The vasopressor effect of norepinephrine is based mainly on elevation of peripheral vascular resistance and not on positive inotropic action. Increased vascular resistance combined with reduced CO leads to systemic microvascular malperfusion, as evidenced by an increase in perfused boundary region of sublingual microvessels following induction of anesthesia and surgery. Pharmacological interventions with drugs other than with norepinephrine should be sought to remedy both, the fall in MAP and the fall in CO brought about by induction of anesthesia, without stimulating peripheral arterial resistance.