
Abstract
BACKGROUND:
Doxorubicin is a cytostatic drug from the group of anthracycline antibiotics that is widely used as a chemotherapeutic agent. Side effects of the active substance include cardiotoxicity and nephrotoxicity. Doxorubicin-treated renal epithelial cells and (sarcoma) tumors are examined by correlative light and electron microscopy (CLEM) to investigate the subcellular localization of doxorubicin.
METHODS:
The kidney epithelial cell line MDCK II (Madin-Darby Canine Kidney) grown on culture dishes were treated with doxorubicin. Subsequently, the cells are analyzed by means of fluorescence and transmission electron microscopy (TEM). In vivo, alveolar rhabdomyosarcoma (RH 30) tumor cells are transferred to the chorioallantoic membrane (CAM) of the chicken embryo. Doxorubicin is injected into a vein of the chicken embryo. After 24 hours, the tumor is removed and examined using CLEM.
RESULTS:
The kidney epithelial cells and the doxorubicin-injected tumors show a clear staining of the cell nucleus, which correlates with electron-dense regions (heterochromatin). High-resolution TEM shows that doxorubicin treatment leads to an enormous stress situation with an increased formation of membrane blebbings.
CONCLUSIONS:
CLEM is a promising new method to visualize the pattern of fluorescing drugs (e.g. doxorubicin) in renal epithelial cells and tumors, and to localize the drug in its subcellular context combined with high resolution.
Keywords
Introduction
Since pioneers of microscopy like Antoni van Leeuwenhoek started investigating biological structures in the 17th century, the angular resolution has been restricted by the diffraction limit of visible light. Nowadays super-resolution techniques have achieved resolutions below 50 nm down to a macromolecular level [1–3]. Super-resolution methods are based either on exploitation of shaped illumination beams or utilize stochastic or photoactivated switching of fluorophores. Various super-resolution techniques have been developed. (i) Single molecule localization microscopy (SMLM) uses photoswitchable fluorescent probes. Isolated emitters are repeatedly localized and a super-resolution image is built from these single-molecule localizations [4]. (ii) Structured illumination microscopy (SIM) is a widefield microscopy technique that uses the Moiré effect to double the spatial resolution [5]. (iii) In stimulated emission depletion (STED) microscopy, fluorophores are selectively repulsed, which minimizes the area of illumination at the focal point and allows an enhancement of the resolution according to the intensity of the STED-pulse [2]. (iv) In expansion microscopy (ExM), the whole structure of interest is expanded using a polymer system and imaged using conventional fluorescence microscopy (FM) [6]. However, FM only visualizes fluorescent labels but the underlying cellular structures remain in the dark. The great advantage of electron microscopy (EM) is the revelation of cellular ultrastructures, membrane shapes, and organelle architecture. Nevertheless, the ultrastructural analysis is restricted to grayscale images [7, 8]. Structures that have not yet been morphologically described or related similar structures are hard to distinguish [9]. Additionally, in most applications, biological samples for EM are in a fixed and dehydrated state. The restraints of the two separate imaging modalities can be overcome by using correlative light and electron microscopy (CLEM). CLEM is the combination of (light)/fluorescence microscopy and EM. Therefore, CLEM techniques incorporate the labelling power of fluorescence imaging and the ultrastructural information provided by electron microscopy into one system [10].
While the fluorescence microscopy has the capacity to mark the regions of interest, the electron microscopy provides high-resolution information down to the nano-scale and allows the identification of the underlying structures of the fluorescent labels. Some CLEM techniques have achieved an unprecedented precision (<100 nm) for the localization of fluorescent dyes at an ultrastructural level [9, 11].
There is a plethora of different protocols and procedures on how to combine light and electron microscopy for CLEM [12, 13]. The different CLEM methods can be classified depending on when the FM micrographs are recorded, i.e. before (pre-embedding) or after the sample preparation (post-embedding) for EM. If FM is performed before embedding, there is a short time delay until the samples are fixed [14]. The main drawback of pre-embedding CLEM is that in the time between FM and EM measurements the observed structures may change due to processes and movements within the living cell, or may be altered by the subsequent EM-required embedding steps [15]. Post-embedding CLEM can be either performed on the entire embedded block using confocal microscopy or on sections suitable for EM. It has been shown that synthetic fluorophores maintain their fluorescence better in the presence of uranyl acetate than in cells or tissues which were treated with OsO4 [16]. Compared to pre-embedding CLEM, FM imaging of sections is much more difficult because some fluorescence is always lost and the embedding resin can show some autofluorescence (i.e. Epon). However, the main advantage of post-embedding imaging is that during FM and EM the sample is not further manipulated and thus, the region of interest can be re-localized [15]. In summary, the sample preparation procedure is the fundamental step to keep a stable fluorescence signal and at the same time not to destroy the ultrastructure of the samples [17].
During the last years, CLEM has gained popularity within the field of cancer research as it is an important tool to gain new insights into transient events of the disease process [18–20]. Doxorubicin, a cytostatic agent from the group of anthracycline antibiotics, is widely used as a chemotherapeutic agent for cancer treatment [21]. The effect of doxorubicin is based on its intercalation in the DNA and its poisonous effect on topoisomerase II. The most dangerous side effects of the drug include cardiotoxicity and nephrotoxicity [22, 23]. Recently, Yang et al. showed that doxorubicin induces double strand breaks preferentially around active promoters. They propose that intercalation of anthracyclines enhance nucleosome turnover in a torsion-based manner, which exposes promoter DNA and increases the probability of strand breaks [24]. The big advantage of doxorubicin is its fluorescent property, which can be used to track the cytostatic pathway and to study the release of doxorubicin from the cell. CLEM is the perfect tool to precisely visualize the subcellular localization of doxorubicin and its effects on the ultrastructure of treated cells and tissues. Unfortunately, so far, there is no prediction about the efficacy of the drug, the development of possible resistances and the subcellular sequestration of the chemotherapy.
Here, we discuss the use of post-embedding CLEM for the visualization and subcellular localization of a chemotherapeutic (i.e. doxorubicin) after treatment of cells and tumor tissue. For the first time, we apply this CLEM method on a tumor grown in the in vivo chorioallantoic membrane (CAM) model. The innovative CLEM technique focuses on the preservation of the fluorescence ability of doxorubicin throughout the preparation and imaging methodology in order to precisely localize the dye on electron microscopic micrographs.
Methods
Cell culture
MDCK II (Madin-Darby Canine Kidney) obtained from R. Thünauer, Albert-Ludwigs-Universität Freiburg, were grown in DMEM high glucose (Sigma-Aldrich, Taufkirchen, Germany) containing 5% FCS (BioWest, Nuaillé, France), at 37°C and 5% CO2. The cultures were sub-cultured twice per week. Cells were densely grown in culture dishes and then treated for 30 min with 2 mg/ml DOXO-cell® (Stada Arzneimittel AG, Bad Vilbel, Germany). Afterwards the cells were washed twice with PBS and harvested with a cell scraper. Subsequently, cells were centrifuged for 5 min at 300 g and prepared for fluorescence and electron microscopy.
Alveolar rhabdomyosarcoma (ARMS) cells with a PAX3-FOXO1 translocation (RH 30) (from DSMZ (German Collection of Microorganisms and Cell Cultures GmbH, Braunschweig, Germany)) were cultivated in RPMI medium (Sigma-Aldrich, Taufkirchen, Germany) containing 10% FCS at 37°C and 5% CO2 and passaged twice per week. For tumor inoculation, cells were harvested and counted in a Neubauer counting chamber. For the work with the human cell line, no approval from an Ethics Committee was required.
Tumors on the chorioallantoic membrane (CAM) model
The CAM assay was performed as described elsewhere [25, 26]. In brief, fertilized eggs were incubated for four days in a ProCon egg incubator (Grumbach, Asslar, Germany) at 37.8°C and 63% humidity. The whole procedure of the CAM model is shown in Fig. 3A. A window was cut into the eggshell to make the CAM accessible and was sealed with tape again for further incubation of the eggs. On the ninth day, 1×10⁶ of the human ARMS cells (RH 30) mixed with Corning® Matrigel® (Fisher Scientific GmbH, Schwerte, Germany) in a 1:2 ratio were placed in a plastic ring, which was removed after 24 h, on the CAM. To investigate grown tumors in ovo and ex ovo the digital VHX-5000 microscope was used (Keyence, Neu-Isenburg, Germany) (Fig. 3B, C). On day 17, 500μl DOXO-cell® 0.2 mg/ml were injected into a vein of the chorion (Fig. 3D, E). After 24 h, the tumors were explanted. Fluorescence signal of the explanted tumors was analyzed by FM (Fig. 4A, B). Tumor samples with positive fluorescence signal were prepared and fixed for CLEM as described below.
Sample preparation
MDCK II cells and tumors were fixed with a solution containing 1% glutaraldehyde, 4% paraformaldehyde and 2 mM CaCl2 in 0.1 M sodium cacodylate buffer (pH 7.4) for 30 min at room temperature and for four days at 4°C, respectively. After three washes with 0.1 M sodium cacodylate buffer (pH 7.4), samples were postfixed for 30 min with 0.1% osmium tetroxide in 0.1 M sodium cacodylate buffer. Thereafter, the specimens were washed five times with 0.1 M sodium cacodylate buffer and five times with ddH2O and subsequently dehydrated in graded series of ethanol (20%, 50%, 70%, 90%, 100%) each for 5 min at 4°C and afterwards for 10 min with acetone at 4°C. Then, the samples were infiltrated for 30 min with a 1:1 mixture of Epon and acetone at 4°C, 2 h in Epon at 30°C and finally polymerized at 60°C for 48 h. Ultrathin sections of 90 nm were cut with a diamond knife (Diatome; Nidau, CH) on an ultramicrotome EM UC7 (Leica GmbH, Wetzlar, Germany). Sections were collected onto 200 mesh carbon-coated finder grids (Plano GmbH, Wetzlar, Germany). Grids with sections were analyzed by FM.
Fluorescence microscopy (FM) and imaging
The EM grid was placed on a 20μl drop of ddH2O on a microscope slide and, after adding a second drop of ddH2O, closed with a high precision cover slip. After adding a drop of immersion oil, EM grids were faced towards the objective during imaging. All images were taken on a Axiovert 200 mot inverted microscope (Zeiss, Oberkochen, Germany) equipped with a Fluar 100×1.3 oil objective (Zeiss, Oberkochen, Germany), a sCMOS-camera (PCO AG, Kehlheim, Germany) and electronic shutters, at room temperature. The microscope was controlled by VisiView version 4.1.0.4 (Visitron Systems GmbH, Puchheim, Germany). Images were acquired using an external light source HXP-120 (Visitron Systems GmbH, Puchheim, Germany), an ET 560/40 nm narrow band excitation filter and an ET630/75 emission filter. Z-stacks of 19 layers (0.45 nm each) were taken at standard exposure time and thereafter processed with ImageJ (National Institutes of Health, Bethesda, USA). After imaging, the grids were removed from microscope slides and dried for use in EM.
Transmission electron microscopy (TEM)
Sections were contrasted using 1% uranyl acetate in ddH2O for 30 min and examined at 80 kV using an EM 902 transmission electron microscope (Zeiss, Oberkochen, Germany). Electron micrographs were recorded digitally using a CCD camera together with the software Image SP (2048×2048 pixels; TRS, Moorenweis, Germany).
Dataset processing by easy cell-correlative light to electron microscopy (eC-CLEM)
The free open-source software eC-CLEM (a plugin for the image analysis software ICY) [27, 28] was used to generate precise virtual overlays of FM and TEM datasets. TEM and FM images were aligned and correlated by computing similarities. Overlay images were saved.
Results
CLEM of MDCK II cells treated with doxorubicin
Cultured MDCK II cells were treated with 2 mg/ml doxorubicin for 30 min and afterwards embedded for microscopy (Fig. 1). Initially, inverted fluorescence light microscopy was used to see the localization of doxorubicin (Fig. 2A). Afterwards, the same sections were analyzed by transmission electron microscopy (TEM) (Fig. 2B). Finally, the obtained information at the different length scales of both techniques were correlated using the software package eC-CLEM/ICY, which enables the precise overlay of both datasets of structural information (Fig. 2C). The correlation accuracy achieved was about 60 nm. After 30 min exposure to doxorubicin, the kidney epithelial cells showed a clear localization of the chemotherapeutic in the nucleus, which correlated with electron-dense regions (heterochromatin) (Fig. 2A, C). TEM/CLEM showed increased membrane blebbings in the cytoplasm and increased formation of microvilli (Fig. 2B, C).
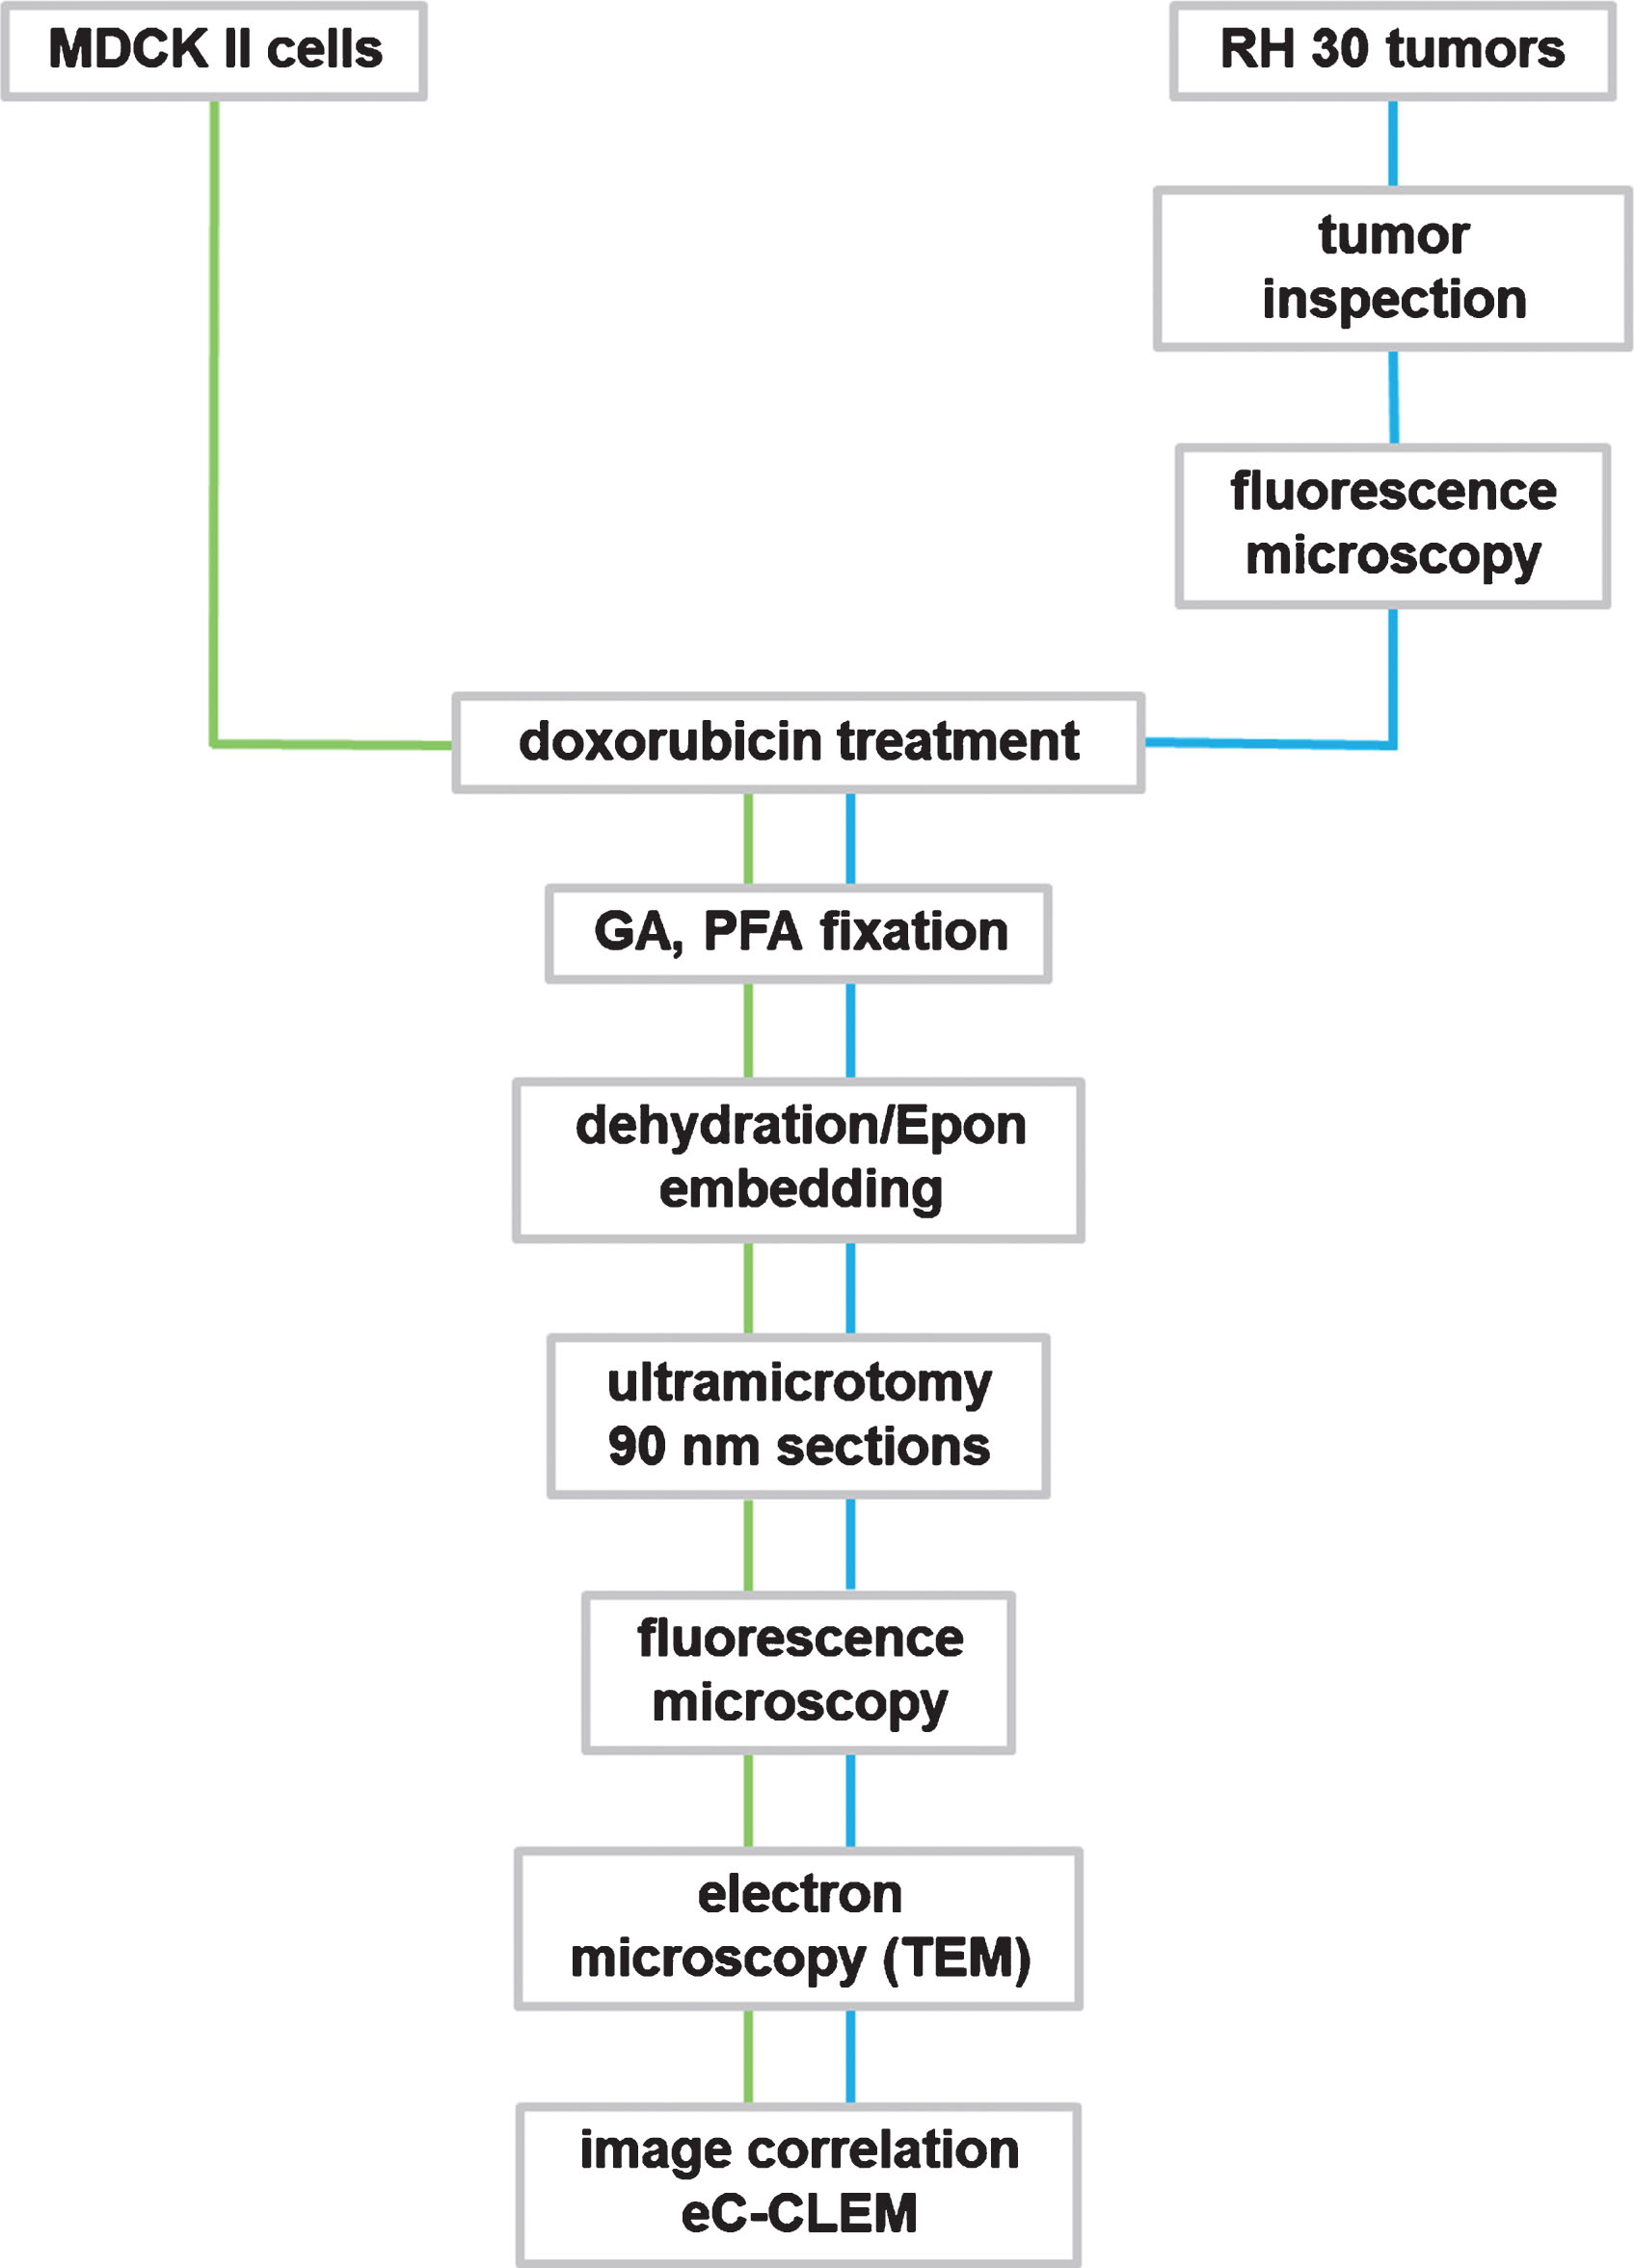
Flowchart for CLEM methodology of doxorubicin treated cell and tumor samples. GA: glutaraldehyde; PFA: paraformaldehyde.
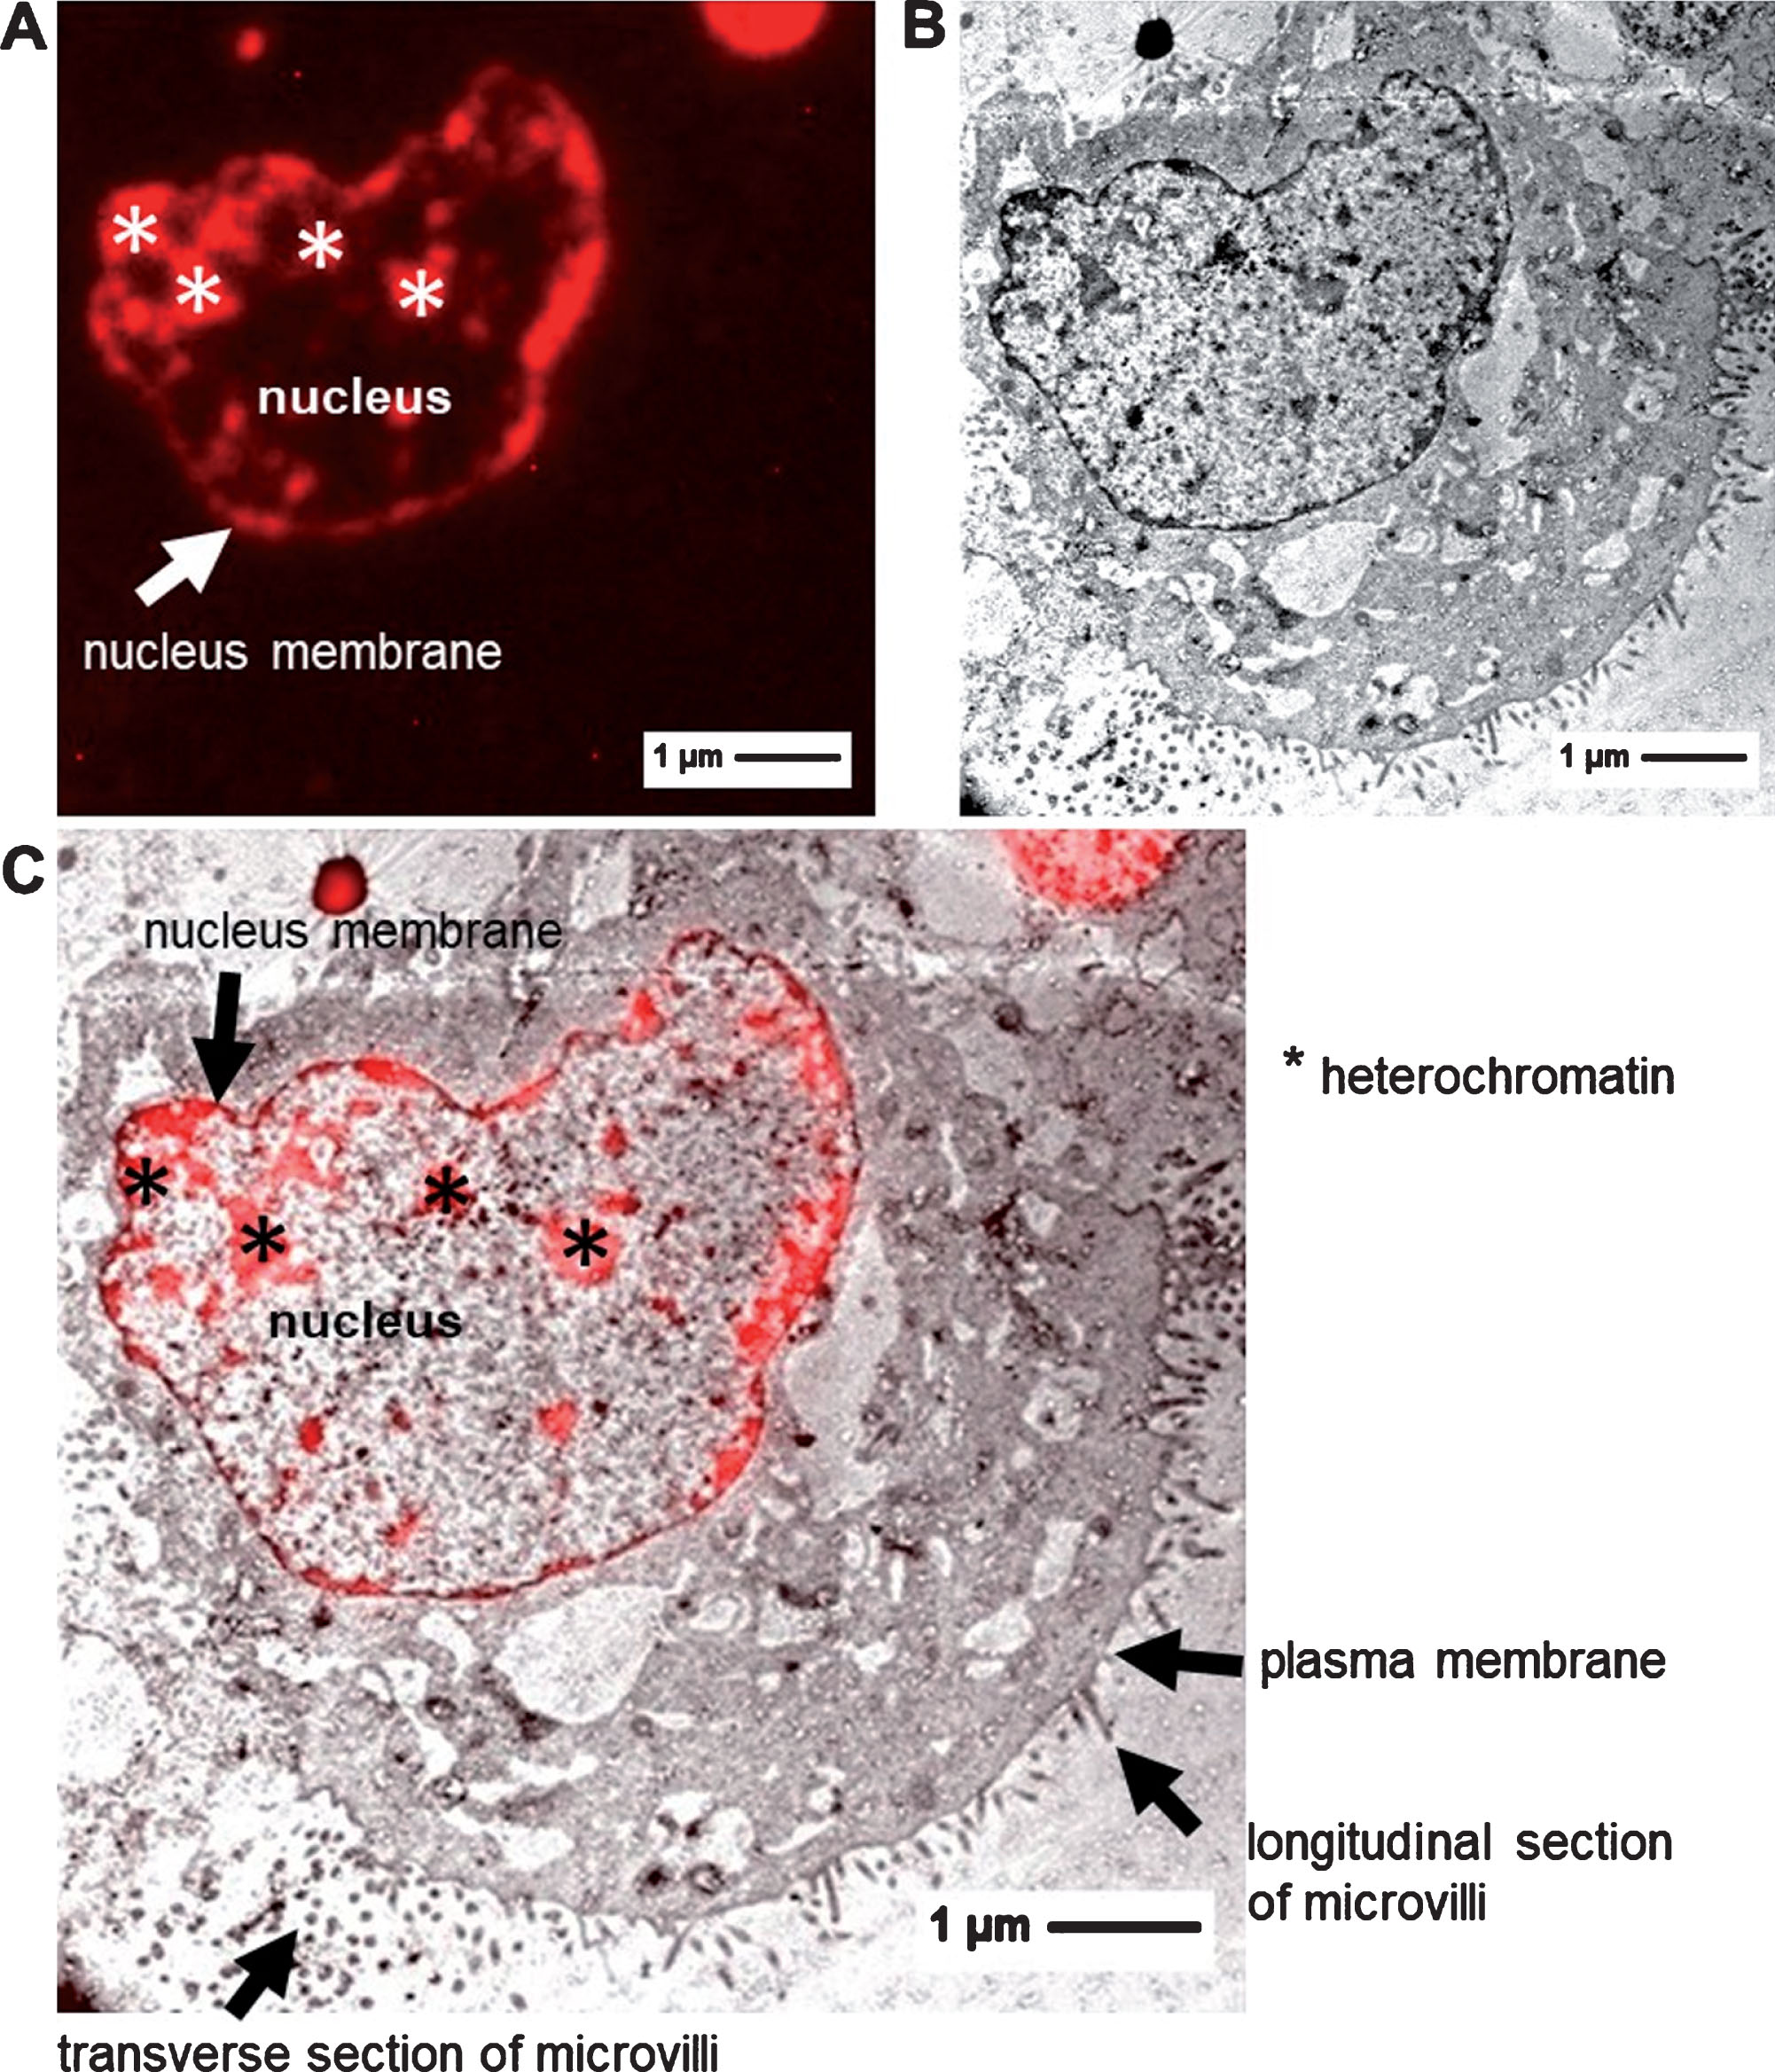
Images of doxorubicin treated MDCK II cells. A: FM image B: TEM image C: CLEM image.
To investigate whether the CLEM method is also suitable to study the localization of doxorubicin in tumors in the in vivo CAM model, we used RH 30 cells to grow tumors on the CAM. The doxorubicin-injected tumors were explanted 24 h after doxorubicin injection from the CAM and checked for a positive fluorescence signal. Compared to the application of doxorubicin in cells (exposure to the drug for 30 min), doxorubicin needs to be transported into the tumor tissue on the CAM via the blood circulation. Tumors with a promising fluorescence signal were chosen for embedding (Fig. 4A). Tumors with low or no fluorescence were not further processed (Fig. 4B). The analyzed tumors show a clear staining of the cell nuclei, and the fluorescence of doxorubicin correlates with electron-dense areas of the cell nuclei (Fig. 4C, D, E). The TEM images show that doxorubicin treatment leads to an enormous stress situation of the cell with an increased formation of membrane blebbings.
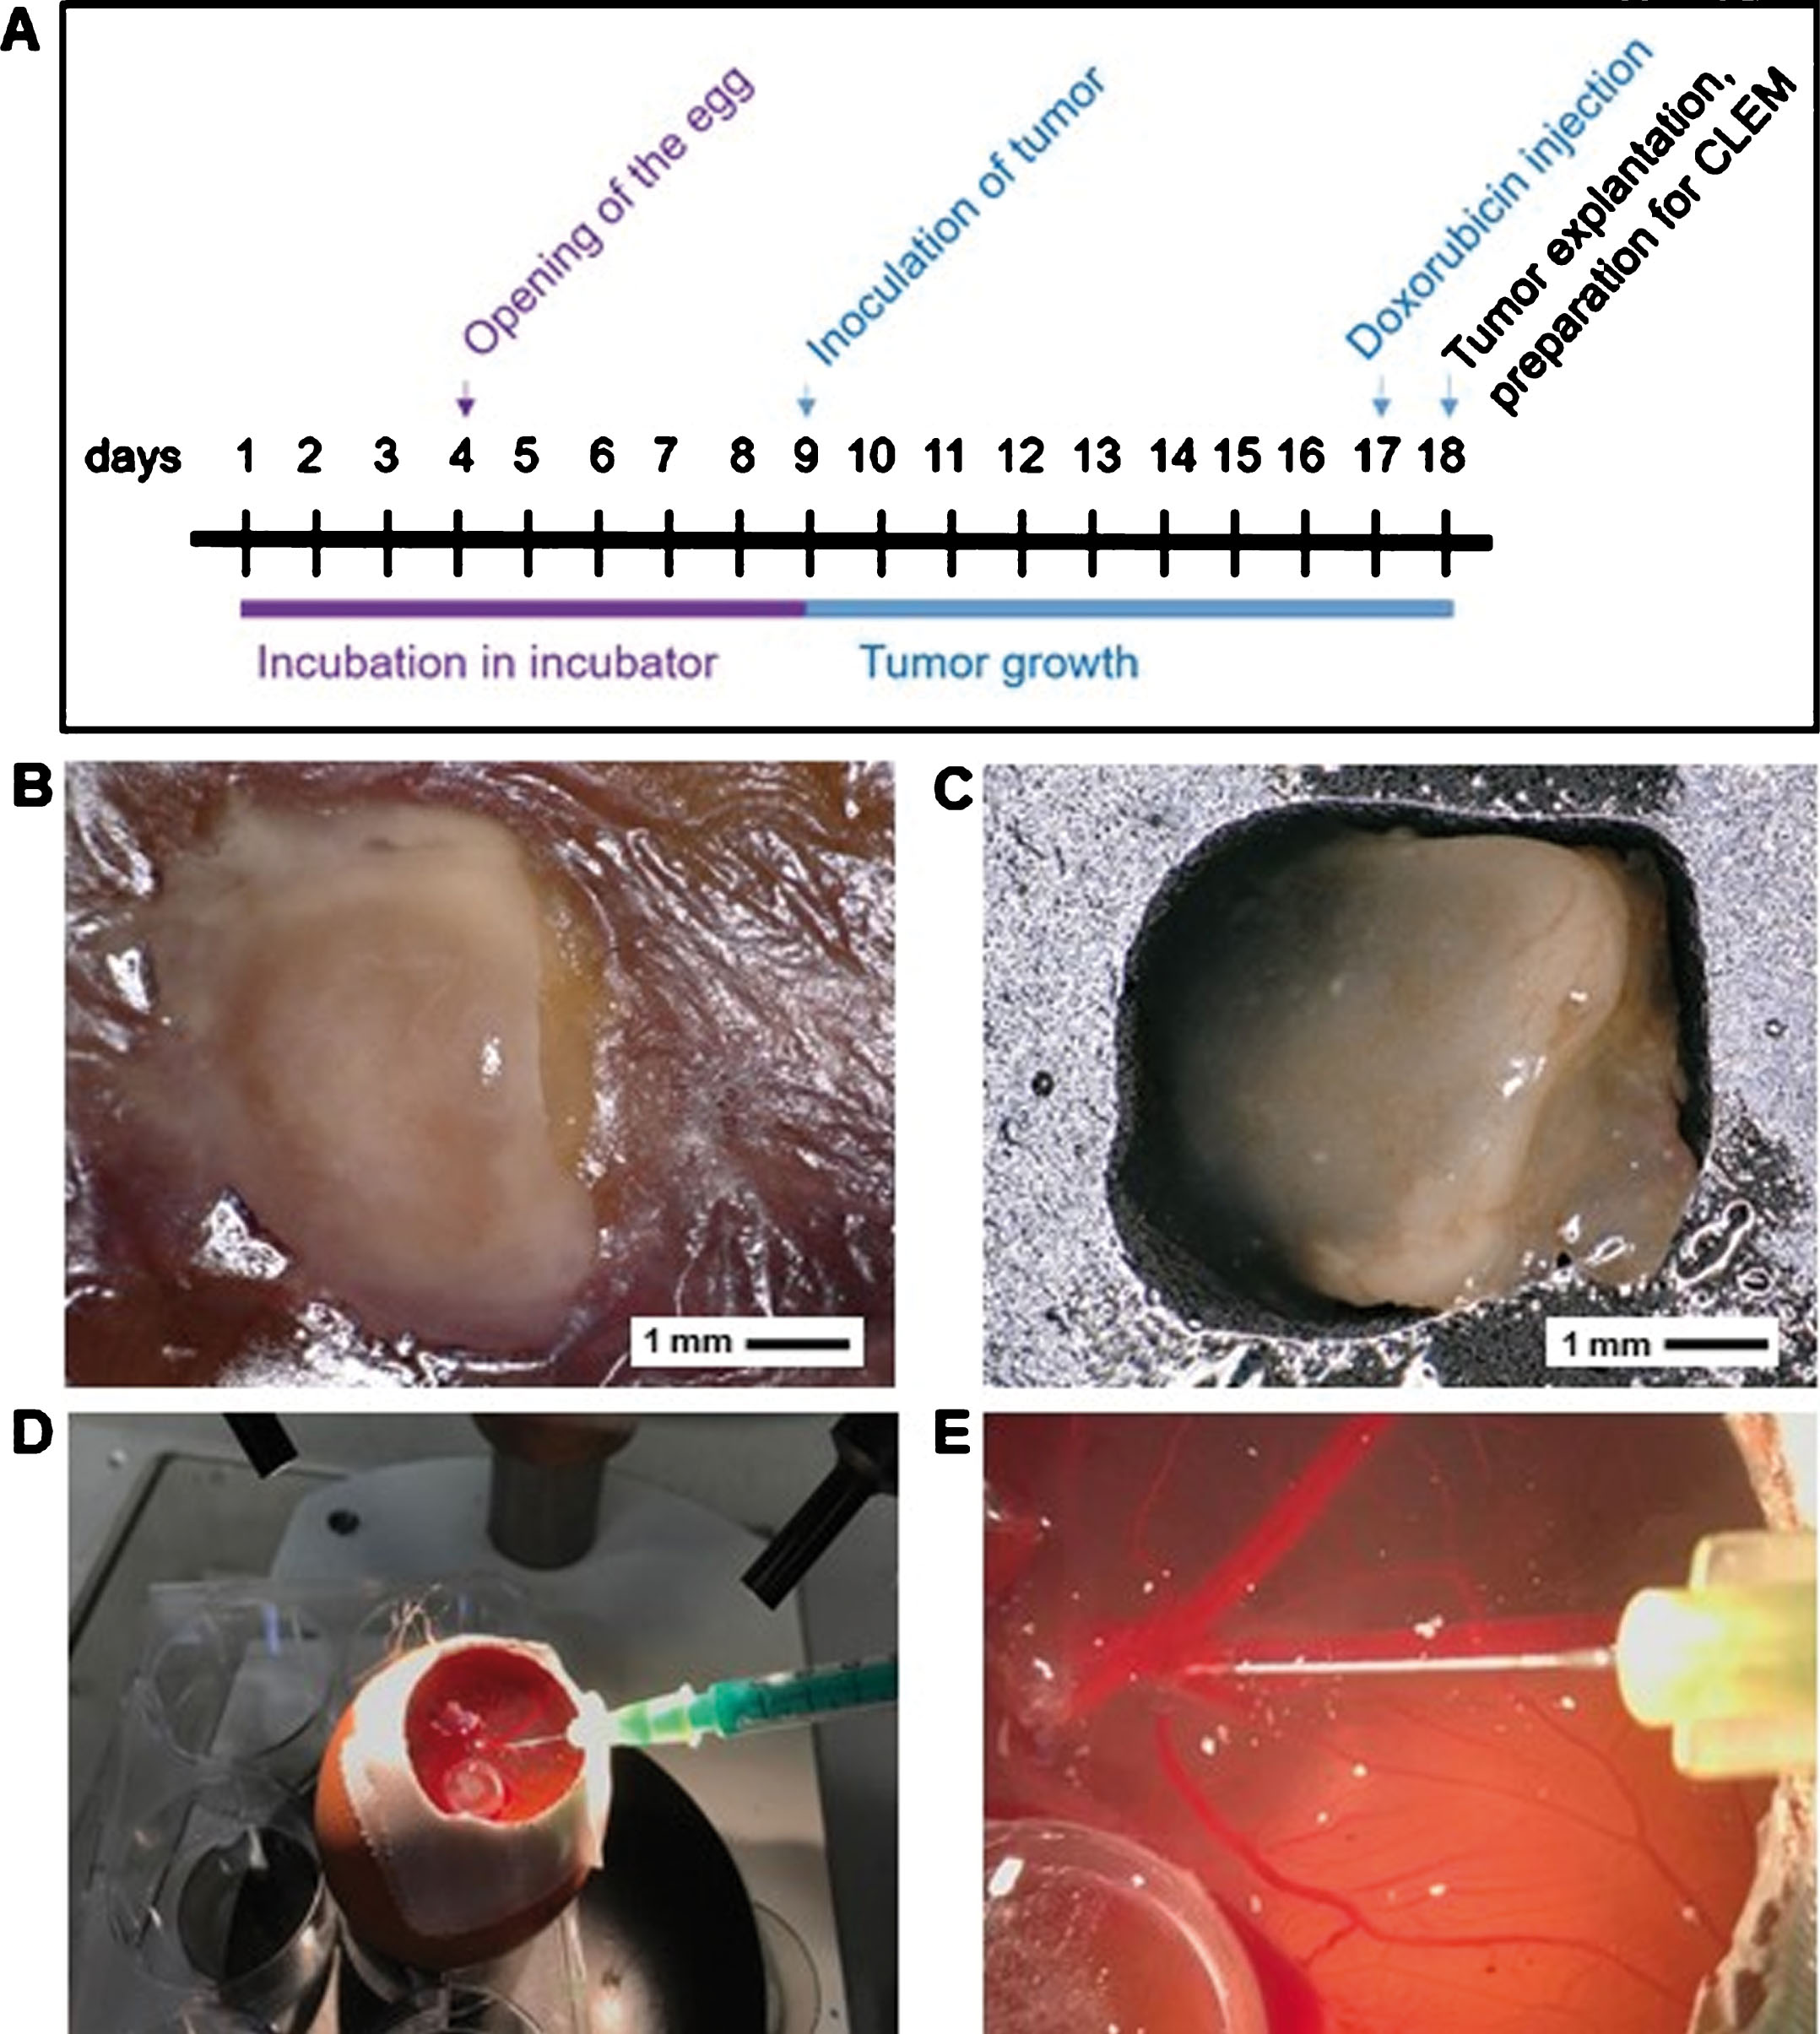
Tumor growth on CAM and treatment with doxorubicin. A: Time schedule of CAM assay. B, C: In ovo tumor growth (B) and ex ovo tumor (C) of RH 30 cells. D, E: Intravenous injection of doxorubicin.
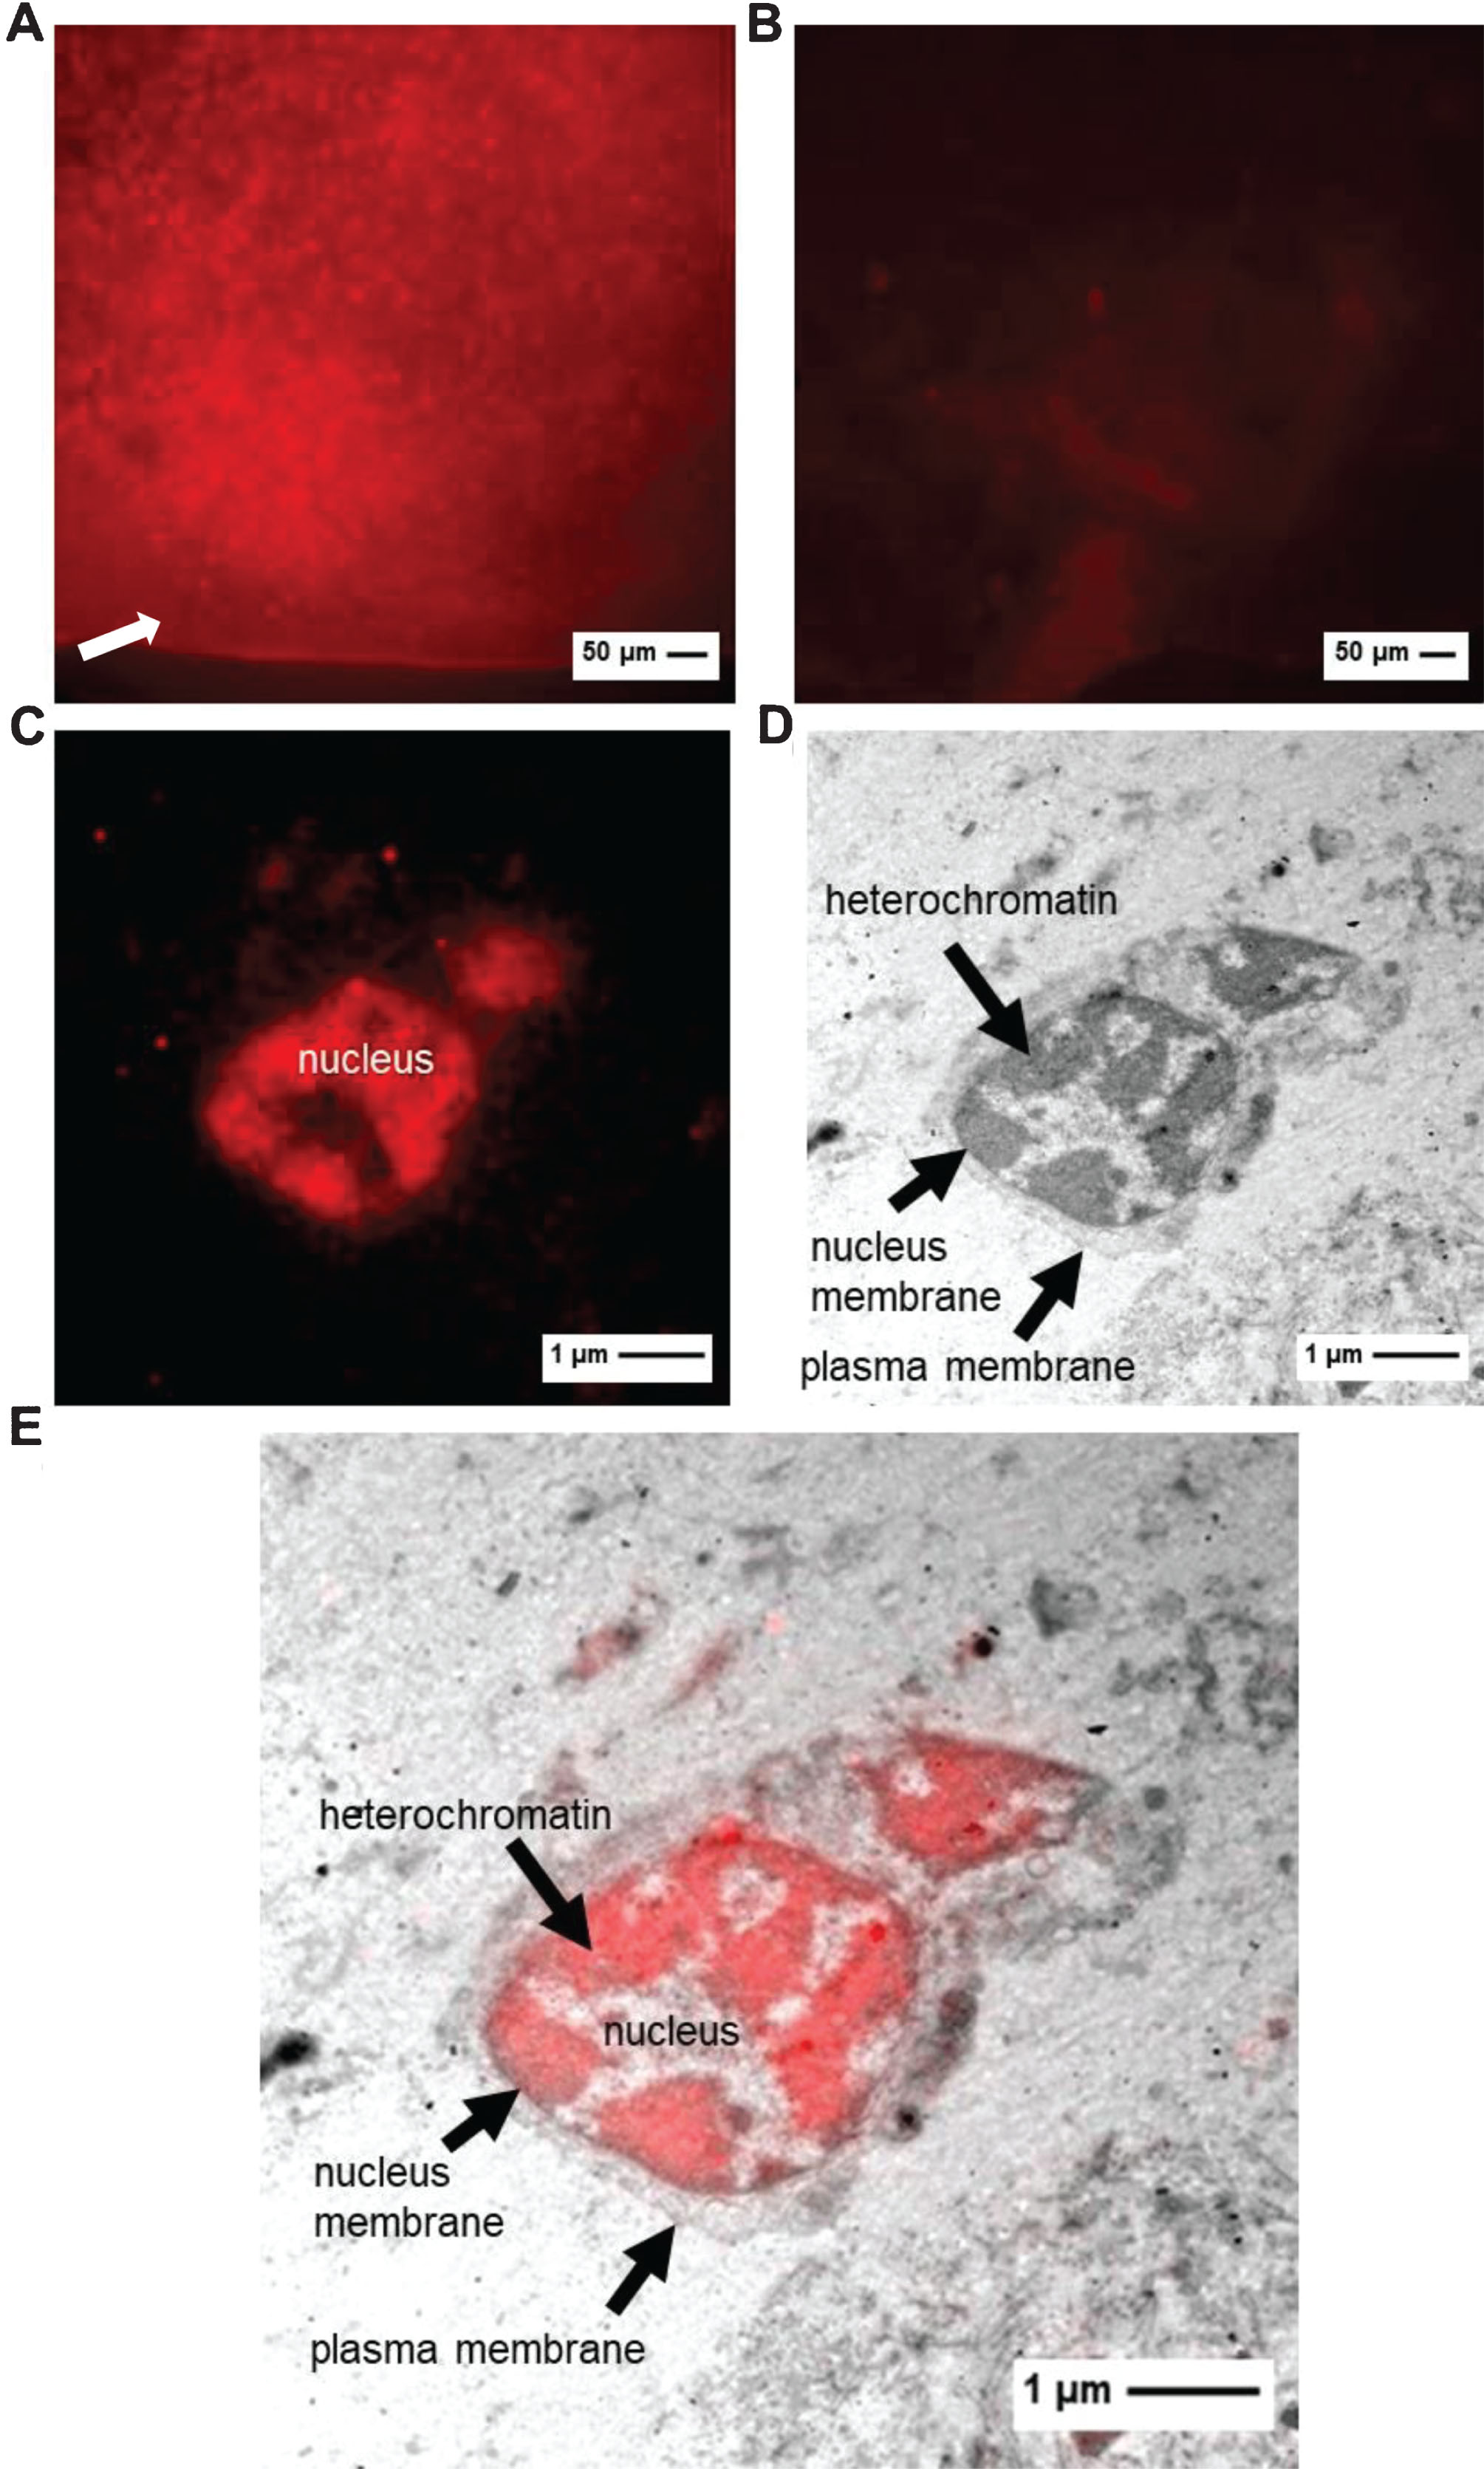
A, B: FM of tumor with high (A) or low fluorescence (B) before embedding (exposure time 40 ms). Arrow indicates chorion membrane. C–E: images of RH 30 tumor (C: FM image D: TEM image E: CLEM image).
In the present work, we established a CLEM method that is applicable to a wide field of cancer research. An advantage of many chemotherapeutic drugs (i.e. doxorubicin) is their autofluorescence, which makes them particularly compatible with CLEM. Therefore, neither additional fluorescence labeling techniques are required nor fluorescent proteins are needed. We were able to show that the fluorescent property of the chemotherapeutic substance doxorubicin behaves completely differently from those of fluorescent proteins during sample preparation for EM. The fluorescence ability of doxorubicin proved to be quite resistant to quenching during the fixation, dehydration and embedding procedure or to photobleaching during FM. Epon embedding provides the best structure preservation for electron microscopy [29, 30]. In many cases, glutaraldehyde fixation, room-temperature dehydration, and also Epon embedding resulted in severe losses of fluorescence. As our investigations show that the fluorescence ability of doxorubicin withstands our preparation protocol, we have set up a post-embedding CLEM approach, accordingly, with success. Furthermore, the time needed for the embedding protocol could be substantially reduced as doxorubicin requires no additional treatment steps for fluorescence preservation. We describe a promising new method to visualize the pattern of doxorubicin in cells and for the first time for an in vivo tumor grown on CAM. This established method precisely localizes doxorubicin using electron microscopic resolution.
The correlation accuracy achieved in our CLEM experiments was about 60 nm. In principal, an accuracy of <500 nm is called “high accurate” [12]. Our correlation accuracy is also comparable to publications from Kukulski et al. [9] or Schorb et al. [31] showing an accuracy of about 100 nm. Using fluorescent fiducial markers Schellenberg et al. [11] also achieved a correlation accuracy of about 60 nm in their CLEM studies. To reach a significant higher overall accuracy (less than 50 nm), the use of fluorescent fiducial markers is needed [32]. For our study, the accuracy of 60 nm is sufficient. If a higher accuracy will be required to investigate the localization of other drugs by CLEM, e.g. TetraSpecks with a diameter of 50 nm (Thermo Fisher Scientific) could be easily applied to the resin sections as described by Schorb et al. to complement our CLEM method [31].
One possible perspective for our CLEM technique is the use for the structural and functional detection of drugs/medical therapies. Drugs, coupled to fluorescence that attack (i) the nucleus (e.g. doxorubicin), or (ii) organelles in the cytosol (e.g. sorafenib), or (iii) surface structures of the cell membrane (e.g. rituximab), or (iv) are bound to/absorbed by exosomes/extracellular vesicles may be detected and localized by CLEM: (i) Drugs that intercalate in the DNA and either have autofluorescence (e.g. doxorubicin) or carry a fluorescent label. (ii) Drugs that attack organelles in the cytosol. These include proteasome inhibitors such as the cytostatic bortezomib, substances that inhibit tubulin growth, such as vincaalkaloids (vincristin, vinblastin) and tyrosine kinase-inhibitors that interfere with intracellular signaling pathways, such as sorafenib, dasatinib and imatinib. The latter is usually detected using radiolabeled C14 [33]. The results generated with our CLEM technique let assume that this method is an alternative and safer approach to detect imatinib. (iii) Drugs/antibodies that recognize therapeutically relevant surface structures of the cell membrane. For example, the chimeric antibody rituximab recognizes CD20 and bevacizumab acts as an angiogenesis inhibitor due to VEGF blockage. (iv) Finally, membrane blebbings including exosomes and extracellular vesicles (50–100 nm) can be detected by means of CLEM. Chemotherapeutics, in particular anthracyclines, enter tumor cells and subsequently the nucleus. However, the tumor cells rapidly sequester the active component (e.g. doxorubicin) immediately into subcellular compartments and transport it - concentrated in exosomes - outside of the cell [34]. Tumor exosomes, which bind drugs, act as a “protective shield” around the tumors making the drug locally ineffective. On the surface, exosomes carry proteins like the therapeutic target CD20 binding the anti-CD20 chimeric antibody rituximab and inducing a resistance mechanism of the tumor. Furthermore, complement-regulating proteins like CD46, 55 and 59 down-regulate parts of the complement system leaving exosomes unscathed and depleting the complement protecting the tumor [35]. Moreover, it has been shown that exosomes express immunomodulatory proteins (e.g. TRAIL, Fas ligand) on their surface [36]. These can have immuno-suppressive effects in the tumor niche and in the pre-metastatic niche [37]. Simon et al. demonstrated that glioblastoma elude anti-angiogenic therapy with bevacizumab by internalizing the antibody and releasing more extracellular vesicles carrying the antibody [38].
In summary, CLEM is a promising method to functionally and structurally detect fluorescing drugs (e.g. doxorubicin, paclitaxel, bleomycin) [39] whose target structures are in the nucleus, in the cytosol or on the membrane surface.
Conclusion
Our CLEM method represents an innovative method of visualization for the autofluorescent cytostatic drug doxorubicin. Accurate representation of subcellular architectures and morphology is possible due to high-resolution electron microscopy. Perspectively, this powerful imaging method may be used to study the effect of fluorescent drugs in patient material and to develop promising prevention and treatment strategies at the cellular level.
Conflict of interest
The authors declare no competing interests.
Footnotes
Acknowledgments
We thank Lucia Denk and Dipl. Biol. Manfred Depner for their excellent technical support.