
Abstract
Cardiovascular disease is now under the influence of several factors that encourage researchers to investigate the flow of these vessels. Oscillation influences the blood circulation in the volume of red blood cells (RBC) strongly. Therefore, in this study, its effects have been considered on hemodynamic parameters in the elastic wall and coronary bifurcation. In this study, a 3D geometry of non-Newtonian and pulsatile blood circulation is considered in the left coronary artery bifurcation. The Casson model with various hematocrits is analyzed in elastic and rigid walls. The wall shear stress (WSS) cannot show the stenosis artery alone, therefore, the oscillatory shear index (OSI) is represented as a hemodynamic parameter of WSS individually of time. The results are determined using two-way fluid-structure interaction (FSI) coupling method using an arbitrary Lagrangian-Eulerian method. The most prominent difference in velocity happened in the bifurcation and at hematocrit 30 with yield stress 6.59E-04 Pa. The backflow and vortex flow in the LCx branch grown with increasing shear rates. The likelihood of plaque generation at the ending of the LM branch is observed in hematocrits 10 and 20, while the WSS magnitude is normal in the hematocrit 60 with the greatest yield stress in the bifurcation. The shear stress among the rigid and elastic models is the highest at the ending of the LM branch. The wall shear stress magnitude among the models decreased at most of 24.49% by dividing the flow. Time-independent results for models showed that there is the highest value of OSI at the bifurcation, which then quickly dropped.
Introduction
Coronary artery disease (CAD) is usually caused by the agglomeration of plaques in the arterial wall, which is one of the most common cardiovascular diseases [1]. Oscillatory shear index (OSI) and wall shear stress (WSS) are hemodynamic agents in the expansion of atherosclerotic plaque and have a great association with the local site of plaque accumulation [2]. Studies have shown that the progress of arteriosclerosis disease has a direct correlation with critical WSS in the coronary bifurcation [3–5]. The dividing of the coronary arteries can lead to partial disruption in blood flow. The cells of the blood vessel become more active to prevent the destruction of the inner layer in areas with high wall shear stress [6, 7]. However, it still unknown the correlation of coronary artery bifurcation with these hemodynamic forces [3, 8].
Hematocrit (HCT) is another important hemodynamic parameter that greatly modifies the viscosity of blood at the low shear rate [9, 10]. Hematocrit is the volume rate of the RBC in blood, which performs an integral role in ascertaining its physiological behavior. There is a direct relation between hematocrit increment and the increase in blood’s apparent viscosity. This addition is proper to cell-cell interaction etc. Viscosity intrinsically resists the flow of blood and depends on the flow conditions such as temperature, blood properties including hematocrit and WSS [11]. Increase hematocrit may further atherosclerosis by inducing flow slump and contribute to a devastated parallel flow [12].
Recently, Non-invasive methods with computational fluid dynamics (CFD) analysis can indicate the local position of the plaques in the patient with CAD [13–15]. Most numerical studies consider the physiological parameters which were constant of the sick person notwithstanding the known changes in the physiology. Boundary conditions with physiological variables such as WSS and viscosity may cause more changes in blood flow after stenotic, which may influence clinical outcomes [16]. However, the influence of the parameters mentioned has not been investigated in CFD modeling.
Yin et al. [6] found that endothelial cells are stretched and moved in the side of flow when exhibited to wall shear stress of more than 1.5. But coronary artery endothelial cells have a circular shape in WSS of smaller than 0.4 Pa or oscillating and do not show any tendency for alignment. These circular cells usually develop in areas with low WSS have high OSI valence and increase the absorption of blood-borne particles into the endothelial layers [17, 18].
Chatzizisis et al. [17] determined that the low endothelial shear stress (ESS) is accountable for the improvement of high-risk coronary atherosclerotic plaques correlated with extreme extensive remodeling. They found that in these areas, lipids accumulate and inflammatory cells permeate the intima. Himburg et al. [19] indicate that endothelial permeability reduces with developing time-average shear stress above the normal range and slightly with OSI. Nam et al. [16] determined that greater hematocrit causes an elevated pressure reduction at an imputed systolic blood pressure compared with lower hematocrit. therefore, the height of plasma viscosity was associated with the improvement of atherosclerosis disease and major adverse clinical events [20]. Velcheva et al. [21] showed by Doppler’s method that hematocrit is the determining factor of viscosity and there is an opposite association between blood flow and hematocrit. Kanaris et al. [22] using a numerical solution in the arteries with non-Newtonian blood flow explained that raised hematocrit can damage the arterial wall and begin thrombosis. Box et al. [23] investigated that the vessel diameter and variation in flow rate had a great influence on the shear stress. They found that low plasma viscosity was associated with a low WSS and high OSI occurs at the edges of the recirculation region. These studies showed the importance of hematocrit on hemodynamic specifications.
In previous studies, the rigid wall was analyzed without examining the coronary bifurcation and the wall’s elastic properties [3, 8]. However, the reactivity of the wall influence the cells of the blood vessel [24, 25]. The fluid-structure interaction (FSI) is used to simulate the concurrent influences of blood flow and deformation of the arterial wall. Tori et al. [26] obtained meaningful differences in the magnitude of the WSS in the elastic and rigid models by analyzing the blood flow in the right coronary arteries. Huo et al. [27] achieved the vessel compilation in an animal pattern of coronary using laboratory measurements and numerical simulations. Studies have displayed that the time-averaged WSS gradient value in the elastic model is continuously shorter than the rigid model at the area of dividing of blood flow [28, 29].
The purpose of the present study was to estimate the three-dimensional pulsatile flow of blood with different hematocrit in the left coronary bifurcation. Changes in the volume rate of red blood cells in blood have significant influences on the blood flow. Therefore, investigations in this field have not yet been studied in the coronary bifurcation and elastic and rigid walls. Eventually, hemodynamic parameters are obtained dependent and independent of time in high-risk areas of the arteries.
Methods and material
Geometry and meshing
Several studies have been conducted to achieve ideal models in coronary arteries that prepare anatomical data for vessel diameter, length and curvature [30]. In these studies, information was provided on persons who did not have the atherosclerotic disease and included arteriograms information from important and sensitive coronary arteries most susceptible to the disease [30, 31]. Coronary diameter in different sections and branches was calculated by several points along its course. Then the angle between each point and along the vessel was obtained and considered in the polar coordinate system. Eventually, the left coronary bifurcation is designed using the points achieved in each segment in a computer program (CAD). The coronary model involves the left circumflex (LCx), the left anterior descending (LAD) and the left main coronary arteries (LM). The basic dimensions gained for each part of our coronary model are listed in Table 1. Since the data obtained is relevant to the ending of the diastole phase, boundary conditions have begun in solving the CFD from the systole phase.
Anatomical dimensions of the left coronary obtained from arteriogram data
Anatomical dimensions of the left coronary obtained from arteriogram data
The fluid and solid domains were discretized using the triangular elements. This mode is used to increase computational performance and numerical convergence, which is beneficial in large deformations, especially soft tissue. In each model, at the site of a bifurcation, a better resolution of the grid was made to gain more accurate results in this region. The three dimensional left coronary model with the triangular meshing for solid and fluid domains is shown in Fig. 1.
Before presenting the results, a mesh study is conducted on the rigid model with HCT = 0.4 using four mesh sizes so that the absolute error in two successive mesh correction is less than 1% for the maximum velocity at the ending of the LM branch. The number of parts considered for the blood domain in each mesh is Grid1 = 21082, Grid2 = 54786, Grid3 = 183599, and Grid4 = 326348. Figure 2 shows the mesh dependency study at maximum velocity when the systolic phase occurs.
The accessible error among the Grid3 and Grid4 meshes at the ending of the LM is about 0.78%. Here, Grid3 grid is regarded as the source mesh due to it has a less computational time and failure than the Grid4.
In this study, the governing Navier–Stokes equations for blood flow, including the continuity and the momentum equations, were solved with the assumption of non-Newtonian, incompressible and laminar flow without gravitational effect [32, 33]
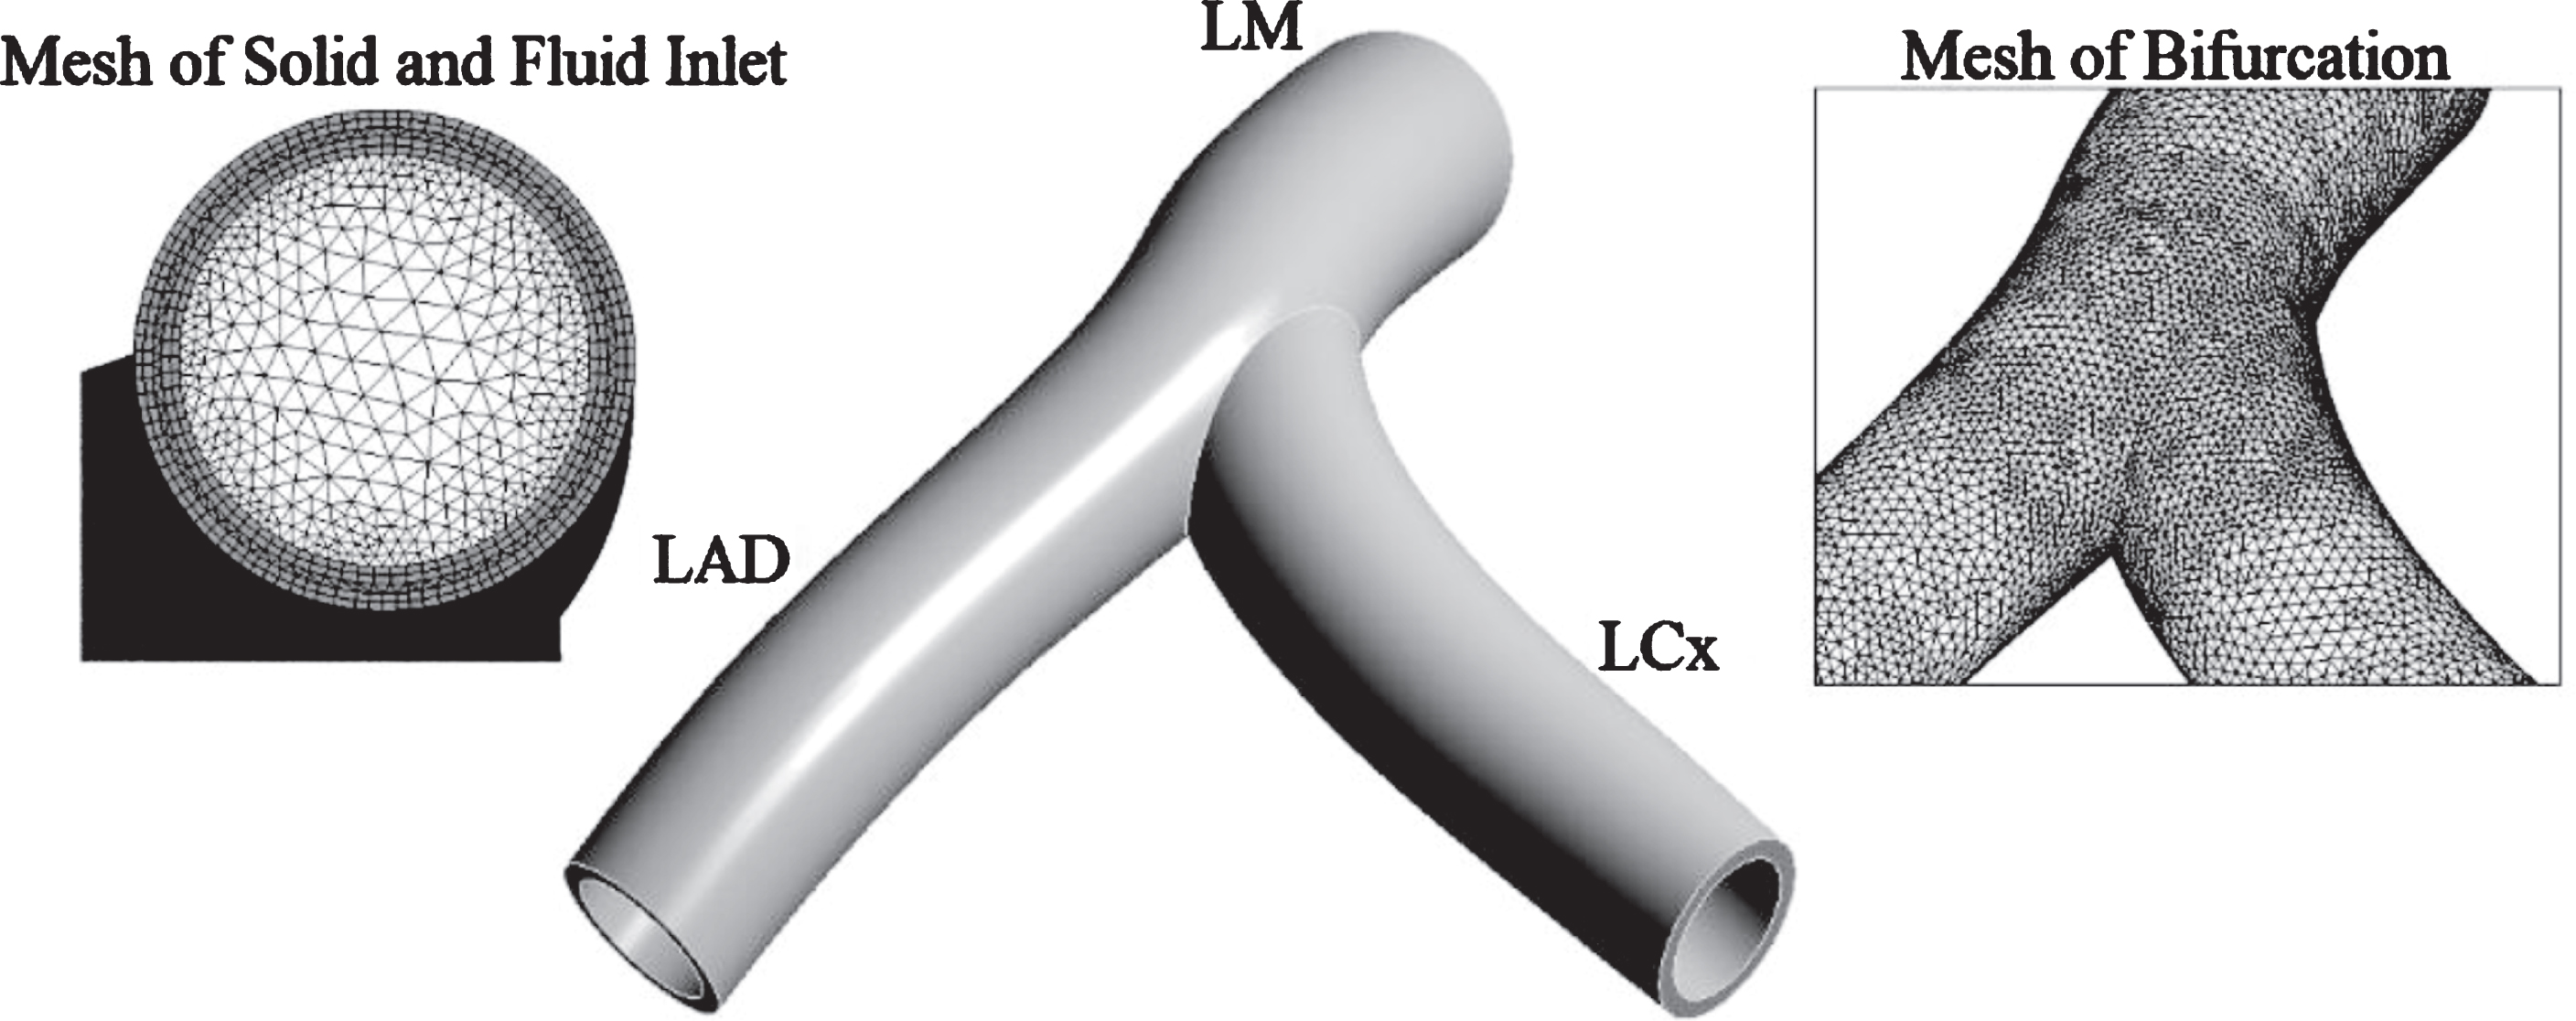
3D left coronary model with solid and fluid domain.
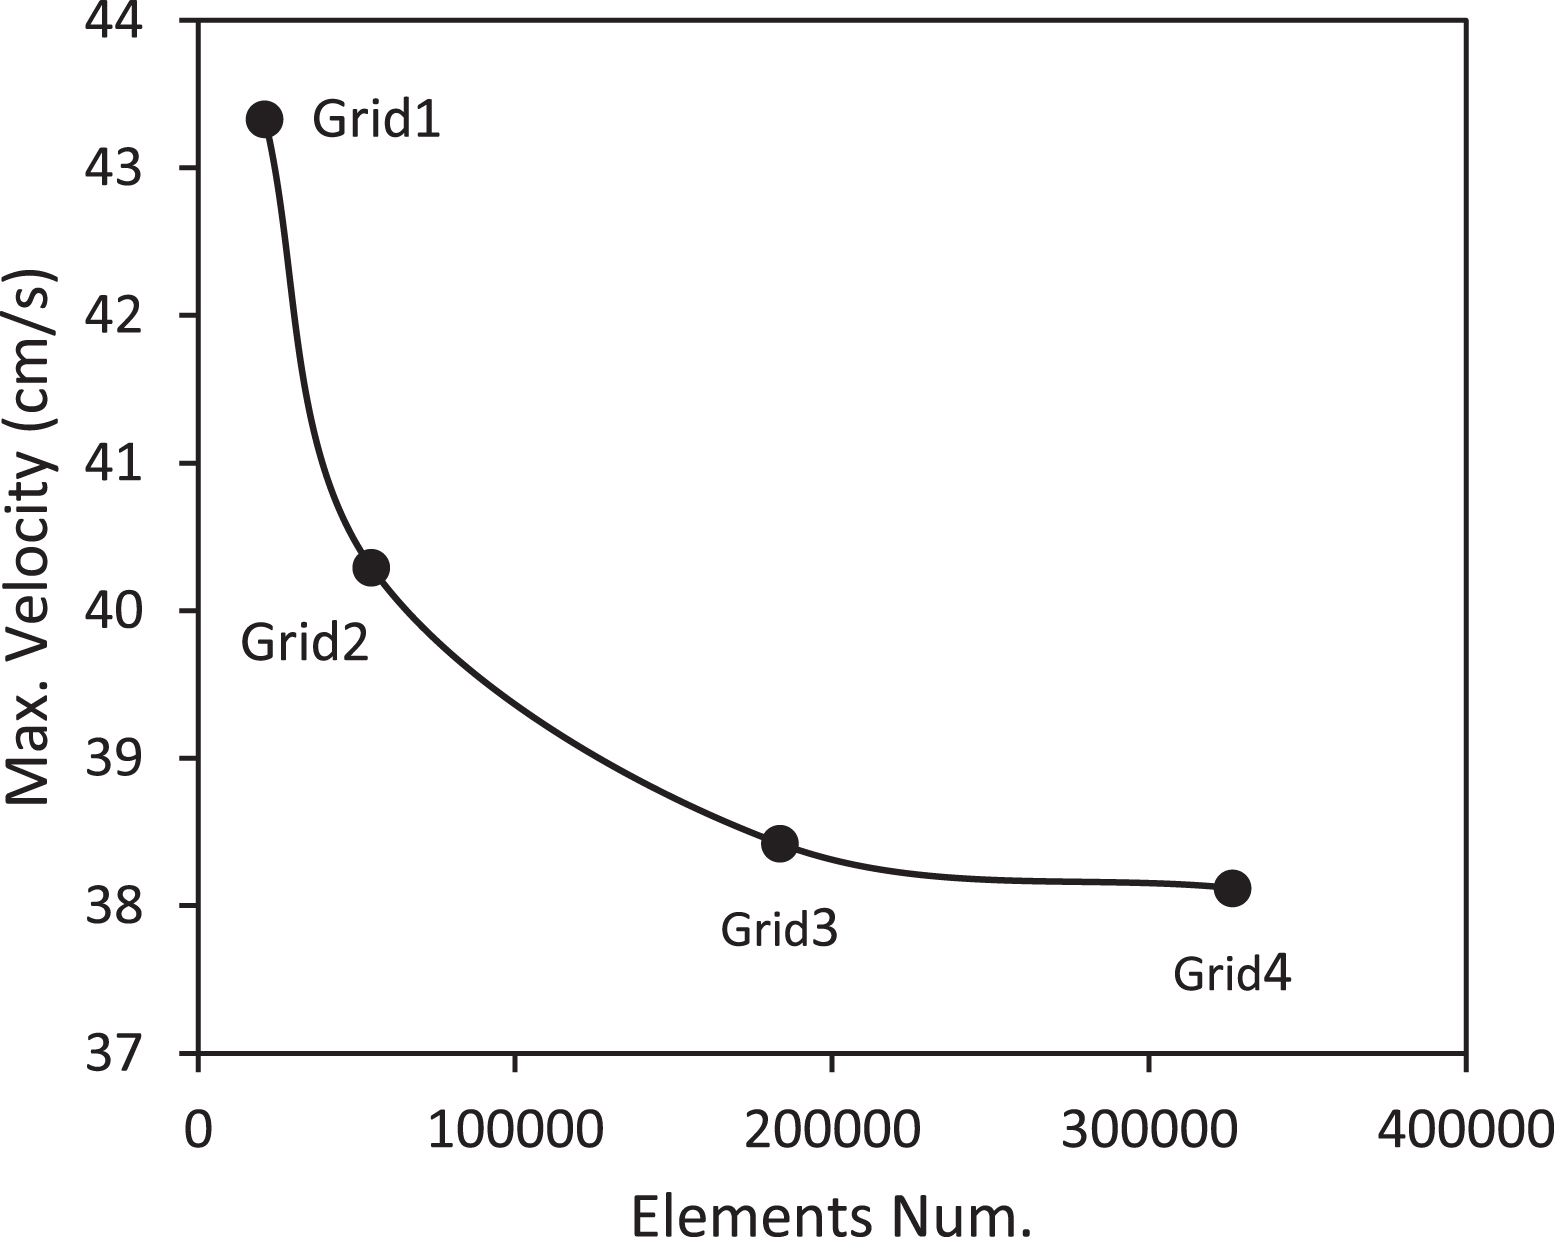
Mesh dependency at the branches of LAD and LCx.
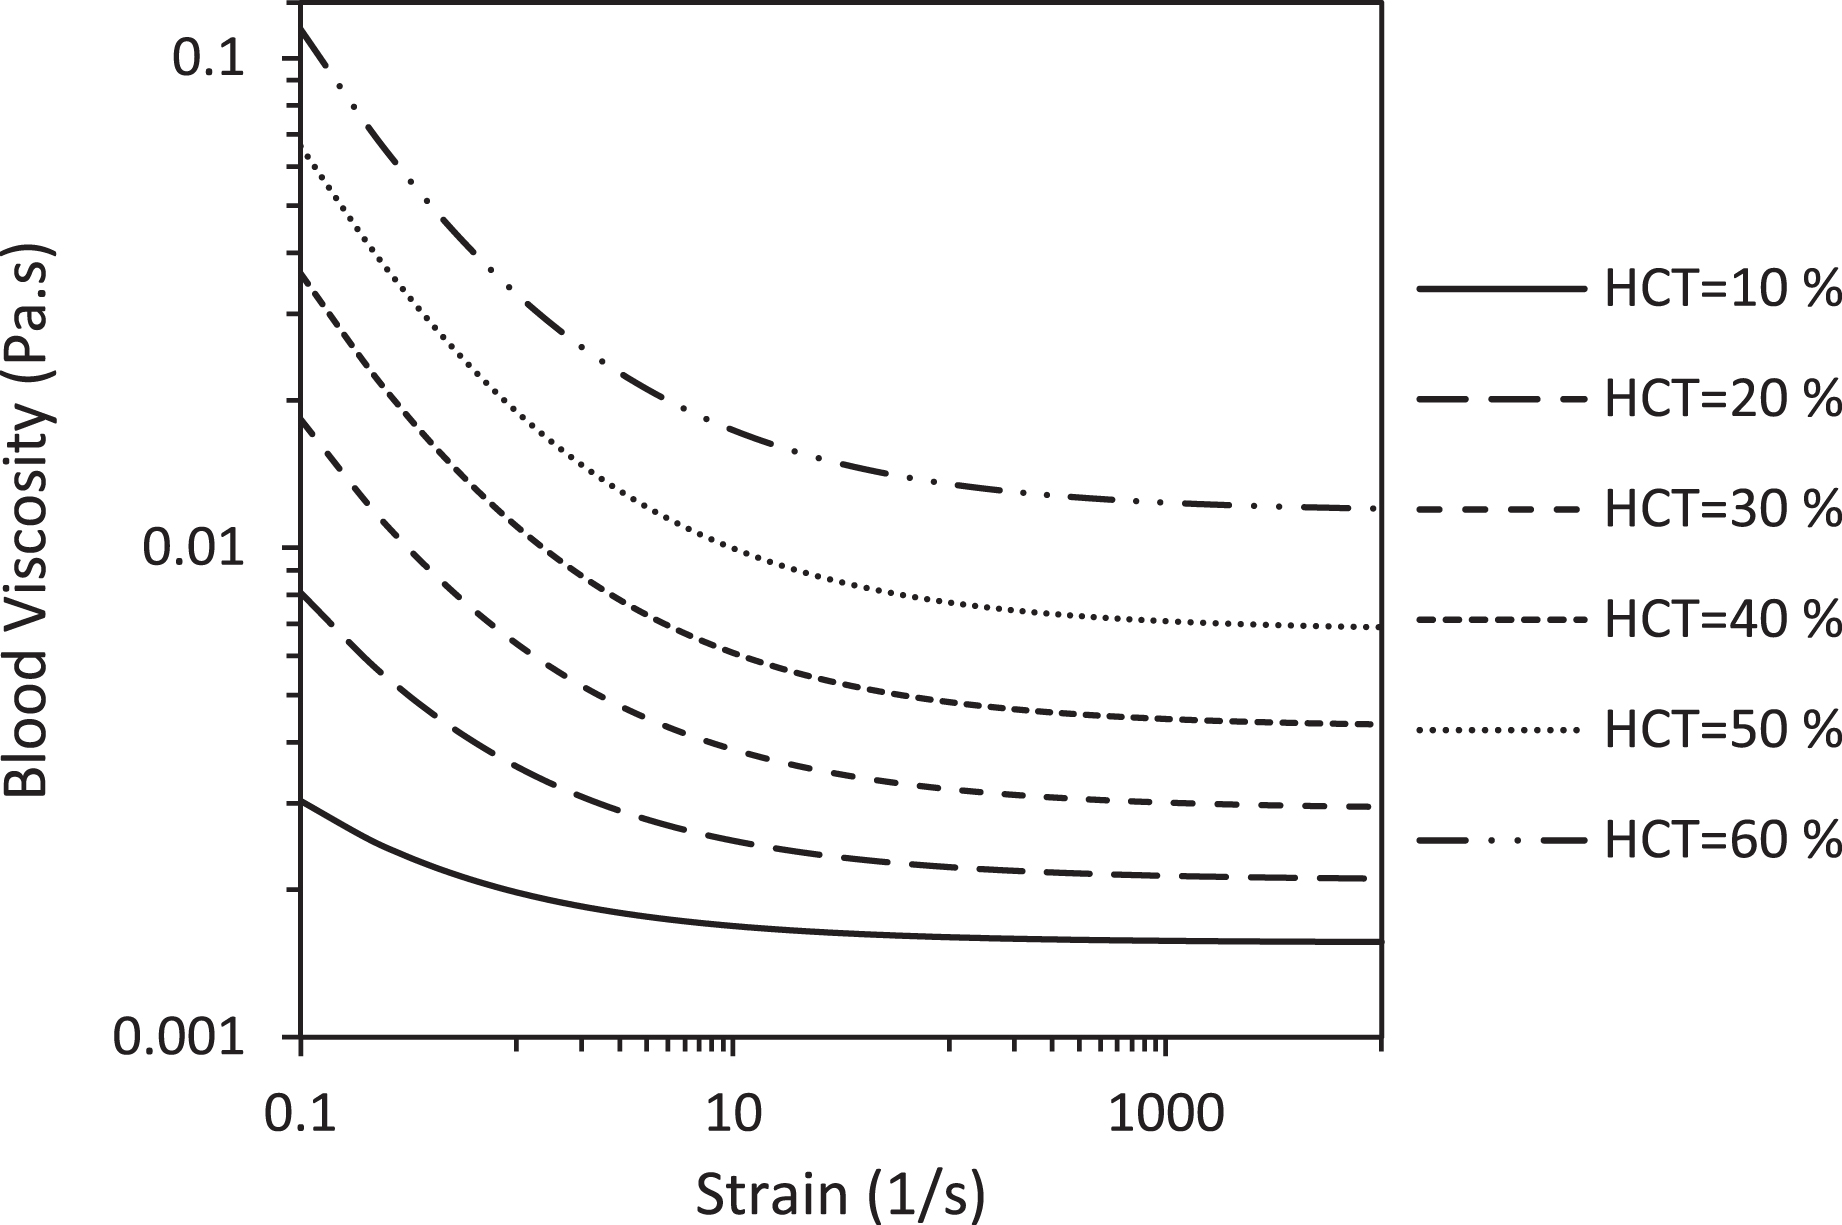
Blood viscosity for various hematocrits at the Casson model.
In Table 2 and Fig. 4 the parameters of the Casson model containing yield stress and blood viscosity in infinite shear rates are given for various hematocrit values.
Parameters of the Casson model for various hematocrits
HCT: hematocrit, τ y : yield stress, η ∞: blood viscosity in infinite shear rates.
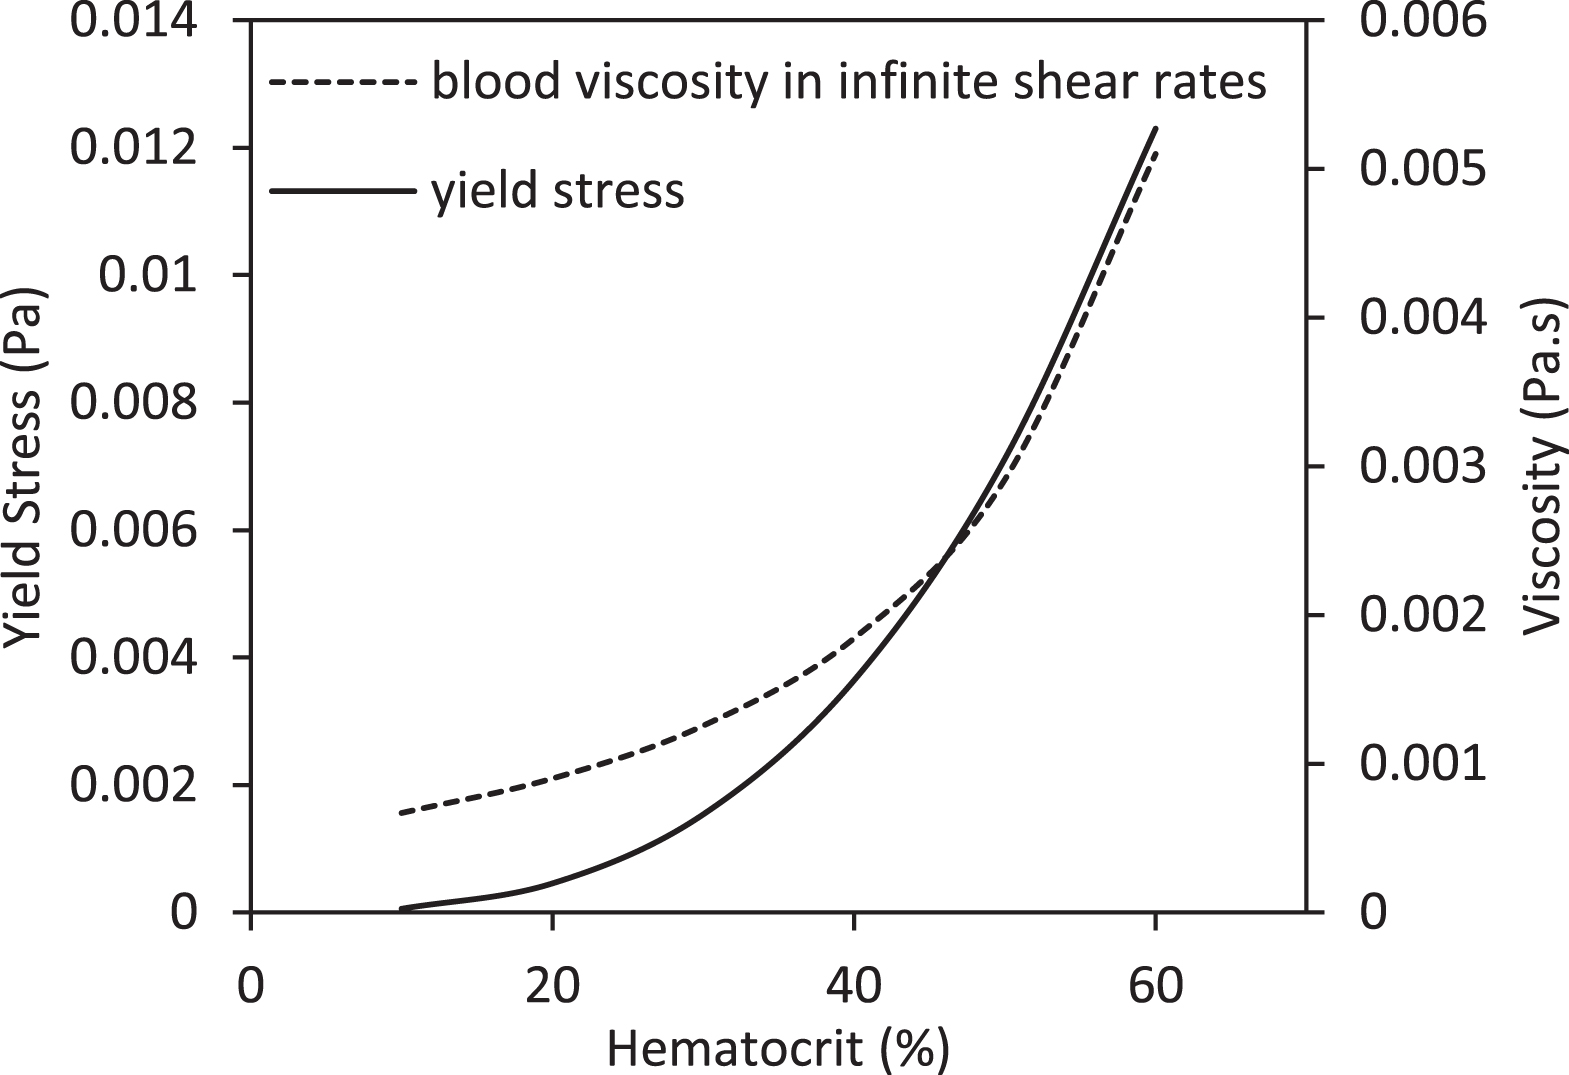
Yield stress and blood viscosity in infinite shear rates for various hematocrit.
The solid model is appropriated as an incompressible and linearly elastic solid. To study the impression of the elastic modulus, two various values of elastic modulus (0.7 MPa and 2.2 MPa) are tested [36, 37]. The structural equation for the vessel wall was specified for the effects of wall displacement in the form of the following Equation [38]:
In this paper, the blood is examined as a three-dimensional model of non-Newtonian fluid with various hematocrits in a rigid wall and compared with the elastic artery in the left coronary bifurcation. The pulsatile flow was used at the input and output of coronary. The entrance of LM was considered as a pressure boundary condition and the outputs of LAD and LCx were considered as the velocity boundary condition. The volumetric flow in each outlet was achieved using clinical information of the coronary arteries in the input using Murray’s law. This law shows that the ratio of flow to the radius of a blood vessel is three. It is possible to calculate Murray’s law using the Poiseuille formula as follows [35, 40]:
The pressure in the aorta and the resistance of coronary arteries have controlled the flow of blood in this arteries. On the other hand, resistance to coronary artery progresses due to increased pressure in the layers of the vessel and contraction of cardiac. The waveform of pulsatile flow rate and pressure are shown in Fig. 5 based on physiological data in coronary arteries [41].

Pulsatile pressure and velocity used in this study.
There is detailed information on the motion of the heart that shows the effects of heart rate on the flow in the arteries [42]. The blood vessels located on the heart is influenced by this motion. Studies determine movement of the heart using a kind of optical flow method. The wall velocity was measured in 11 normal subjects in peak diastole and systole. Finally, the radial velocity is shown in the Anterior, Septum and Lateral axis with respect to the position of the heart during a cardiac cycle in Fig. 6.

Radial heart velocity in the Septal, Lateral and Anterior segments.
The blood flow was solved employing a fully implicit method and second-order backward Euler transient scheme by the ANSYS commercial software (ANSYS Inc.) in the left coronary bifurcation. The fully coupled include of two-way FSI models were solved in ANSYS Mechanical and ANSYS CFX. ANSYS Mechanical uses finite element analysis (FEA) for structural analysis and ANSYS CFX is finite-volume-based software for fluid mechanics calculations which first includes discretizing the spatial domain using a mesh. Solving FSI models is done using these two packages that the remaining is less than a determined resistance at any time by applying boundary conditions. Due to the motion of the fluid domain, the arbitrary Lagrangian-Eulerian (ALE) formulation is used to analyze the fluid flow which is directly related to the Lagrangian formulation of the wall domain. A transient simulation was conducted for each model of the coronary artery in three cardiac cycles which the last cycle was extracted in mechanical analysis. In this study, the time step is 0.005 seconds which was examined with 480 time steps in the three cardiac cycle by convergence criterion 10-5.
Ku et al. [43] observed an important association between oscillating shear stress and plaque location, giving that impressed oscillation in the orientation of wall shear can promote atherosclerosis. Therefore, they provided the theory of the OSI to determine the oscillating local of the shear stress. The improved description of oscillatory shear index is provided as [43, 44]:
The results are obtained in coronary bifurcation and at the time of systolic and diastolic peak. In rigid models, with increasing hematocrit, the velocity increases at the outset of the LAD and LCx branches. Maximum velocity at the outset of the LAD branch increased to 32.27% with increasing hematocrit. Velocity reduced with dividing the flow. Considering the angle of deviation of the LCx is greater than the LAD, velocity changes are more in the LCx. The average velocity reduced by 41.57% at the outset of the LCx branch associated with the LAD branch in the HCT 40 model when the systolic peak happens. The velocity profiles become larger with increasing HCT at the outset of the LCx branch. Figure 7 demonstrates the velocity profiles at the entrance of the LAD branch and also at the outset of the LCx branch in various hematocrit when the systolic peak occurs.

Velocity profiles in the branches of LAD and LCx in different hematocrit at the peak systole.
Average velocity in elastic models increased compared to the rigid model. The mean velocity for the LAD and LCx branches in elastic models compared to the rigid model increased 24.61 and 32.16 %, respectively. By increasing the elastic modulus, the mean velocity in the LAD and LCx branches increased 7.79% and 5.54%, respectively. Figure 8 displays the velocity profiles at the peak of the systole at the entrance of the LCx branch and also at the outset of the LAD branch for elastic and rigid models in HCT 40.
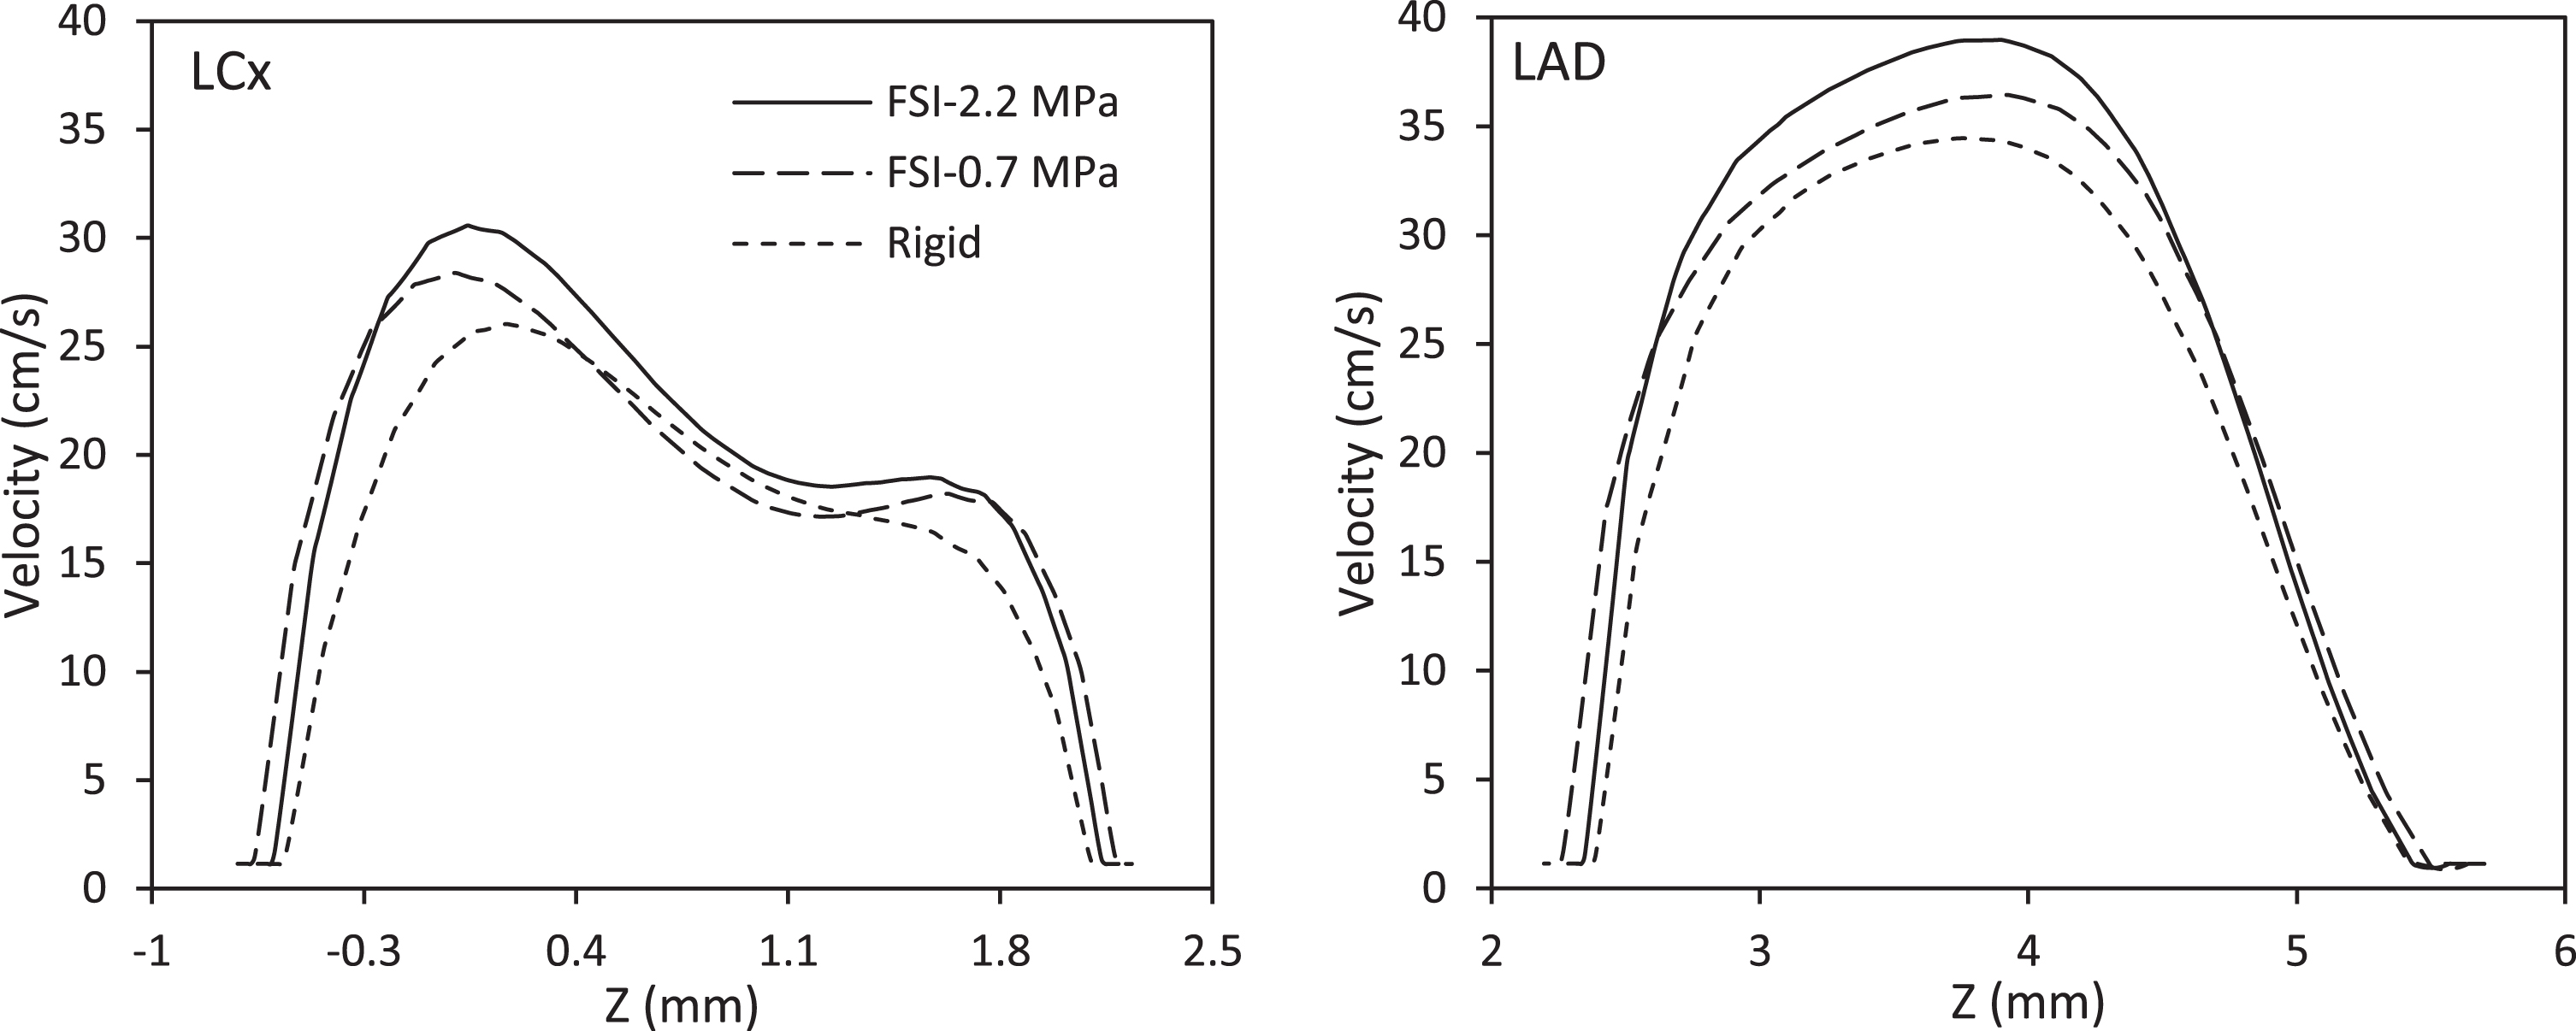
Velocity profiles at the outset of the branches of the LCx and LAD for elastic and rigid models at the peak systole.
The velocity profile is developed at the ending of the LM branch. By increasing hematocrit, the maximum velocity increased from 34 to 40 cm/s in this branch. A slowdown occurred at the beginning of the posterior of the LAD branch by dividing the flow, which is higher in the LCx branch. Figure 9 shows velocity contours in three sections of the coronary artery bifurcation at elastic and rigid models with HCT 40 which mean yield stress is 0.156 Pa at the peak systole.
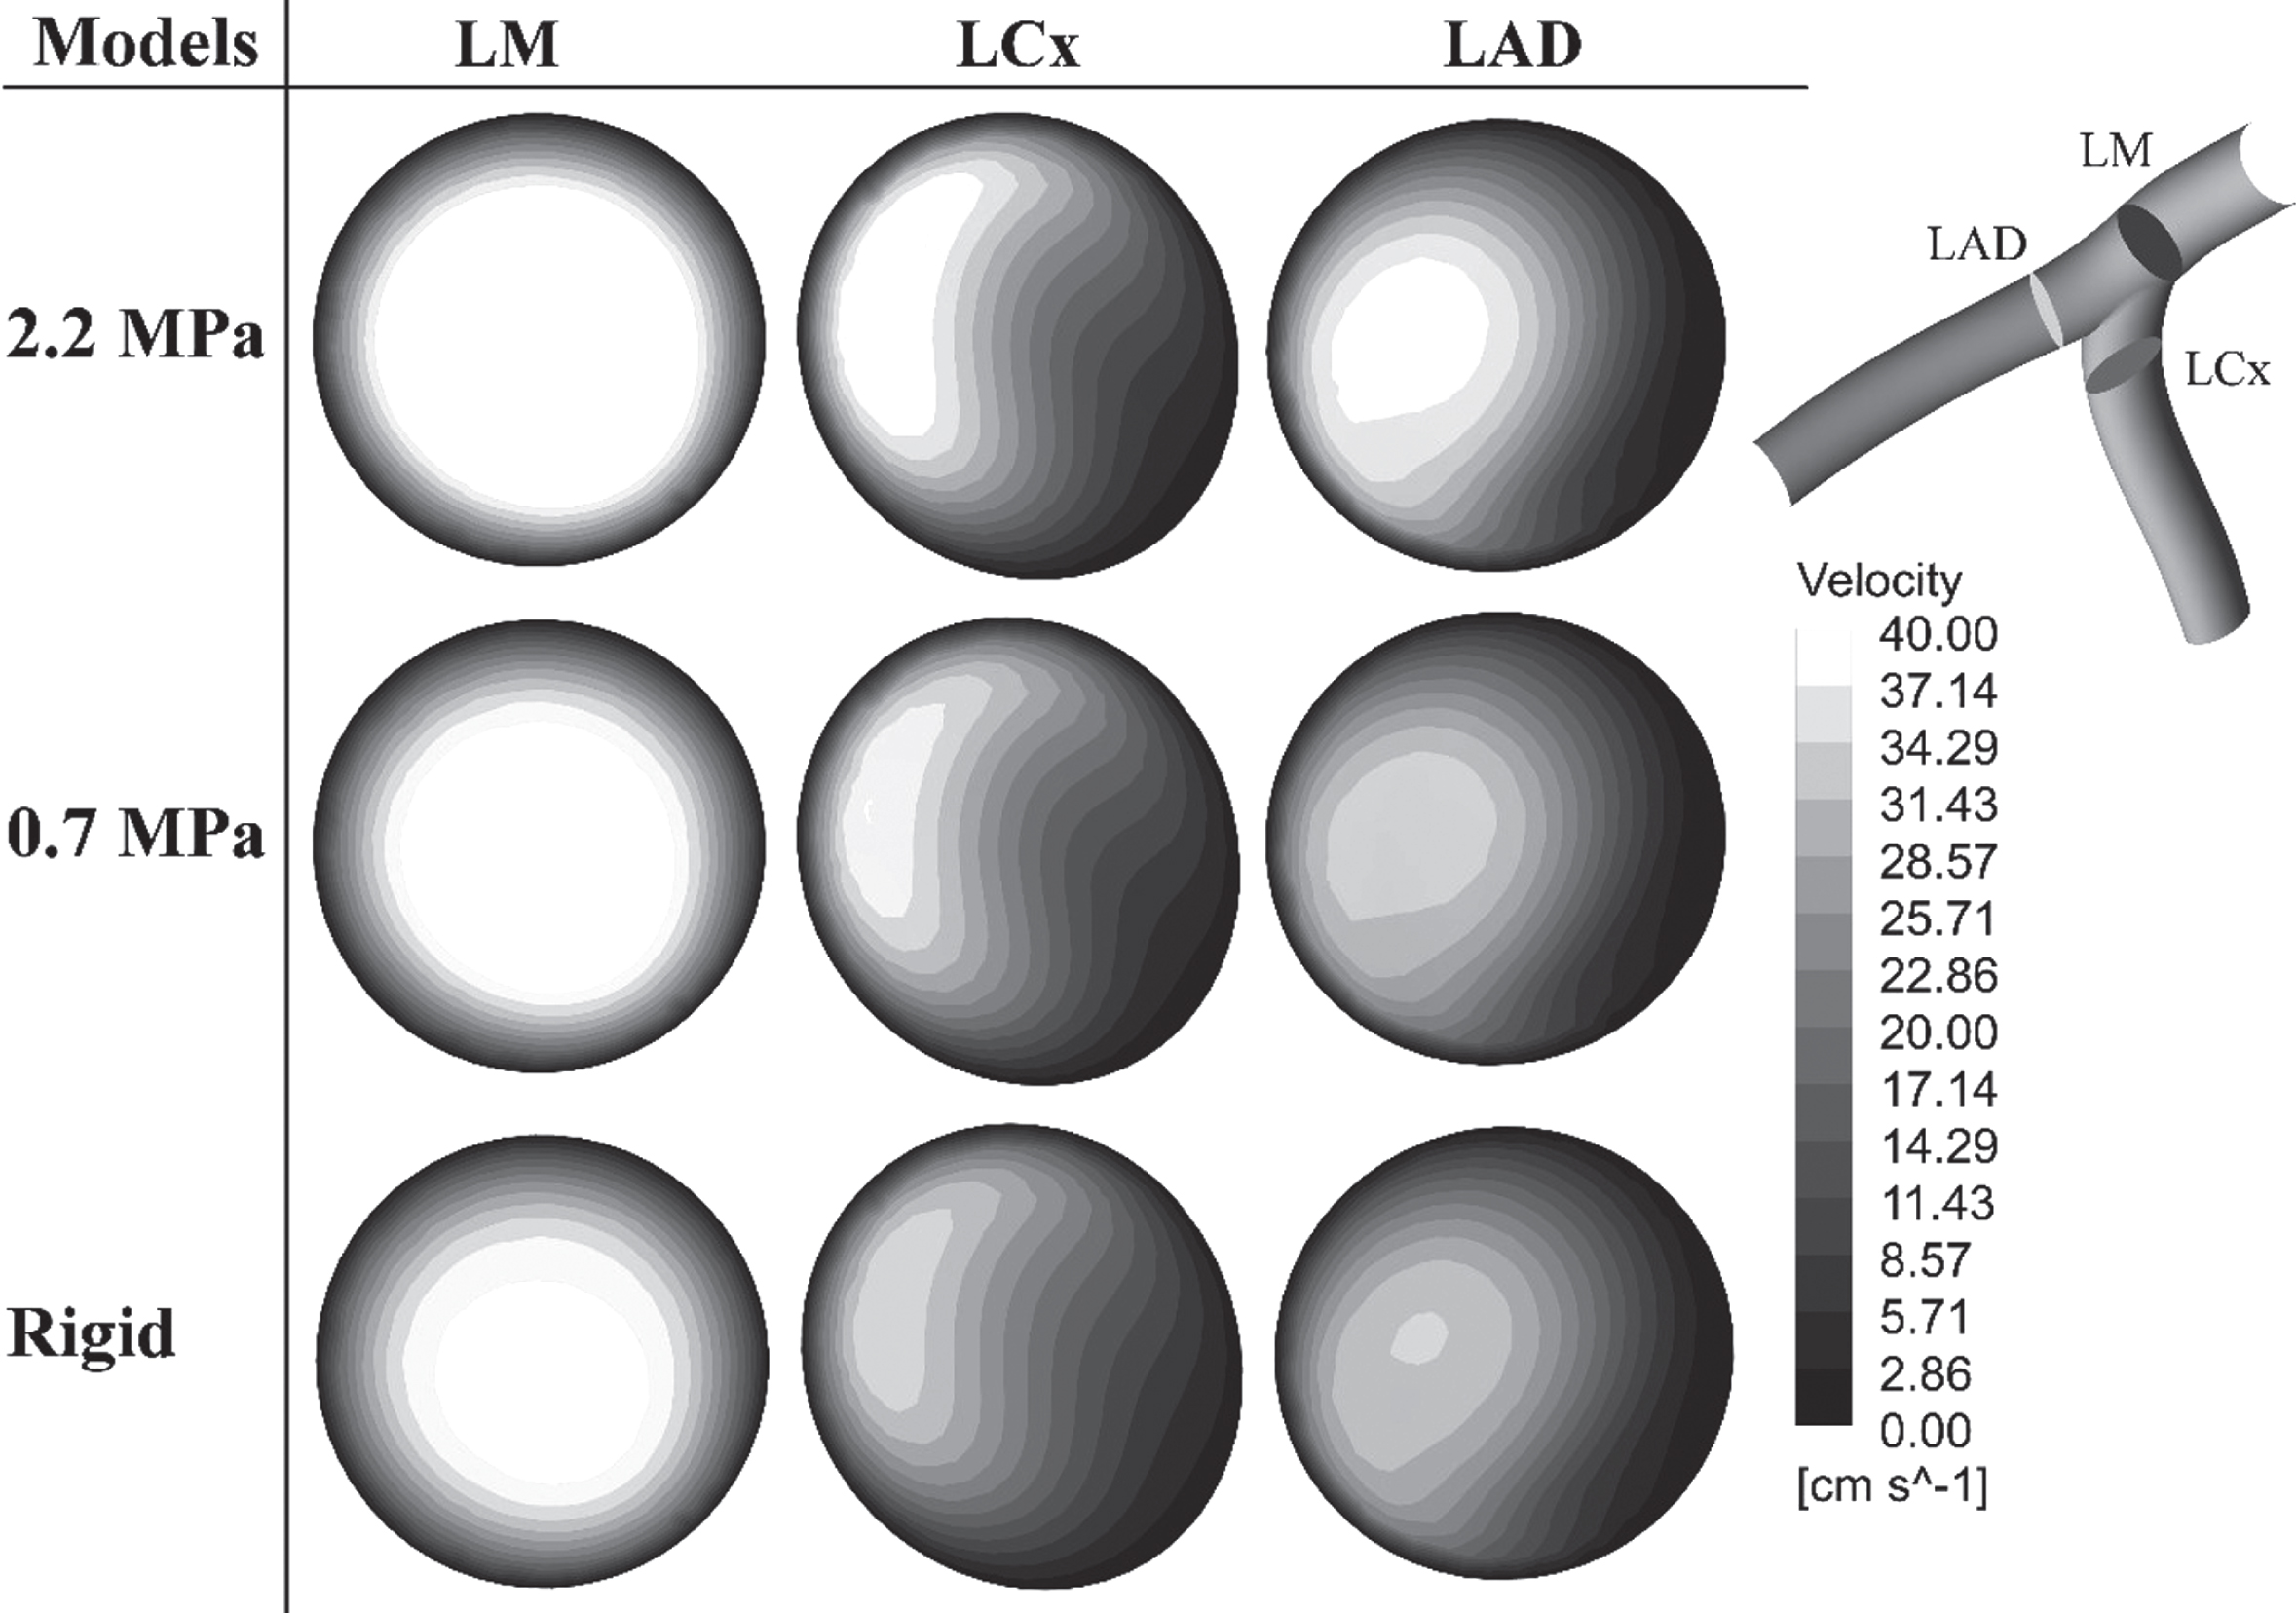
Velocity contours in three coronary cross-sections at elastic and rigid models with HCT 40 at the peak systole.
Shear rate increases with decreasing hematocrit in the posterior region. There are vortex flow and backflow at the entrance of the posterior LAD and also posterior LCx. Figure 10 displays the velocity vectors at the point of flow distribution in various coronary models when the diastolic peak occurs.

Velocity vectors in various models when the diastolic peak occur.
As seen, the backflow and vortex flow reduced by increasing the hematocrit and the elastic module in the LCx branch.
Hematocrit like yield stress is an effective factor in changing wall shear stress. Figure 11 presents the WSS magnitude for various hematocrit at the ending of the LM in a cardiac cycle.
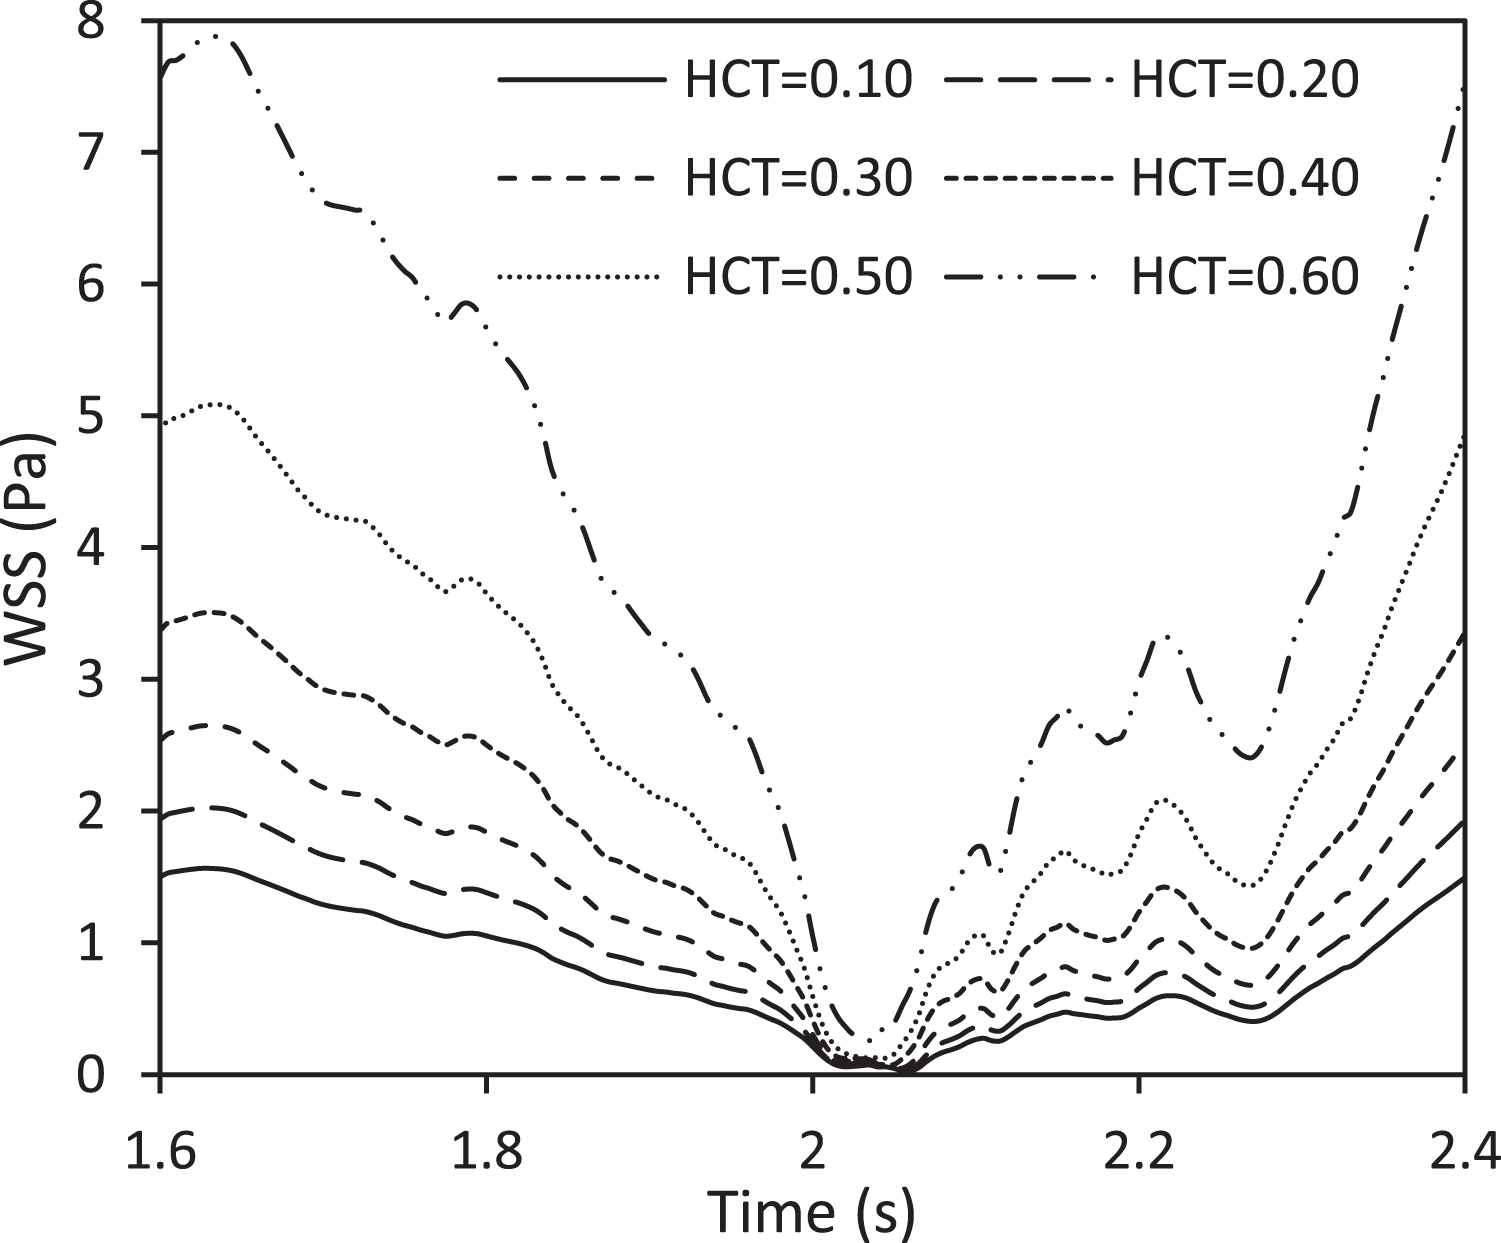
WSS magnitude for various hematocrit at the ending of the LM.
According to the figure, wall shear stress enhanced with increasing hematocrit. WSS increased to 22.42% when the hematocrit grew from 0.1 to 0.2. This growth the yield stress to 1.95E-04 Pa. Moreover, rising hematocrit from 0.5 to 0.6 shear stress progressed to 36.24%. The maximum WSS is 7.88 Pa at the beginning of the systolic phase and in the HCT 0.6 model, which for the models with hematocrit 0.5, 0.4, 0.3, 0.2 and 0.1, the maximum wall shear stress reduced to 5.09, 3.51, 2.65, 2.03 and 1.57 Pa, respectively. Figure 12 displays the WSS magnitude for elastic and rigid models with HCT 0.4 at the end of the LM branch in a cardiac cycle.
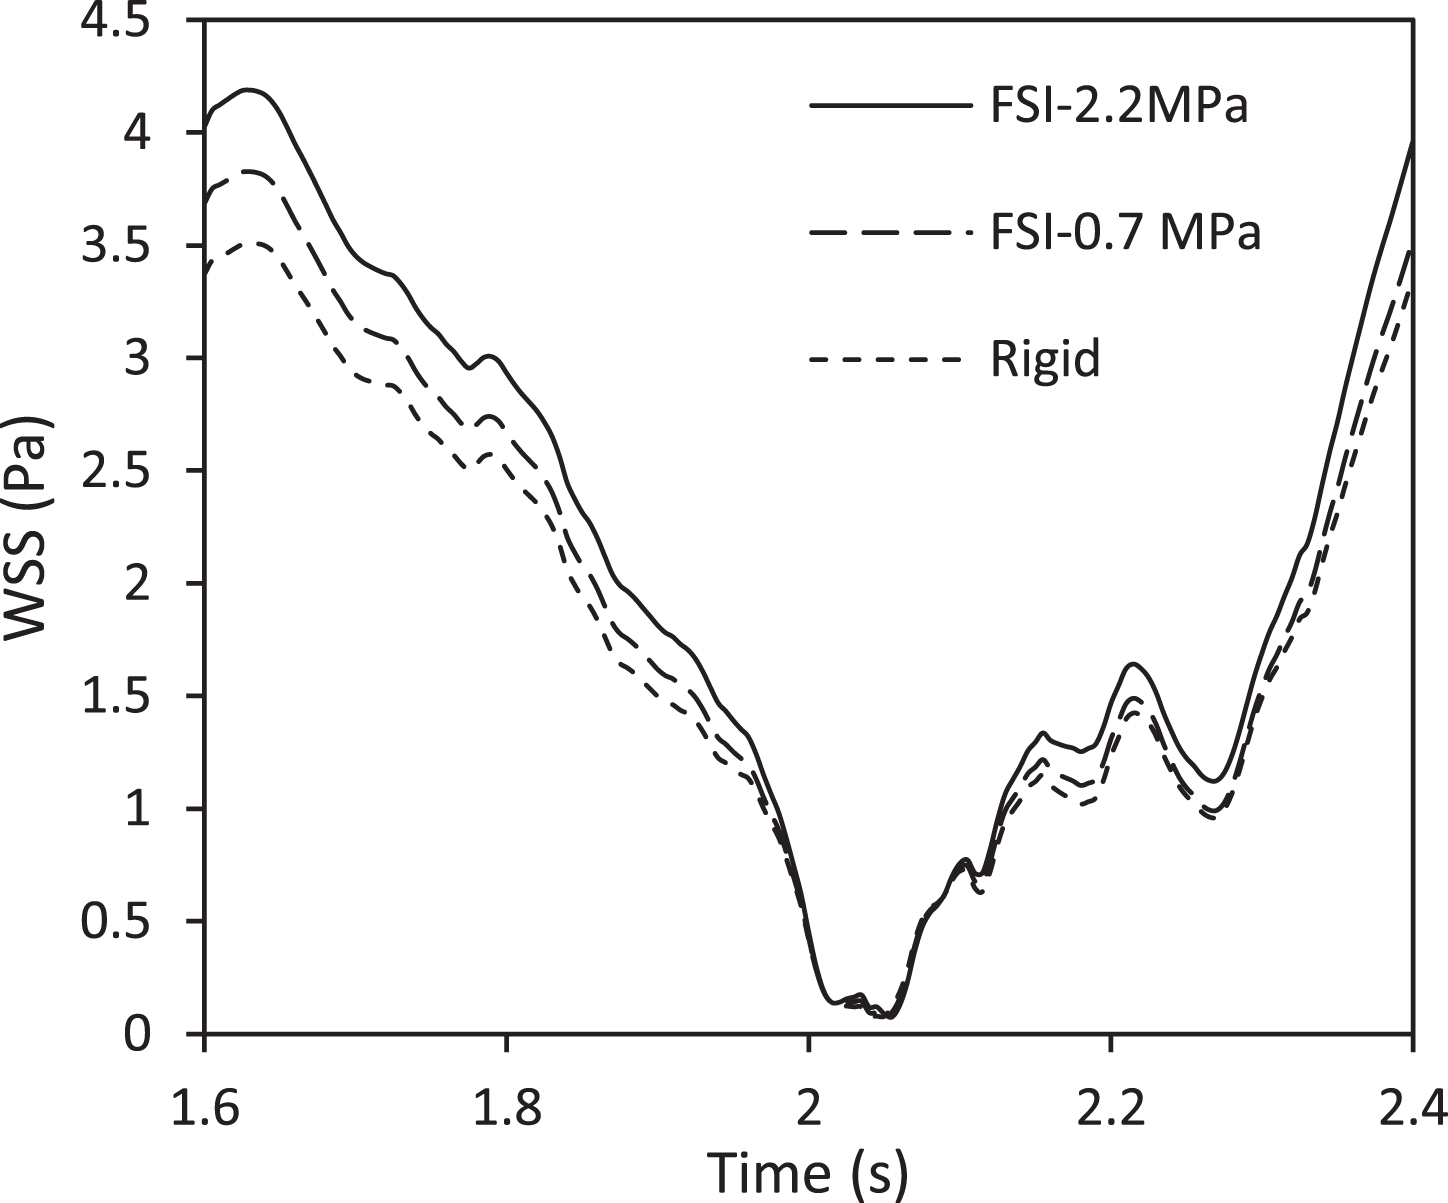
WSS magnitude for elastic and rigid models with HCT 0.4 at the ending of the LM.
The most difference in WSS magnitude between the rigid and elastic models is 17.41% at the ending of the LM branch. While the wall shear stress magnitude reduced to 9.79% in decreasing the elastic modulus. It is expected that the wall shear stress will be reduced by the bifurcating coronary and slowing down at the entrance of the LAD branch and also LCx branch. Figure 13 exhibits the WSS magnitude at the outset of the LCx branch and also the entrance of LAD branch in various hematocrit.
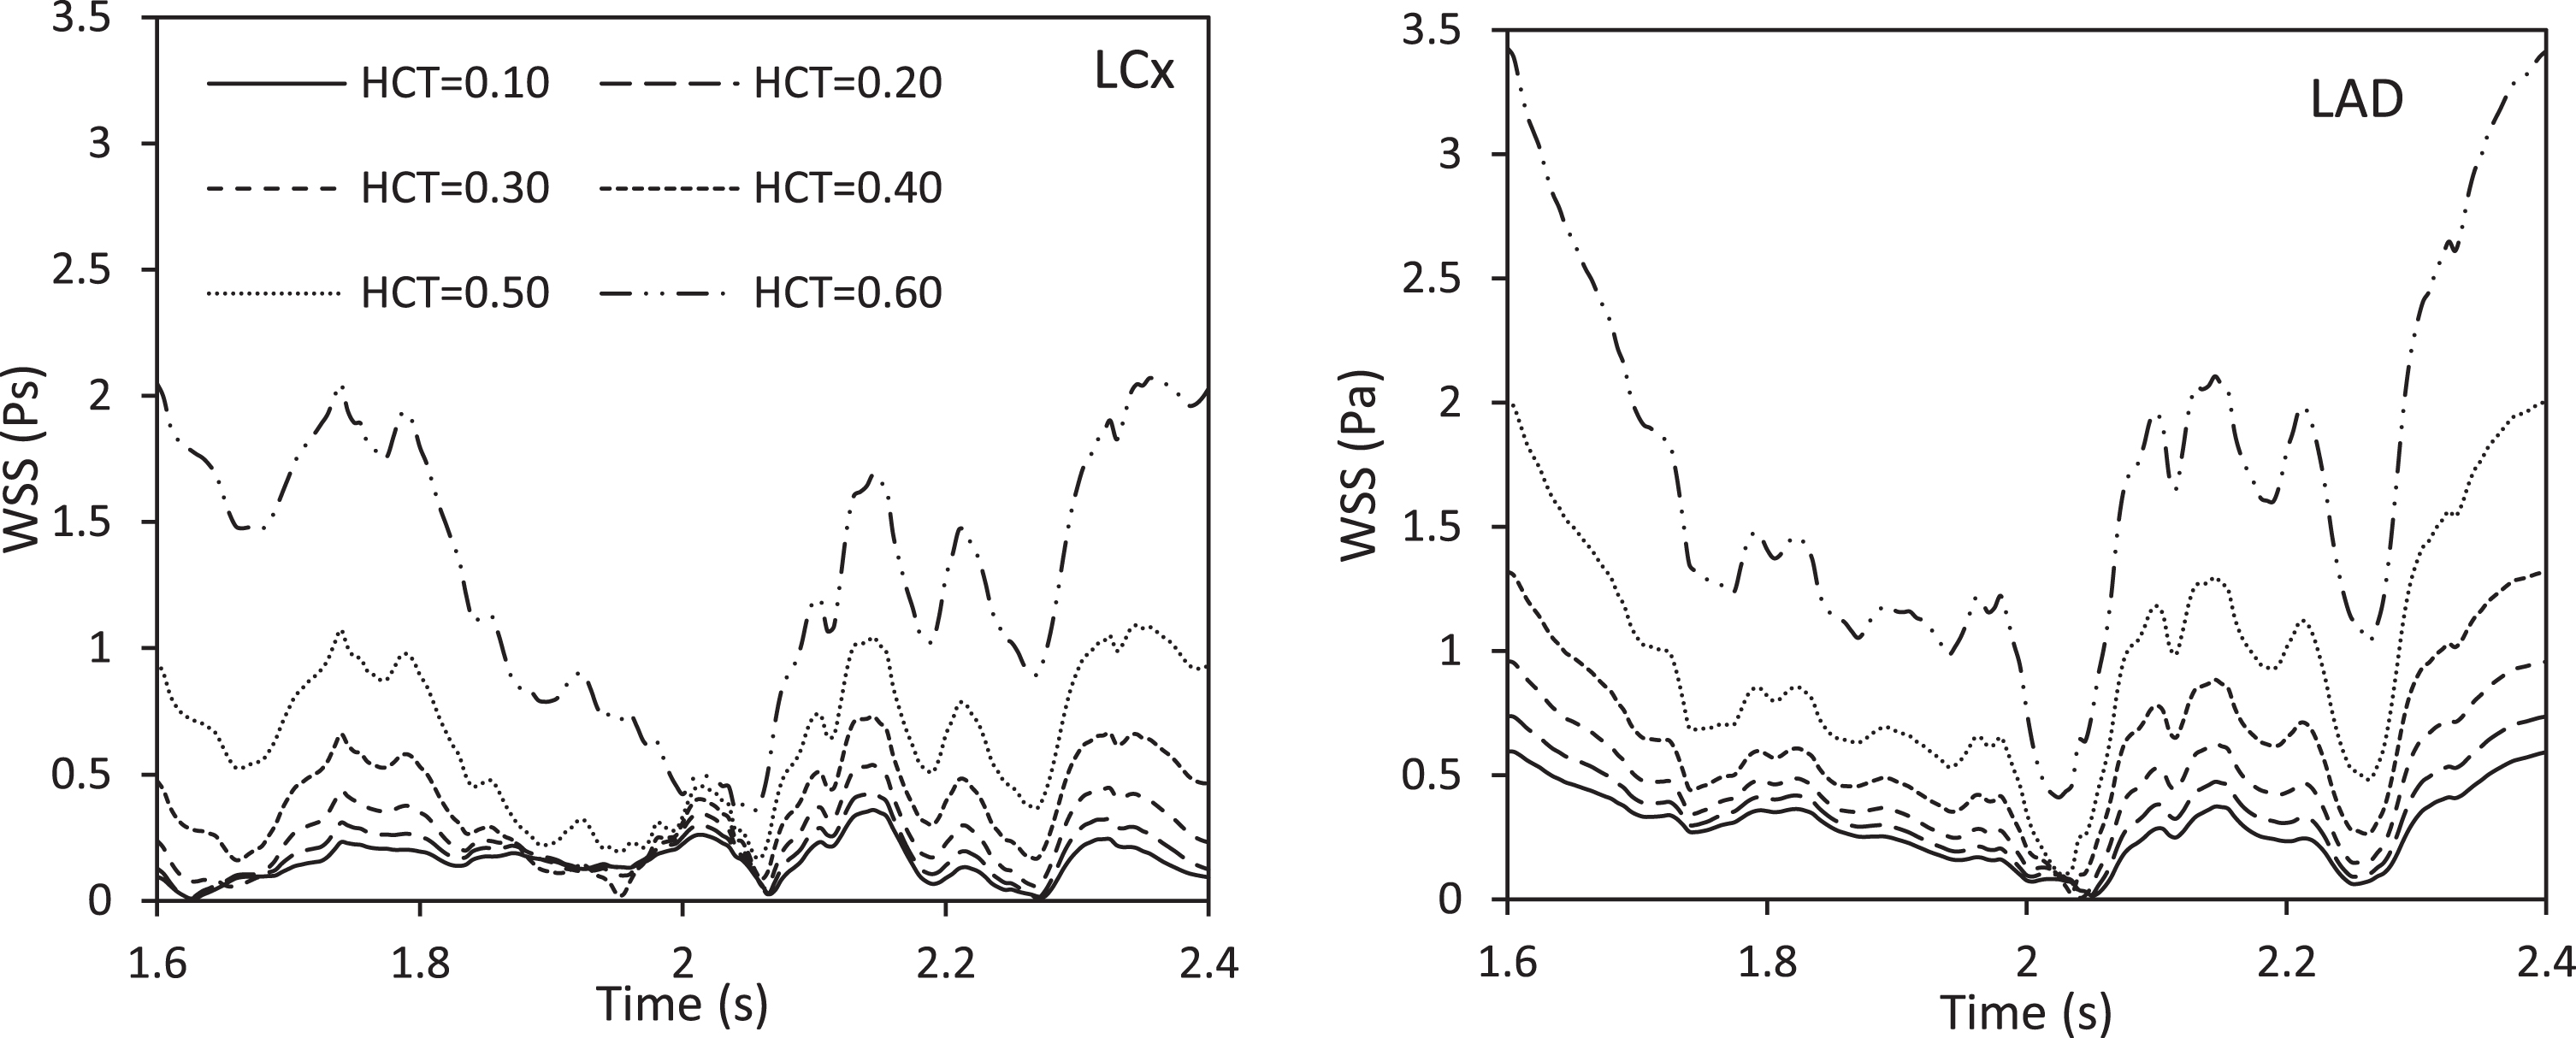
WSS magnitude at the beginning of the LCx and LAD in various hematocrit.
As can be seen, there are low WSS and oscillation at the outset of the LAD branch and also the entrance of LCx branch. The WSS magnitude enhanced to 19.98 and 16.78 percent with increasing hematocrit from 0.1 to 0.2 at the outset of the LAD branch and LCx branch respectively. Also, the increasing hematocrit from 0.5 to 0.6 progressed the WSS magnitude to 52.47% at the outset of the LCx and 42.63% at the beginning of the LAD branch which indicates high yield stress. Figure 14 shows the WSS magnitude for elastic and rigid models with HCT 0.4 at the entrance of the LAD branches and also the outset of LCx branch in a cardiac cycle.

WSS magnitude for elastic and rigid models with HCT 0.4 at the outset of the LCx and LAD branches.
The difference in the wall shear stress magnitude between the rigid and elastic models is 13.03% and 14.04 at the outset of the LCx branch and also beginning of the LAD branch, respectively while, the WSS magnitude decreased to10.25% and 6.49% by reducing the elastic modulus, respectively.
Results in all models show that the low shear stress and its oscillation occur at the entrance to the branches of LAD and LCx. Furthermore, the WSS magnitude is contrary to each other in the posterior and anterior regions. Figure 15 shows the WSS value in the elastic-2.2 MPa model with HCT 0.4 in the posterior and anterior regions. It is observed that the oscillatory and low wall shear stress are more in the posterior area of the coronary arteries. Coronary arteries bifurcation, curvature, and backflow toward the vessels to cause decreased WSS magnitude. The WSS variation in the posterior and anterior is 57.89 and 71.45 percent at the outset of the LCx and LAD, respectively. Due to the directness of the LM branch, the WSS in the posterior and anterior regions of this branch is almost the similarly, and the low vortex flow and backflow in this area are very low.
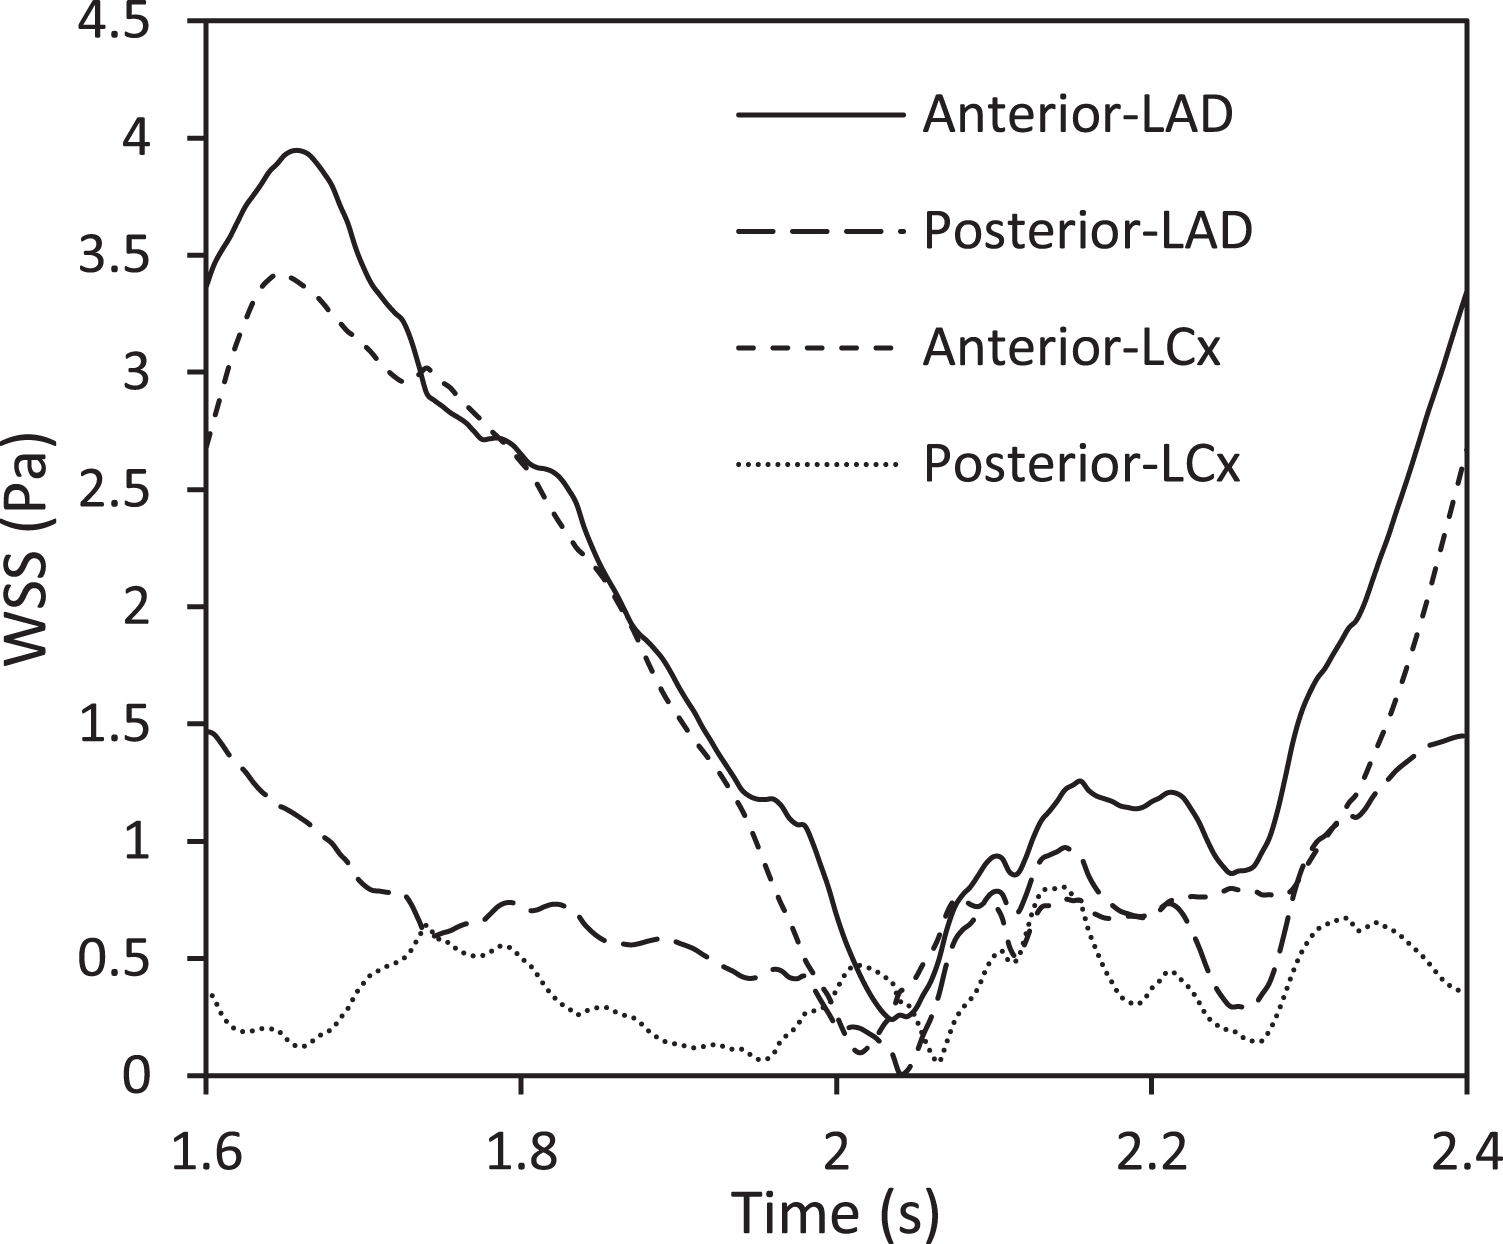
WSS magnitude in the elastic-2.2MPa model with HCT 0.4 in the posterior and anterior regions.
The distribution of WSS is obtained in the left coronary artery. As it is mentioned before, WSS developed with increasing hematocrit or yield stress. Figure 16 displays the WSS contour for various models when the systolic peak occurs.

WSS contour for the various models when the systolic peak happen.
The HCT 0.1 has the lowest shear stress. WSS reaches about 5 Pa with increasing hematocrit up to 30% at the coronary bifurcation. Wall shear stress for HCT 0.1 to 0.3, especially at the beginning of LAD and LCx, is low so that it increases the risk of atherosclerotic plaques. Wall shear stress increased more than 15 Pa in HCT o.5 and 0.6 at the coronary bifurcation area. In these models, wall shear stress is reduced to 3.5 Pa at the outset of the LCx branch and also the entrance of LAD branch. The distribution of shear stress in HCT 0.6 during left coronary arteries reached more than 8 Pa which would accelerate the risk of Thrombosis. The distribution of high shear stress in elastic models is higher than the rigid model with HCT 0.4 in coronary arteries branches. WSS increased more than 6 Pa with increasing the elastic modulus in the coronary arteries. According to the Fig. 16, high shear stress observed regardless of hematocrit in the coronary bifurcation area. In these regions, endothelial cells dysfunction develop. WSS is less than 1 Pa in all models when the diastolic peak happens. Therefore, the OSI can be evinced WSS independently of time as a hemodynamic parameter.
High OSI shows the oscillatory and low shear stress that is considered a high-risk area. Figure 17 displays the Oscillatory shear index contour for the different models. The highest OSI occurred due to backflow and downstream in the coronary bifurcation at the outset of the LCx branch and then quickly reduced. Shear stress oscillation increase with decreasing hematocrit and resulting in higher OSI values. Reducing the OSI at the outset of the LAD branch represents a high WSS and established remodeling of the vessel without variations in the atheroma plaque.
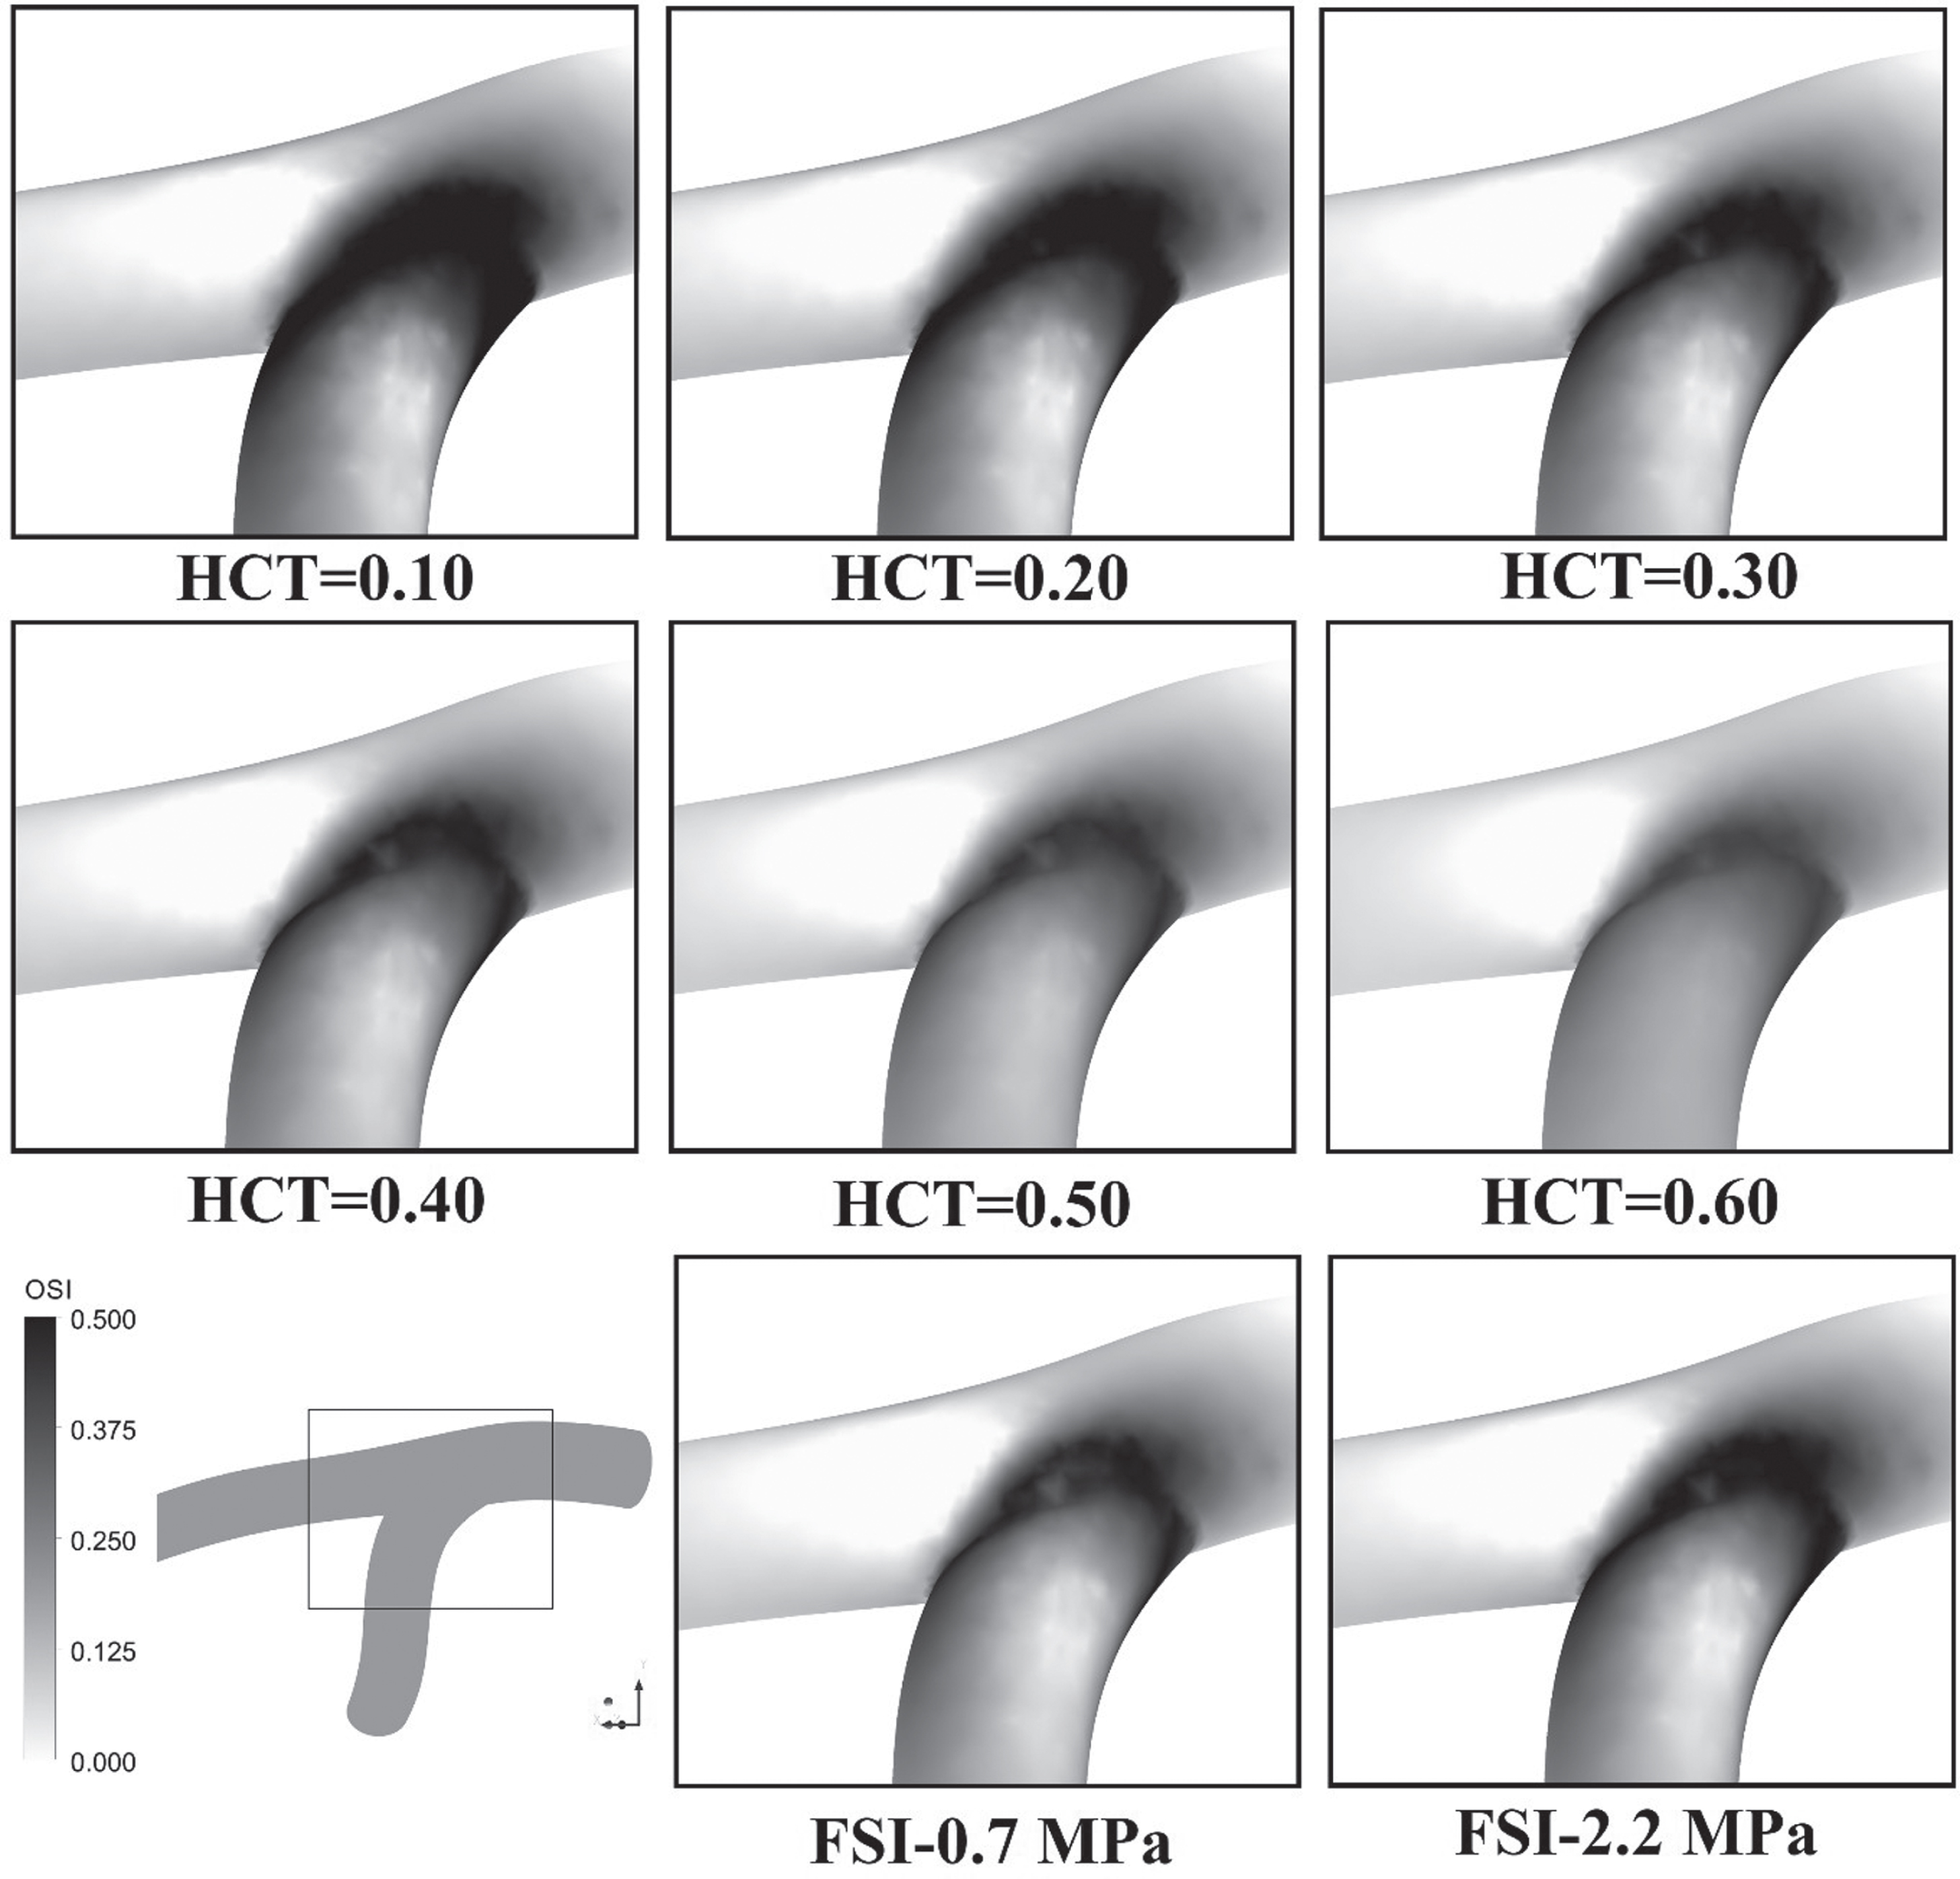
OSI contour for the various models.
In this simulation, a three-dimensional pulsatile and non-Newtonian flow was examined in rigid and elastic coronary arteries with different hematocrit. Clinical and experimental studies have proved that the WSS and its oscillatory show a significant role in the performance of plaque and endothelial cells. [6, 46]. The use of 2D geometry cannot show secondary flows in curved arteries [47]. Numerical studies in previous years have shown that WSS is very different before and after bifurcation and these areas are most at risk for atherosclerosis [8, 48]. By dividing the flow, the highest difference in mean velocity occurred at the entrance of the branch of the LCx and also the beginning of the LAD branch in HCT 30 and the lowest in HCT 60. In the experimental studies have shown that both of the high and low WSS affect the level of endothelial cells, but the low shear stress between 1.0 and 1.5 Pa causes cell proliferation and ultimately produces atherosclerotic plaques on the wall, which are consistent with numerical solving in this research [6, 49]. In the non-Newtonian Casson model, shear rate and hematocrit are considered as independent variables that directly affect viscosity [47]. On the other hand, studies show that the decrease in blood viscosity at high shear rate lead to CAD progression and cell-cell interaction [16, 50]. In other words, the backflow and vortex flow in the LCx branch are less with increasing hematocrit and elastic modulus. Previous studies have determined 25% variation between WSS in the elastic vessels and rigid ones which this difference was observed in the results of this study [25]. Low and oscillatory of WSS occur at the bifurcation and in the back region of the coronary arteries due to the backflow and vortex flow. High WSS occurred at the top of the bifurcation at high hematocrit, which decreases the amount of WSS by reducing hematocrit and returns to normal. Given that WSS has the lowest amount of diastole and represents atherosclerosis, OSI can be considered as an indicator for this disease. In all cases, the OSI has the highest value in the bifurcation areas, especially at the beginning of LCx which designates the oscillation of the WSS. As a result, these areas are a place for the production of atherosclerotic plaques, especially in low hematocrit.
For future investigations, it is possible to use various models such as viscoelastic wall to improve wall elasticity. It also examined the effects of mass transfer in various hematocrits in coronary artery bifurcation with stenosis.
Conflict of interest
The authors declare no conflict of interest.
Footnotes
Acknowledgment
We would like to appreciate the chief, editor and reviewers of this journal for examining our paper. This study was conducted with the support of Dr. Mahmoud Norouzi in the High-Performance Computing (HPC) Laboratory, Department of Mechanical Engineering, Shahrood University of technology.