
Abstract
Cell metabolism decides the state of cells in division, differentiation and growth, maintaining intracellular balance. Monitoring the metabolic behavior of cells is of great significance to study the development of diseases in cell levels. Surface-enhanced Raman spectroscopy (SERS) is a powerful technique to detect and quantify analytes in extremely low concentration. Combined with SRES technology, we can monitor the concentration of metabolites in live cells and thus study the biological behavior of cells. In this work, Raman-tag labelled Au@ZIF-8 nanoparticles were used to monitor the distribution of reactive oxygen species (ROS) in SKOV3 cells. With the help of the ultrasensitive Raman enhancement material, the distribution of ROS in SKOV3 cells was mapped, the results were further confirmed in the fluorescent images. The SERS platform provides an ultrasensitive monitoring method of ROS distribution, which may offer an opportunity for real-time monitoring the cell metabolism in the cell biology applications.
Introduction
As cell grows, proliferate and differentiate, monitoring intracellular metabolism is of great significance for the occurrence and development of diseases, especially for cancer [1]. Moreover, high-throughput sequencing data has been used to analyze the mutations leading to tumorigenesis, the technology offered even more numerous and heterogeneous than previously thought [2–4]. Metabolic abnormalities reflect the unnormal levels of gene, protein and other species in cells. Tumors display altered metabolism compared with normal tissues [5]. Moreover, molecular biological techniques were adopted to detect the marker molecules related to apoptosis and oxidative stress for the mechanism of the TLR4/NF-κB pathway in the cerebral small vascular disease [6]. For example reactive oxygen species (ROS), produced primarily by the mitochondria as a by-product of normal metabolism in cells, which have significant relationship between apoptosis [7]. Glutathione (GSH) is the most abundant non-protein thiol in cells, which plays an important role in scavenging the ROS to regulate the apoptosis of cancer cells. Ovarian cancer (OC) is the seventh most commonly diagnosed cancer among women in the world and the tenth most common in China [8]. Epithelial OC is the most predominant pathologic subtype, and the SKOV3 cells are widely used to study OC [9]. Platinum (II) (Pt(II))-based anticancer drugs dominate the chemotherapy field of ovarian cancer to consume GSH and overproduce ROS in tumor cells [10, 11]. Researches have proven that the increase of intracellular ROS levels in SKOV3 cells lead to DNA damage along with upregulating the apoptotic gene levels [12, 13]. Therefore, monitoring the levels of ROS in cells are of great importance to study the apoptosis of cancer cells.
Surface-enhanced Raman scattering (SERS) is an ultrasensitive spectroscopic technique to detect and quantify analytes down to even several molecules through identifying specific molecular vibrational fingerprints [14, 15]. As is well known, it is difficult to detect Raman signals due to its intrinsic smaller scattering cross-section compared with fluorescence. To enhance Raman signals, several metals of Ag, Au, Cu, were mostly used as SERS substrates with incoming light to induce localized surface plasmon resonances (LSPRs) and that is known as electromagnetic (EM) mechanism. EM contributes the main SERS signal enhancement and high enhancement factor (EF) of 103–108 was obtained. Chemical enhancement (CM) is typically explained by the charge transfer (CT) mechanism. When a molecule is adsorbed on a metal surface, new electronic states are formed because of chemisorption.[16] Under laser irradiation, electrons transfer to molecules that were adsorbed on the substrate surface, which caused the enhanced polarizability and SERS signals. EF of 10–103 can be reached via the chemical mechanism [14]. Liquid chromatography–mass spectrometry (LC-MS) analysis generates semiquantitative results, requires long screening time, and has limited sensitivity, thus hindering the use of metabolomics for point-of-care risk stratification for spontaneous miscarriage. SERS technique can detect metabolites from patient samples at ultratrace levels implies the potential application of our SERS platform as a noninvasive point-of-care screening technology for other diseases and conditions in the broad field of metabolomics [17].
Noble metals are the mostly used and studied SERS substrates for the excellent enhancement performance [18, 19]. To boost the SERS signals from analytes, hot spots are widely used with the help of nanostructures made up of metal crystals aggregates when nanoparticles get close enough to each other, the EF generated by hot spots is much higher than that of a single nanoparticle even without considering the LSPR effect [20]. EF of 1011 can be achieved with an appropriate gap size [21], which bring possibilities for single-molecule detection in biochemistry, clinical diagnosis and bioimaging [22–25]. Besides, Metal–organic frameworks (MOFs), especially Zeolitic imidazolate framework-8 (ZIF-8), have recently received considerably wide attention as an attractive solid substrate or coating material because the highly tunable MOF framework can not only serve as an inert host but also enhance the selectivity [26, 27], stability [28, 29], and/or activity of the enzymes or molecules [30].
In this work, we developed the Raman-tag labelled Au@ZIF-8 substrate for ultrasensitive ROS mapping. With the help of the most studied noble metals, Raman signals near the substrates were greatly enhanced. As shown in Scheme 1, Au and Au@ZIF-8 were first synthesized and then decorated with Raman-tag. After coating ZIF-8, the 4-Mercaptobenzoic acid (4-MBA) was introduced and then incubated with SKOV3 cell for different times. The labelled molecule was successfully anchored on Au nanoparticle surface and the Au-Mercapto bonds was stable even incubated for 24 h in acid conditions. After incubated with SKOV3 cells, strong Raman signals were detected in SKOV3 cells. Raman mapping was then performed, the ROS distribution was mapped, and the ROS area was further confirmed with fluorescent images tested by ROS assay kit.
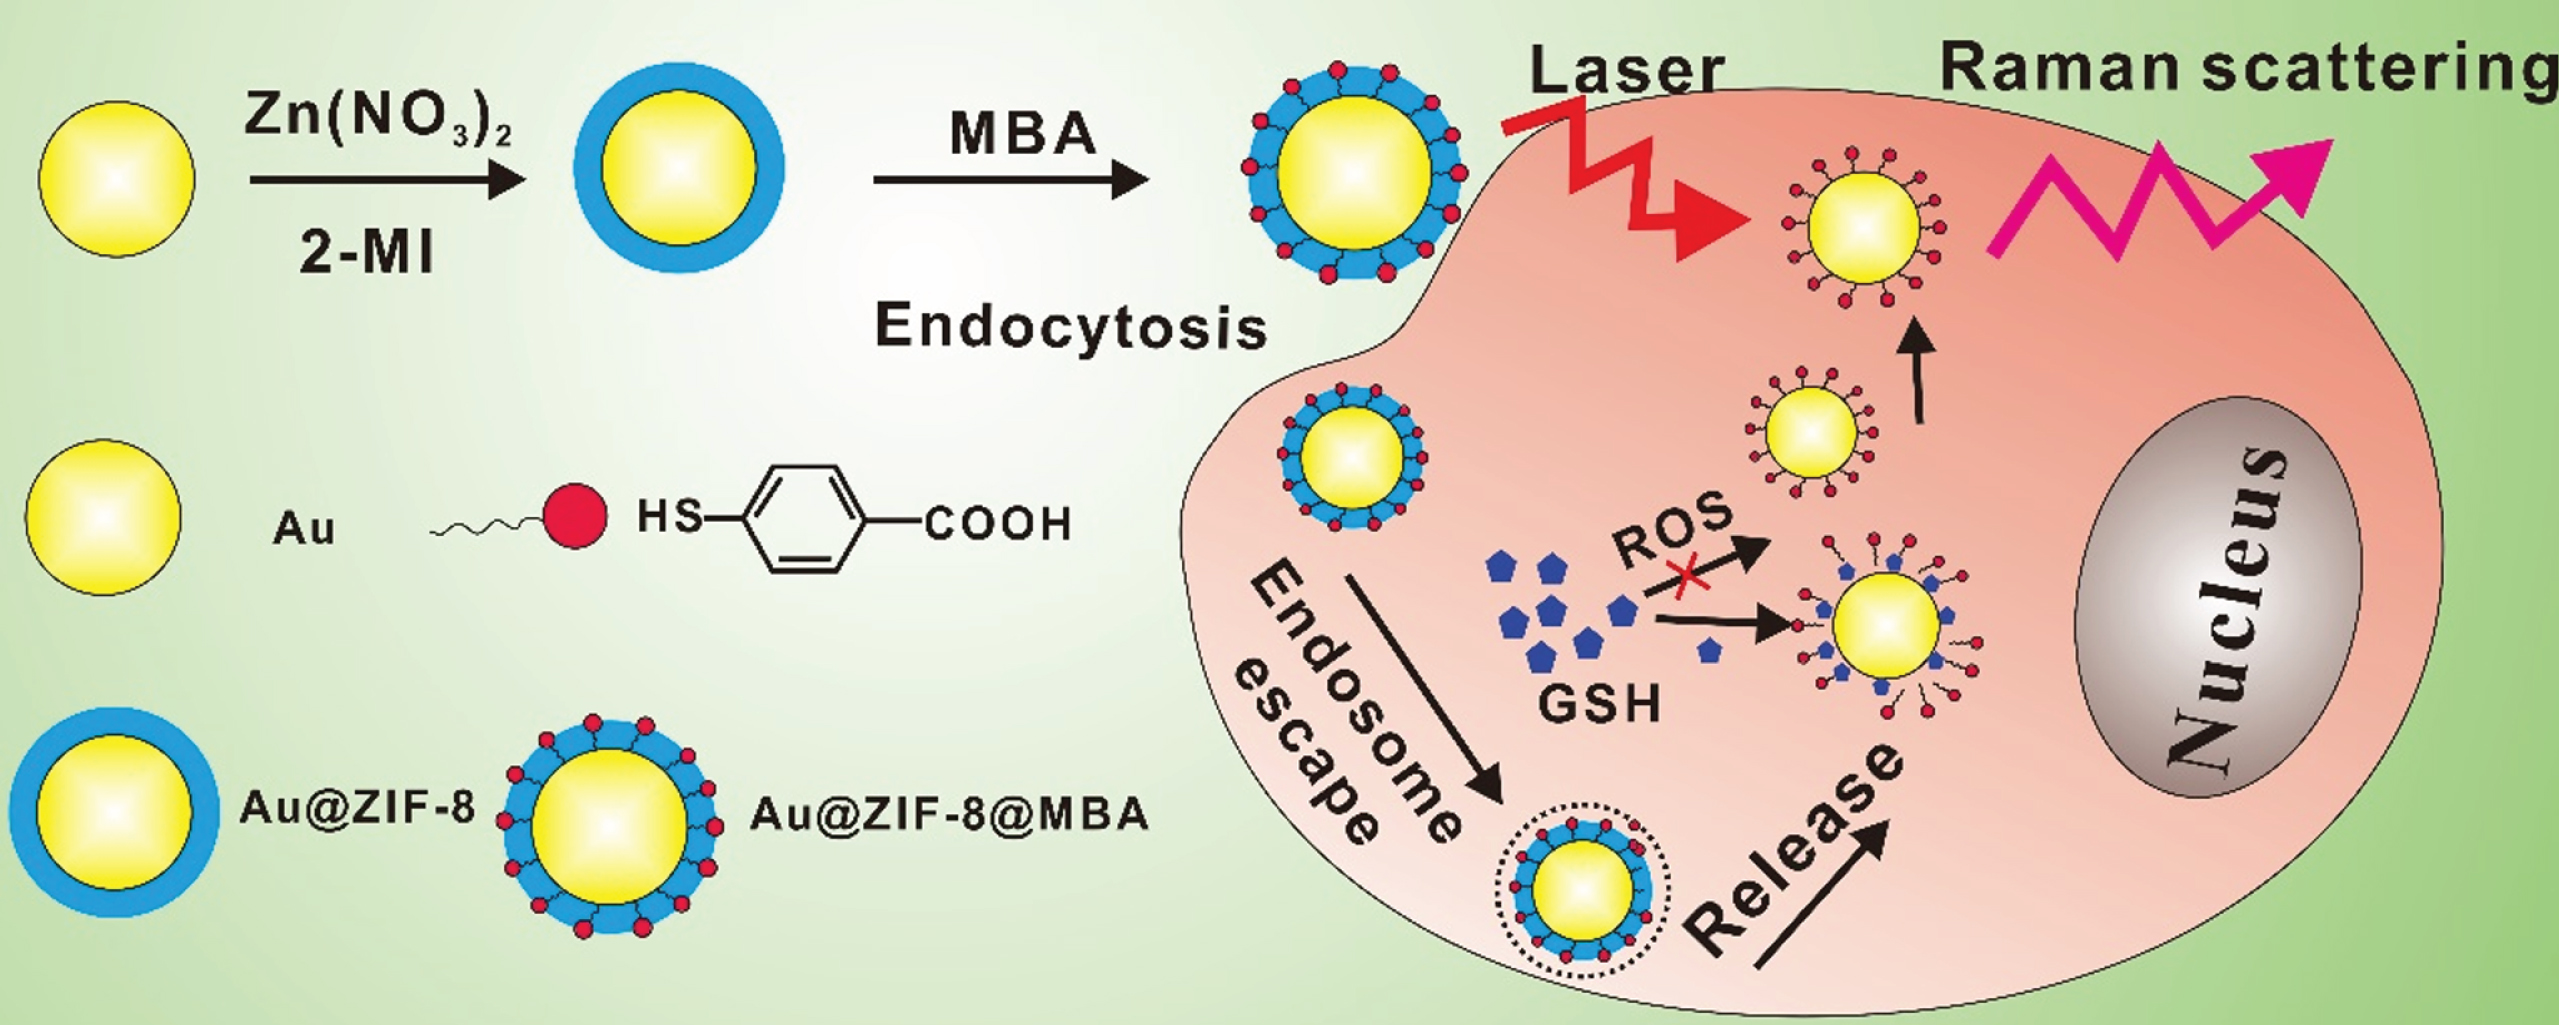
Schematic image of preparing Au@ZIF-8@MBA and the mechanism of monitoring ROS in cells.
Materials
2-Methylimidazole was purchased from Sigma Aldrich. Zinc nitrate hexahydrate (Zn(NO3)2) was purchased from Sinopharm Chemical Reagent Co. Ltd. (China), HAuCl4 (48∼50%), Rhodamine 6G (R6G), 4- Mercaptobenzoic acid (MBA) were purchased from MACKLIN. ROS assay kit was purchased from Beyotime. All chemicals were used as received without further purification.
Preparation of 50 nm Au nanoparticles
The 50 nm Au nanoparticles were prepared as previously reported [31]. 50 mL deionized water contained 60μL 0.1 M HAuCl4 solution in 200 mL three-neck flask was heated to boil with reflux condenser. Then 350μL 1% Na3-citrate (by weight) aqueous solution was added in the boiling solution and heated for another 1 hour. The 50 nm Au nanoparticles were collected through centrifugation for 30 min at 4000 rpm and redispersed in 5 mL deionized water.
Synthesis of ZIF-8
ZIF-8 was synthesized as previously reported [32]. 2-methylimidazole (2.64 g) in 200 mL methanol and Zn(NO3)2·6H2O (2.26 g) in 200 mL methanol were well dissolved after 5 min of ultrasonication and then cooled to ∼15°C. The prepared Zn(NO3)2 solution was poured into 2-methylimidazole solution evenly, and then stirred for 10 min. The reaction solution was then placed evenly at room temperature for 10 h.The product was obtained by centrifugation and washed with ethanol for three times to remove the unreacted reagents.
Preparation of Au@ZIF-8
The Au@ZIF-8 was fabricated as previously reported [33]. Typically, 1 mL of an aqueous solution of 2-methylimidazole (1.32 M) was first mixed with 0.144 mL Hexadecyl trimethyl ammonium Bromide (CTAB, 1 mM), after that, 1 mL of an aqueous solution of Zn(NO3)2·6H2O (24 mM) and 1 mL of washed 50 nm Au nanoparticles were added sequentially to the above solution. After gently stirring for 5 min, the solution was left undisturbed at room temperature for 3 h. The obtained core–shell Au@ZIF-8 particles were centrifuged at 5000 rpm for 10 min and the precipitate was redispersed in methanol (10 mL), centrifuged at 5000 rpm for 5 min and finally redispersed in methanol (5 mL).
ROS fluorescent measurement
This method is only applicable to adherent culture cells. DCFH-DA was diluted with serum-free medium at 1 : 1000 to a final concentration of 10μM/L. Remove the cell culture medium and then add the diluted DCFH-DA. The volume added should cover the cells and incubate in a 37°C cell incubator for 20 minutes. The cells were then washed three times with serum-free cell culture medium to sufficiently remove DCFH-DA that did not enter the cells.
Measurement of SERS performance of Au nanoparticles
Different concentration of R6G solutions were prepared by dissolving solid R6G powder in deionized water to form a 10–2 M solution and then diluted to certain concentrations. The MBA solutions were prepared by dissolving solid MBA in absolute ethyl alcohol and then dilute to certain concentrations. To observe SERS performance, 1μL R6G or MBA solution mixed with 10μL Au nanoparticles were drop-casted on the glass slide. Raman signals were obtained at 0.05 mW 10 s exposure time at 633 nm. The Raman signals were obtained from at last 3 different points in each sample.
Characterizations
The morphology of Au and ZIF-8 nanoparticles was characterized by field emission scanning electron microscopy (FE-SEM, Hitachi, S-4800). The element distribution and TEM images were collected by high-resolution transmission electron microscopy (HRTEM, FEI, Talos F200S). Raman spectrum and Raman mapping were obtained by Laser Raman Spectrometer (inVia Reflex).
Results and discussions
According to the SEM images, ZIF-8 nanoparticles were successfully synthesized (Fig. 1a) with diameter of ∼50 nm. As can be seen in Fig. 1b, c, Au nanoparticles with a uniform diameter of ∼50 nm were obtained. Au@ZIF-8 nanoparticles were synthesized through mixing the Au solution with 2-methylimidazole and Zn(NO3)2 solution. After growth of ZIF-8 layer, Au nanoparticle was encapsulated in the core of Au@ZIF-8. As shown in Fig. 1d, the ZIF-8 layer is about 30 nm. Then, the MBA molecule was introduced to the surface of Au@ZIF-8 by the interaction of mercapto with Au.

Characterization of ZIF-8, Au, Au@ZIF-8, a) SEM image of ZIF-8, b) SEM image of Au nanoparticles, c) TEM of Au nanoparticles, d) TEM of Au@ZIF-8 nanoparticles.
Rhodamine 6G (R6G) was used to evaluate the SERS performance by drop-casting 1μLR6G solutions on dried Au nanoparticles on glass slides. As shown in Fig. 2a, the Au nanoparticles showed excellent SERS performance in the detection of R6G, detection limit of 10–10 M was achieved. Furthermore, distinct peaks (614, 1360, 1573, 1650 cm–1) can be obviously observed even at the concentration of 10–10 M. Besides, the MBA molecule was also used to observe the SERS performance of Au nanoparticles. As shown in Fig. 2b, detection limit of 10–6 M was achieved. At concentration of 10–6 M, distinct peaks of 1096 and 1595 cm–1 can be clearly identified. As for the smaller scattering cross-section of MBA than R6G, Raman signals of R6G are stronger than MBA at the same concentration. Nevertheless, the Au nanoparticles showed excellent SERS performance toward MBA. Furthermore, the unique Au-mercapto bonds between Au and MBA made MBA an ideal candidate as a tag for Raman applications. In this work, MBA was used as Raman-tag anchored on the Au nanoparticles for monitoring ROS distribution in cells.
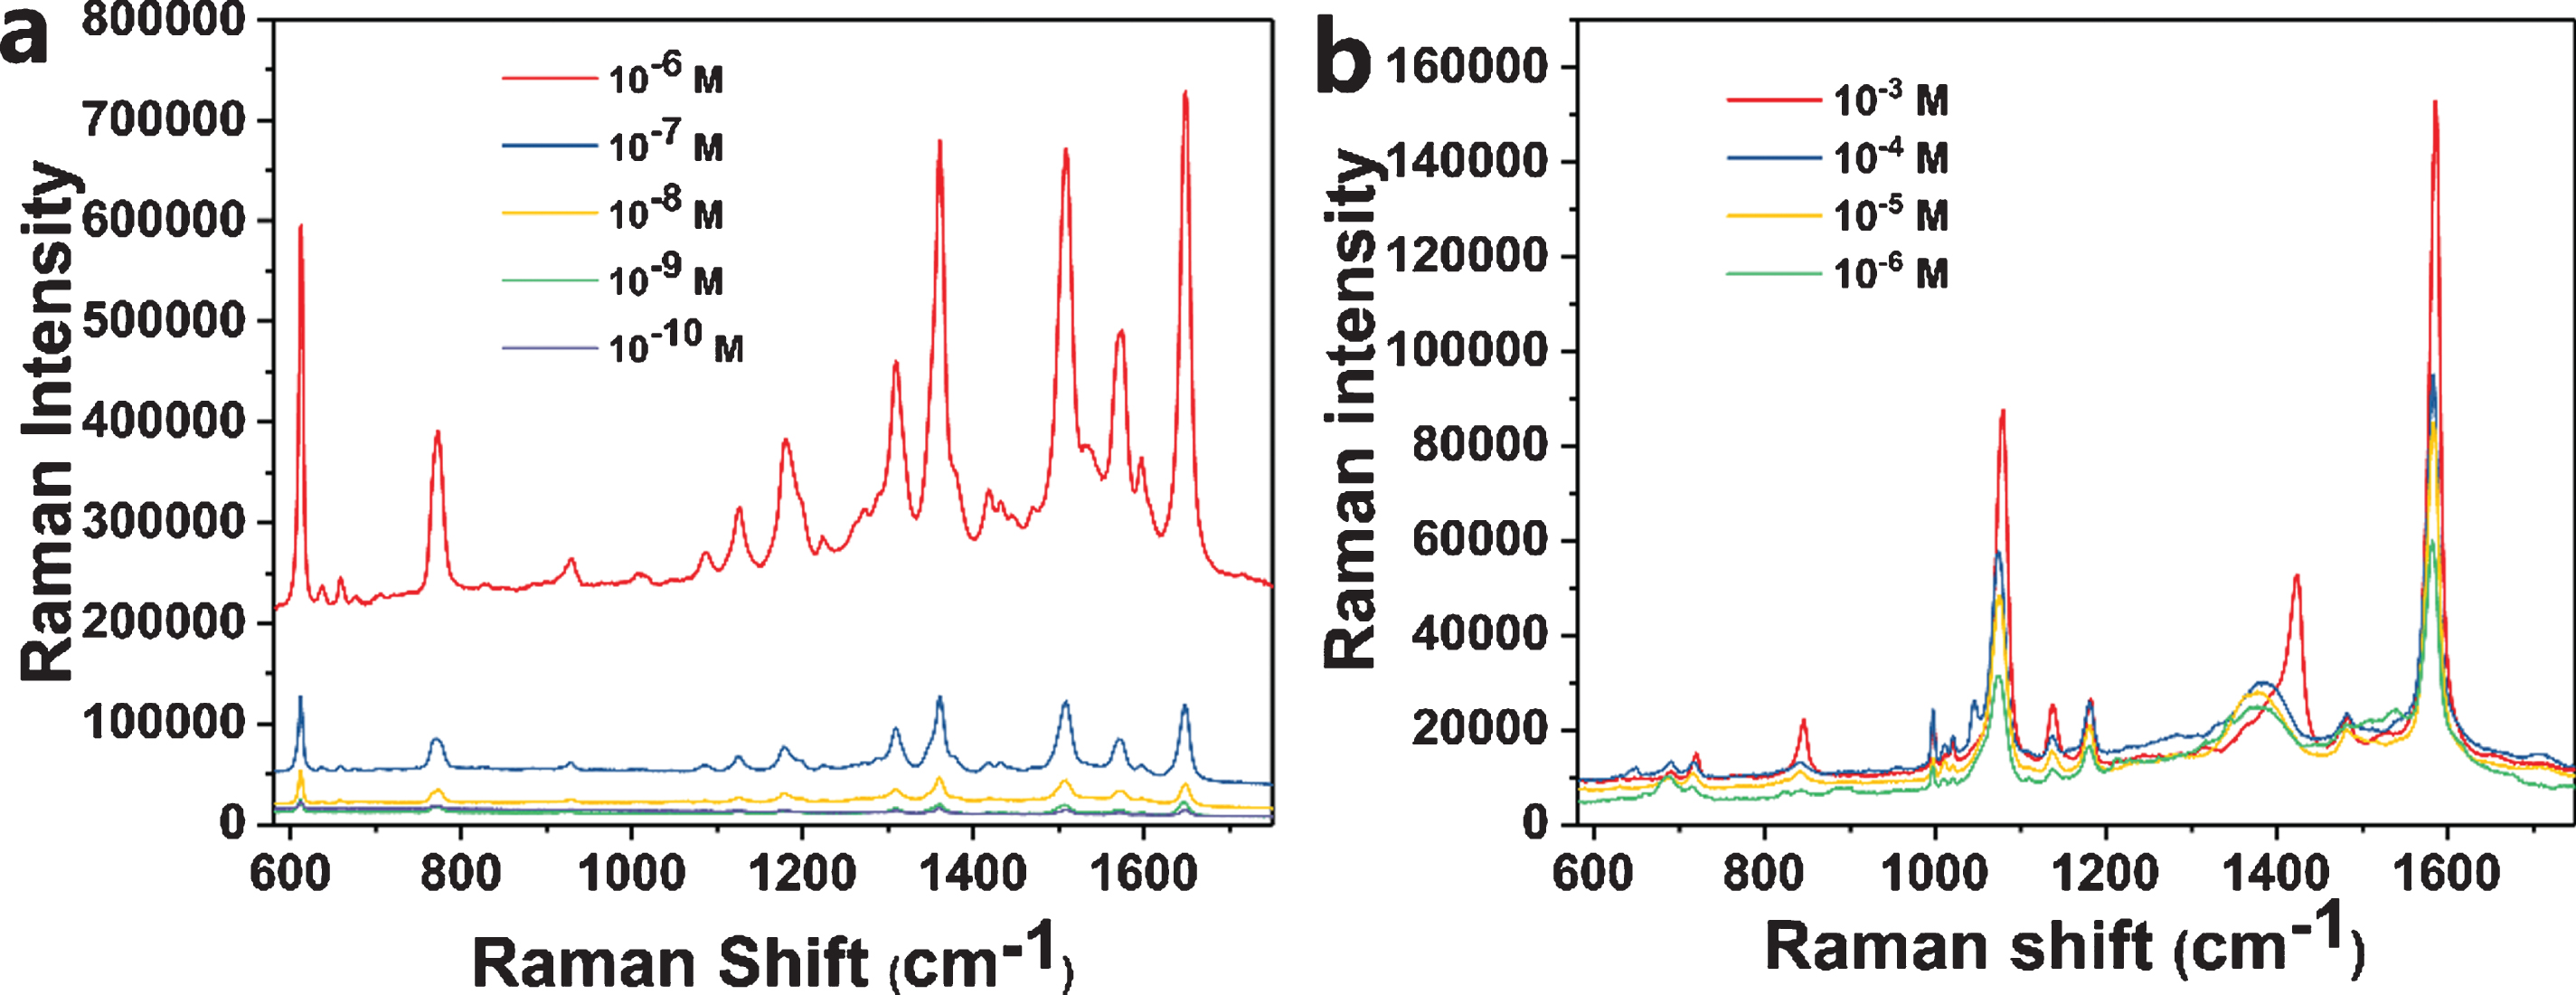
Evaluation of SERS performance of Au nanoparticles, a) SERS performance of Au nanoparticles of R6G, b) SERS performance of Au nanoparticles of MBA.
In this work, the Raman signals mainly depend on the molecules anchored on the Au nanoparticles. And the MBA would dissociate from the Au surface for the GSH have a stronger affinity with Au than Au-mercapto bonds [34]. Therefore, keeping the stability of Au-mercapto bonds in different conditions especially in endosome is a key factor to output Raman signals. The stability of Au-mercapto bonds in different pH values was evaluated through incubating in different acid conditions.
As displayed in Fig. 3a, the acid condition showed ignorable impact on Raman signals of MAB molecule. Distinct peaks of 1096 and 1595 cm–1 were obviously identified in the Raman spectrum. Besides, when incubated with GSH solution, the Raman signal decreased sharply compared with the nanoparticles in acid conditions, which could be due to the dissociation of MBA from Au nanoparticle surface. These results demonstrate that Au-mercapto bonds is a stable existence in the above acid conditions.
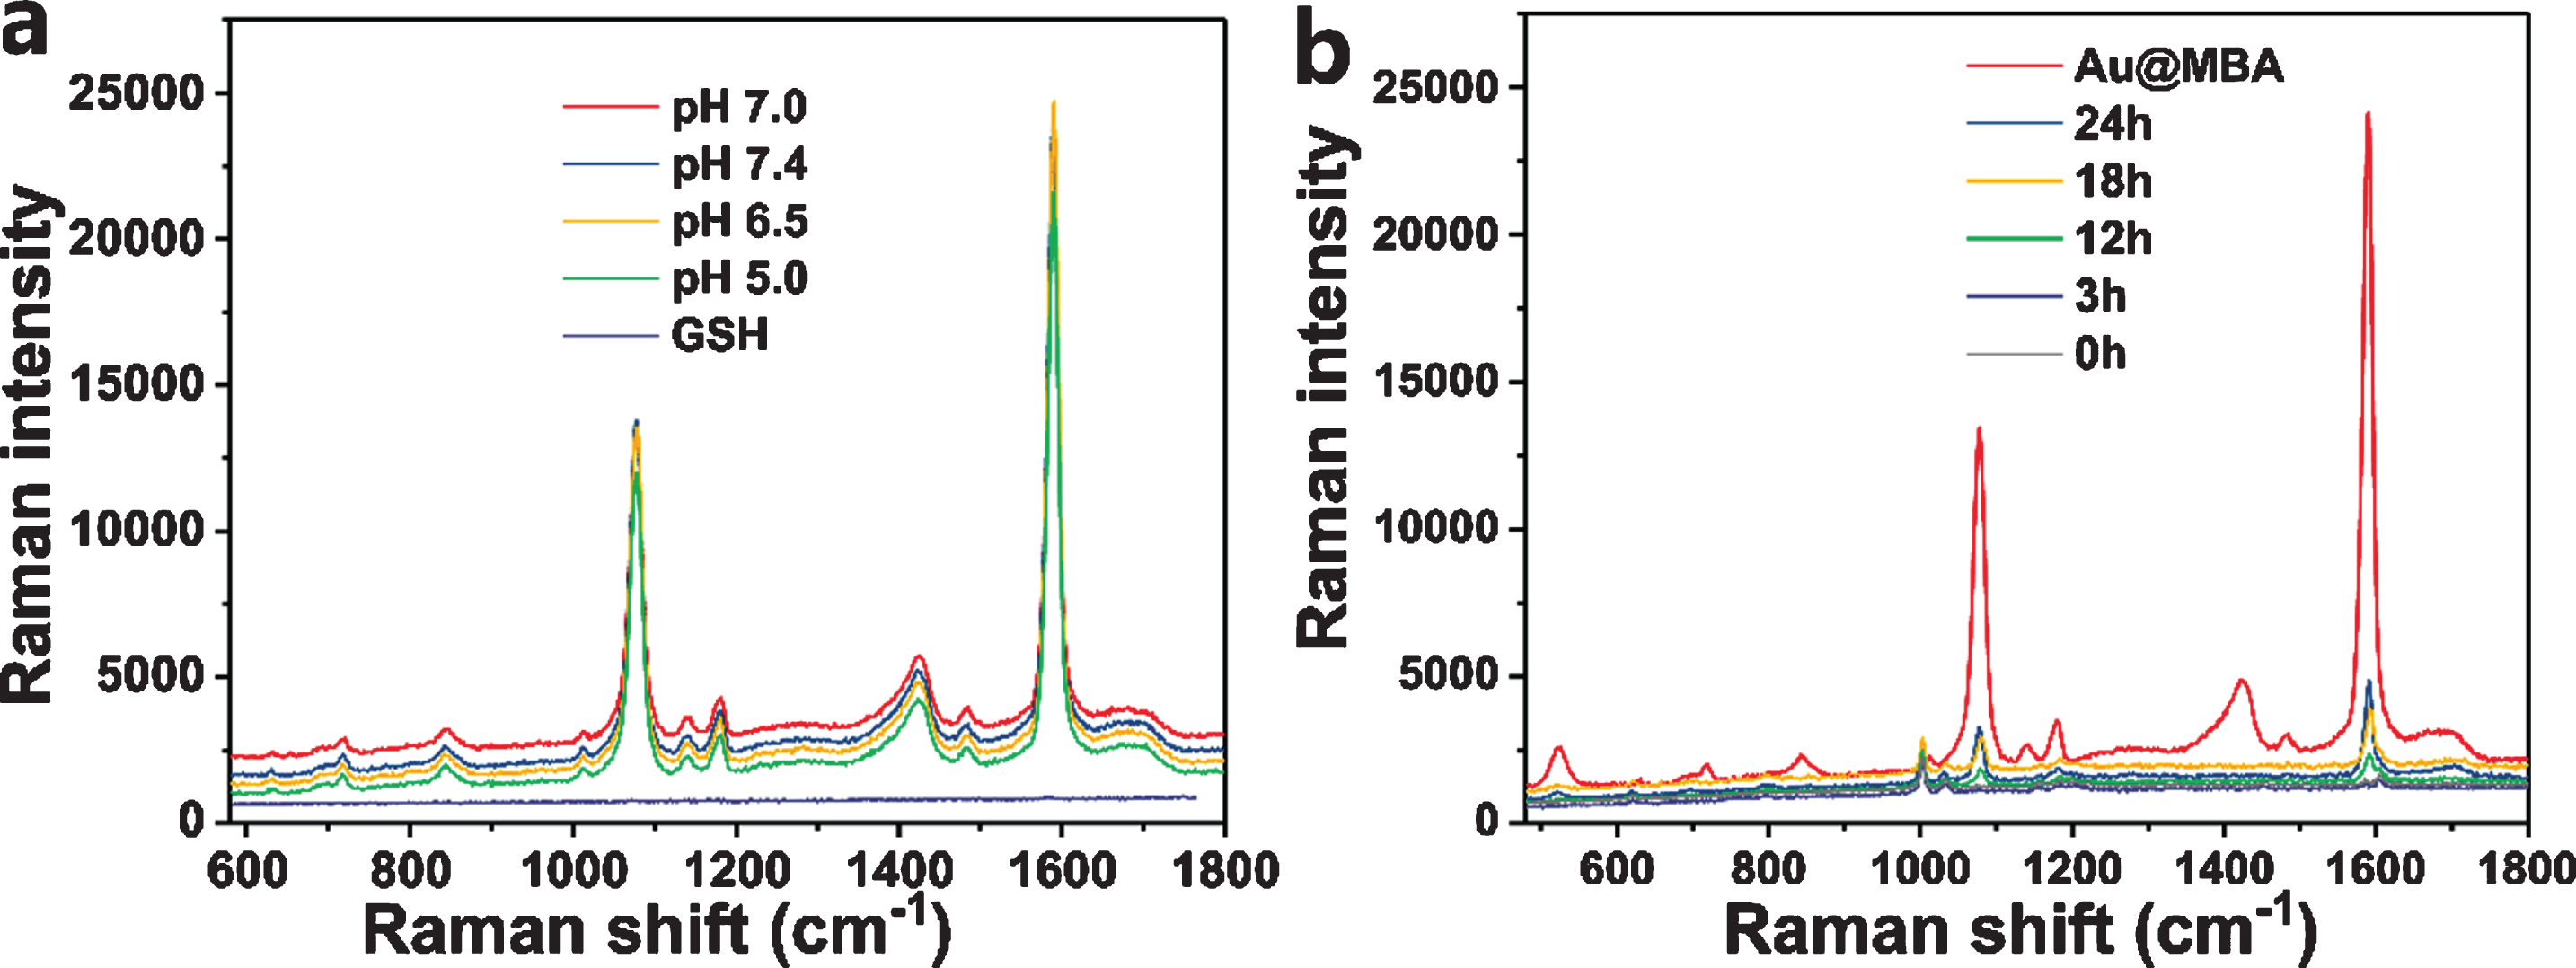
Evaluation of the interaction between Au and MBA in acid conditions and Raman signals observed after cell uptake, a) Raman intensities of Au nanoparticles incubated in PBS (pH = 5.0, 6.5, 7.0, 7.4) for 24h, b) Raman intensities of MBA after 0, 3, 12, 18, 24 h incubation with SKOV3 cells.
In addition, the incubated nanoparticles were then collected, the element distribution on the Au nanoparticles was performed to confirmed the existence of MBA. ZIF-8 showed poor stability in acid conditions (pH < 7) and result in decomposition [35]. The ZIF-8 layer was dissolved in the acid solutions (Fig. 4a). As can be seen in Fig. 4c, element of sulfur (S) distributed evenly on the Au nanoparticle surface, which proved the Au-mercapto bonds were stable in acid conditions.
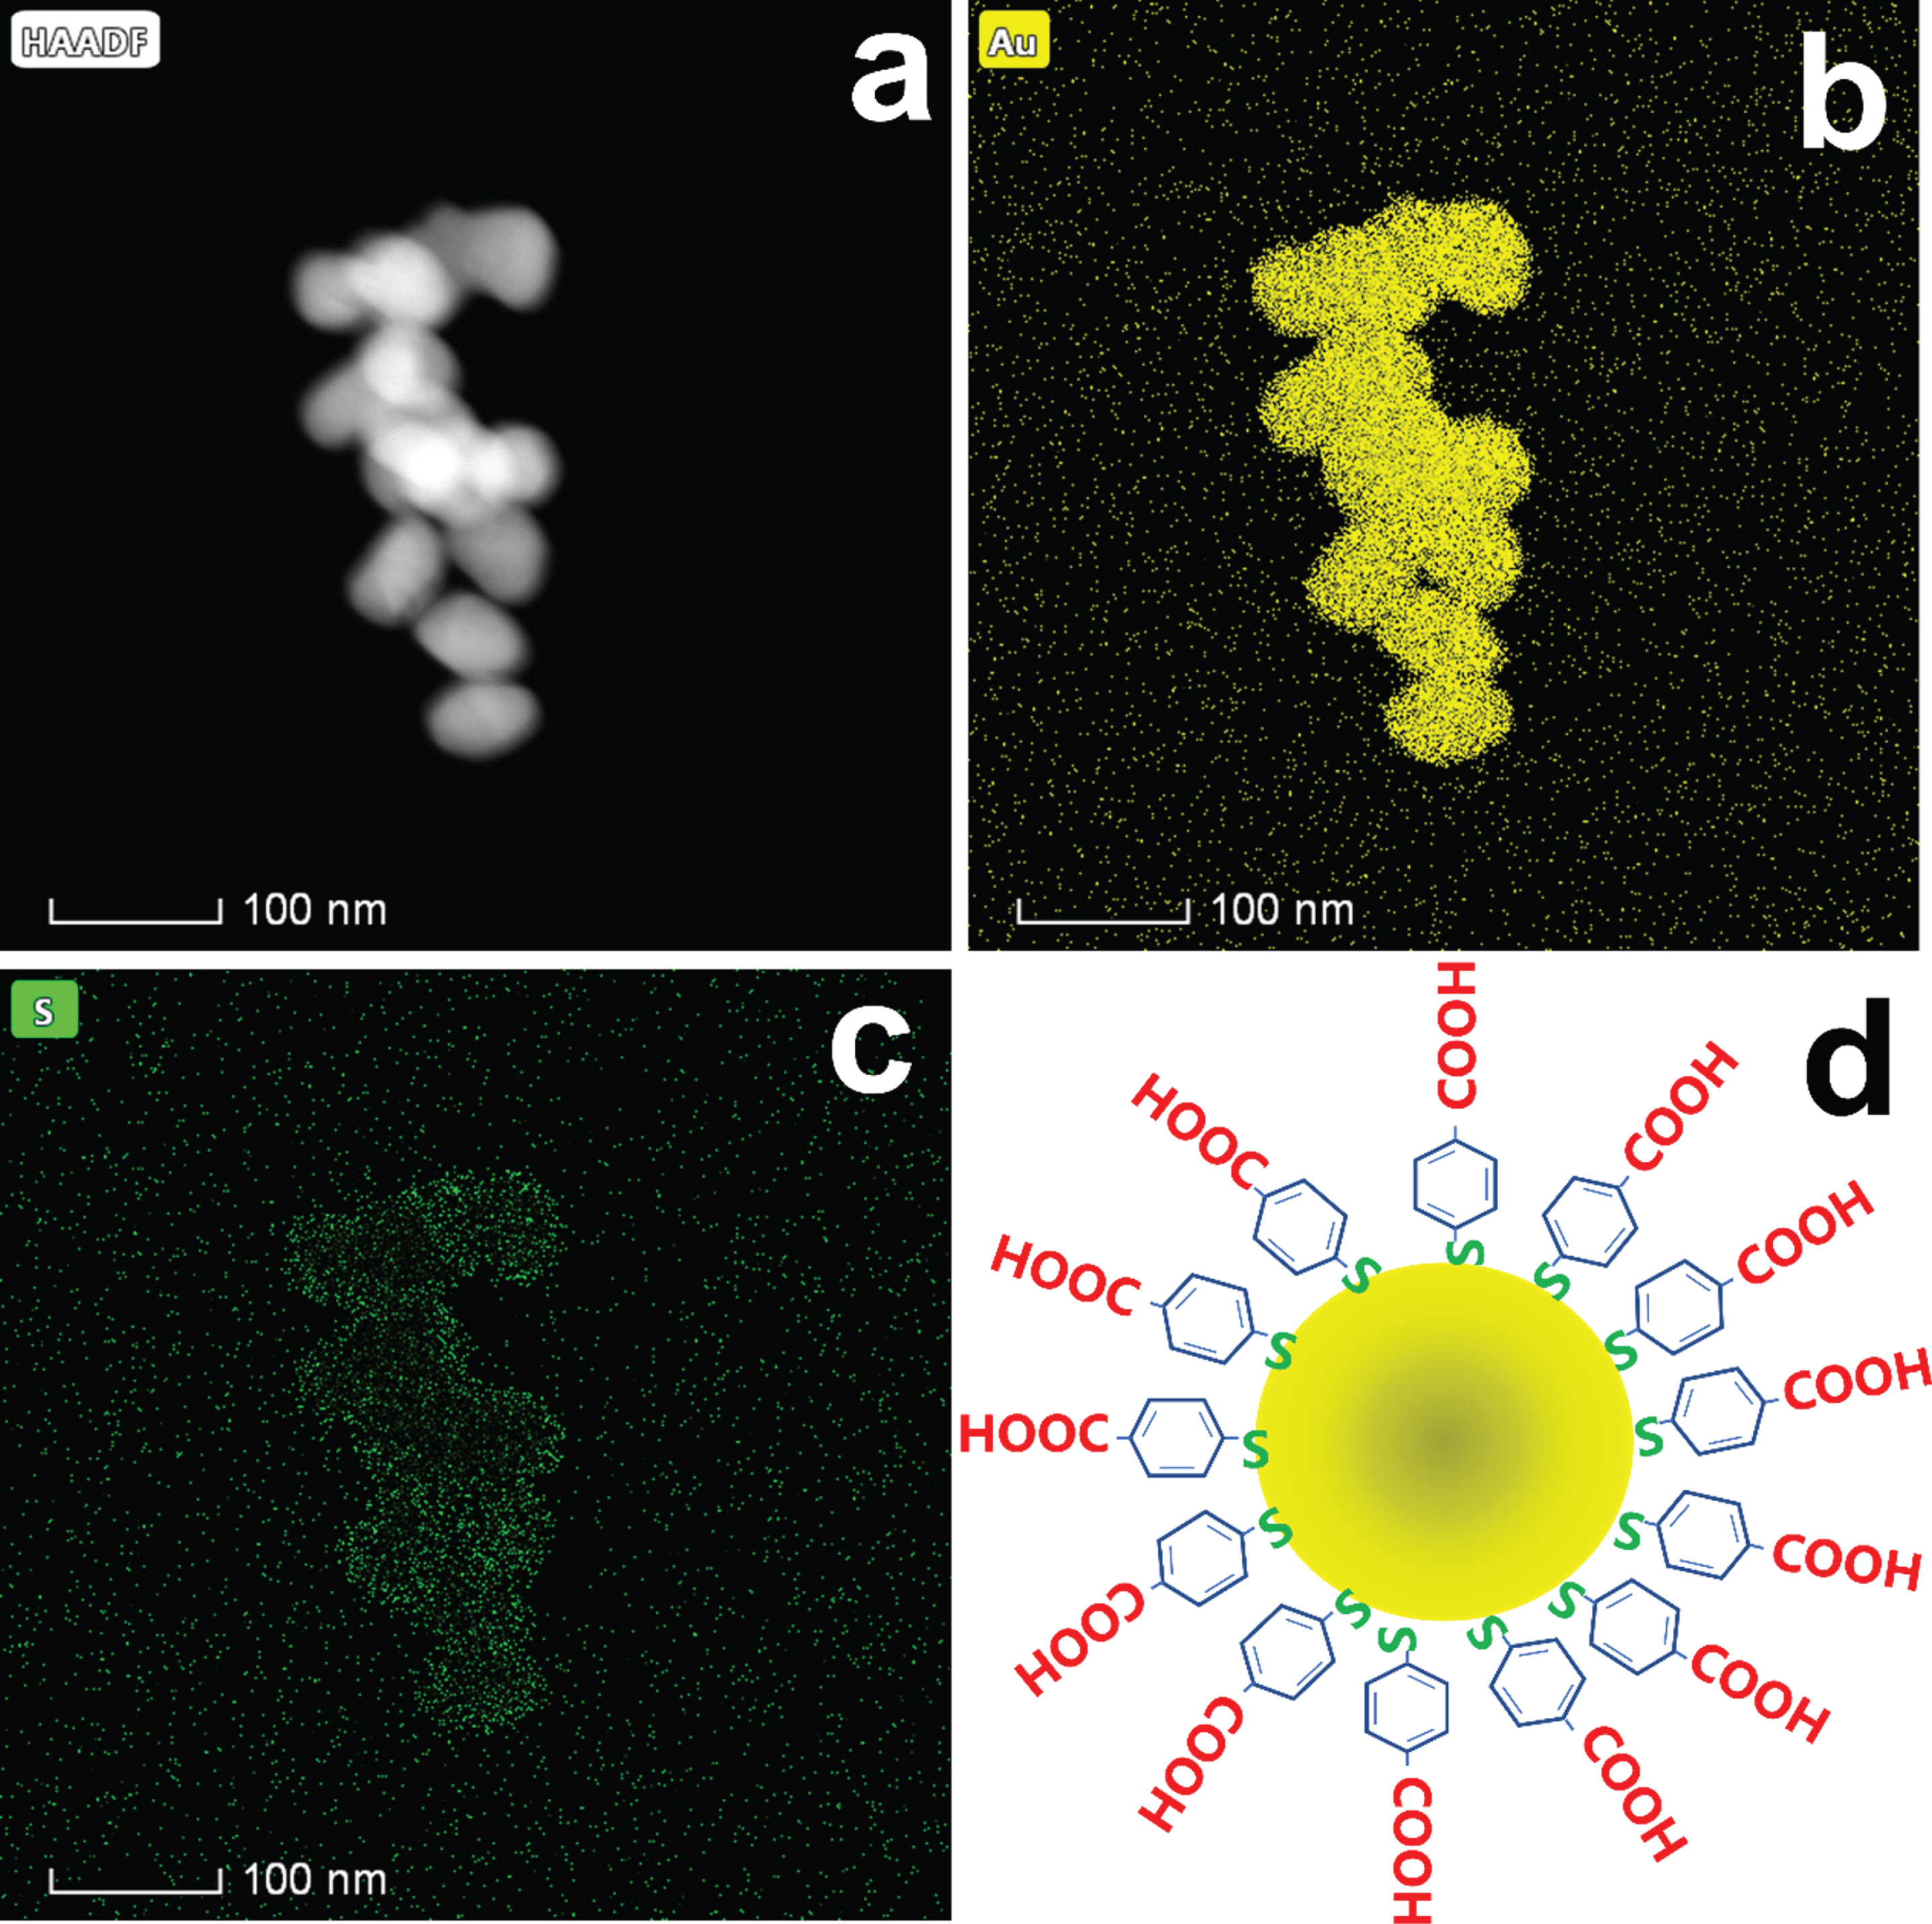
Element distribution mapping of Au@ZIF-8@MBA nanoparticles after incubating for 24 h in pH 5.0 condition, a) HAADF image of Au nanoparticles, b) element distribution mapping of Au c) element distribution mapping of S in MBA molecule, d) Scheme of MBA molecule anchored on Au surface.
The Au@ZIF-8@MBA nanoparticles were then incubated with SKOV3 cells for different time. After washed with PBS for 3 times, Raman signals of 0, 3, 12, 18, 24 h incubation time were obtained (Raman signals were then obtained with 633 nm laser of 20 s exposure time, at least 3 points were measured in the region of interest.). From the Raman spectrum, we can see that Raman signals increased correspondingly with the increase of incubation time. As can be seen in Fig. 3b, after 24 h incubation, strong Raman signal was detected. The Au@MBA showed the strongest signal, this could be due to the nanoparticle agglomeration after drop-casted on the glass substrate. The agglomerated Au nanoparticles provided more hotspots and thus enhanced the Raman signal. At the beginning of the addition of Au@ZIF-8@MBA nanoparticles (0 h, 3 h), no obvious Raman signals were observed, this could be due to the limited nanoparticles that were took in SKOV3 cells. With the increase of nanoparticles, the signals detected increased thereupon. Distinct peaks of 1045, 1600 cm–1 can be obviously identified with increased incubation time. As for peaks of 1000 cm–1, this could be due to the characteristic peak of culture plate. From the above results, the Raman signal can be detected even after 24 h incubation with SKOV3 cells, which demonstrate that the ROS consumed the most GSH in cells around the nanoparticles and result in the stable existence of Au@MBA. The area where the nanoparticles are located reflects the level of ROS to some extent.
After the uptake of Raman-tag labelled nanoparticles, the number of nanoparticles increased in cytoplasm with the increase of incubation time. In this work, we chose the 24 h incubation time to perform Raman mapping for the strong Raman signal obtained. As indicated in Fig. 5a, the region of SKOV3 cell was chosen as the object of observation (Step of 1μm, laser power of 0.05 mW and 633 nm laser in the measurement was set.). As the signals represent the ROS distribution in cells, and the stronger signals indicated higher level of ROS. As can be seen in Fig. 5b, the highest level of ROS mainly located in the cytoplasm near the nuclear (as indicated by arrow in Fig. 5a). This result is highly consist with the fluorescent image measured by ROS Assay Kit (Fig. 5a, inset). Besides, as the step of 1μm in the measurement was set, the mapped area showed more accurate resolution compared with fluorescent method. From the mapping, the Raman intensity showed more details of ROS distribution than fluorescent images. The above ROS detection method may provide a new thought toward subdividing intracellular metabolism.
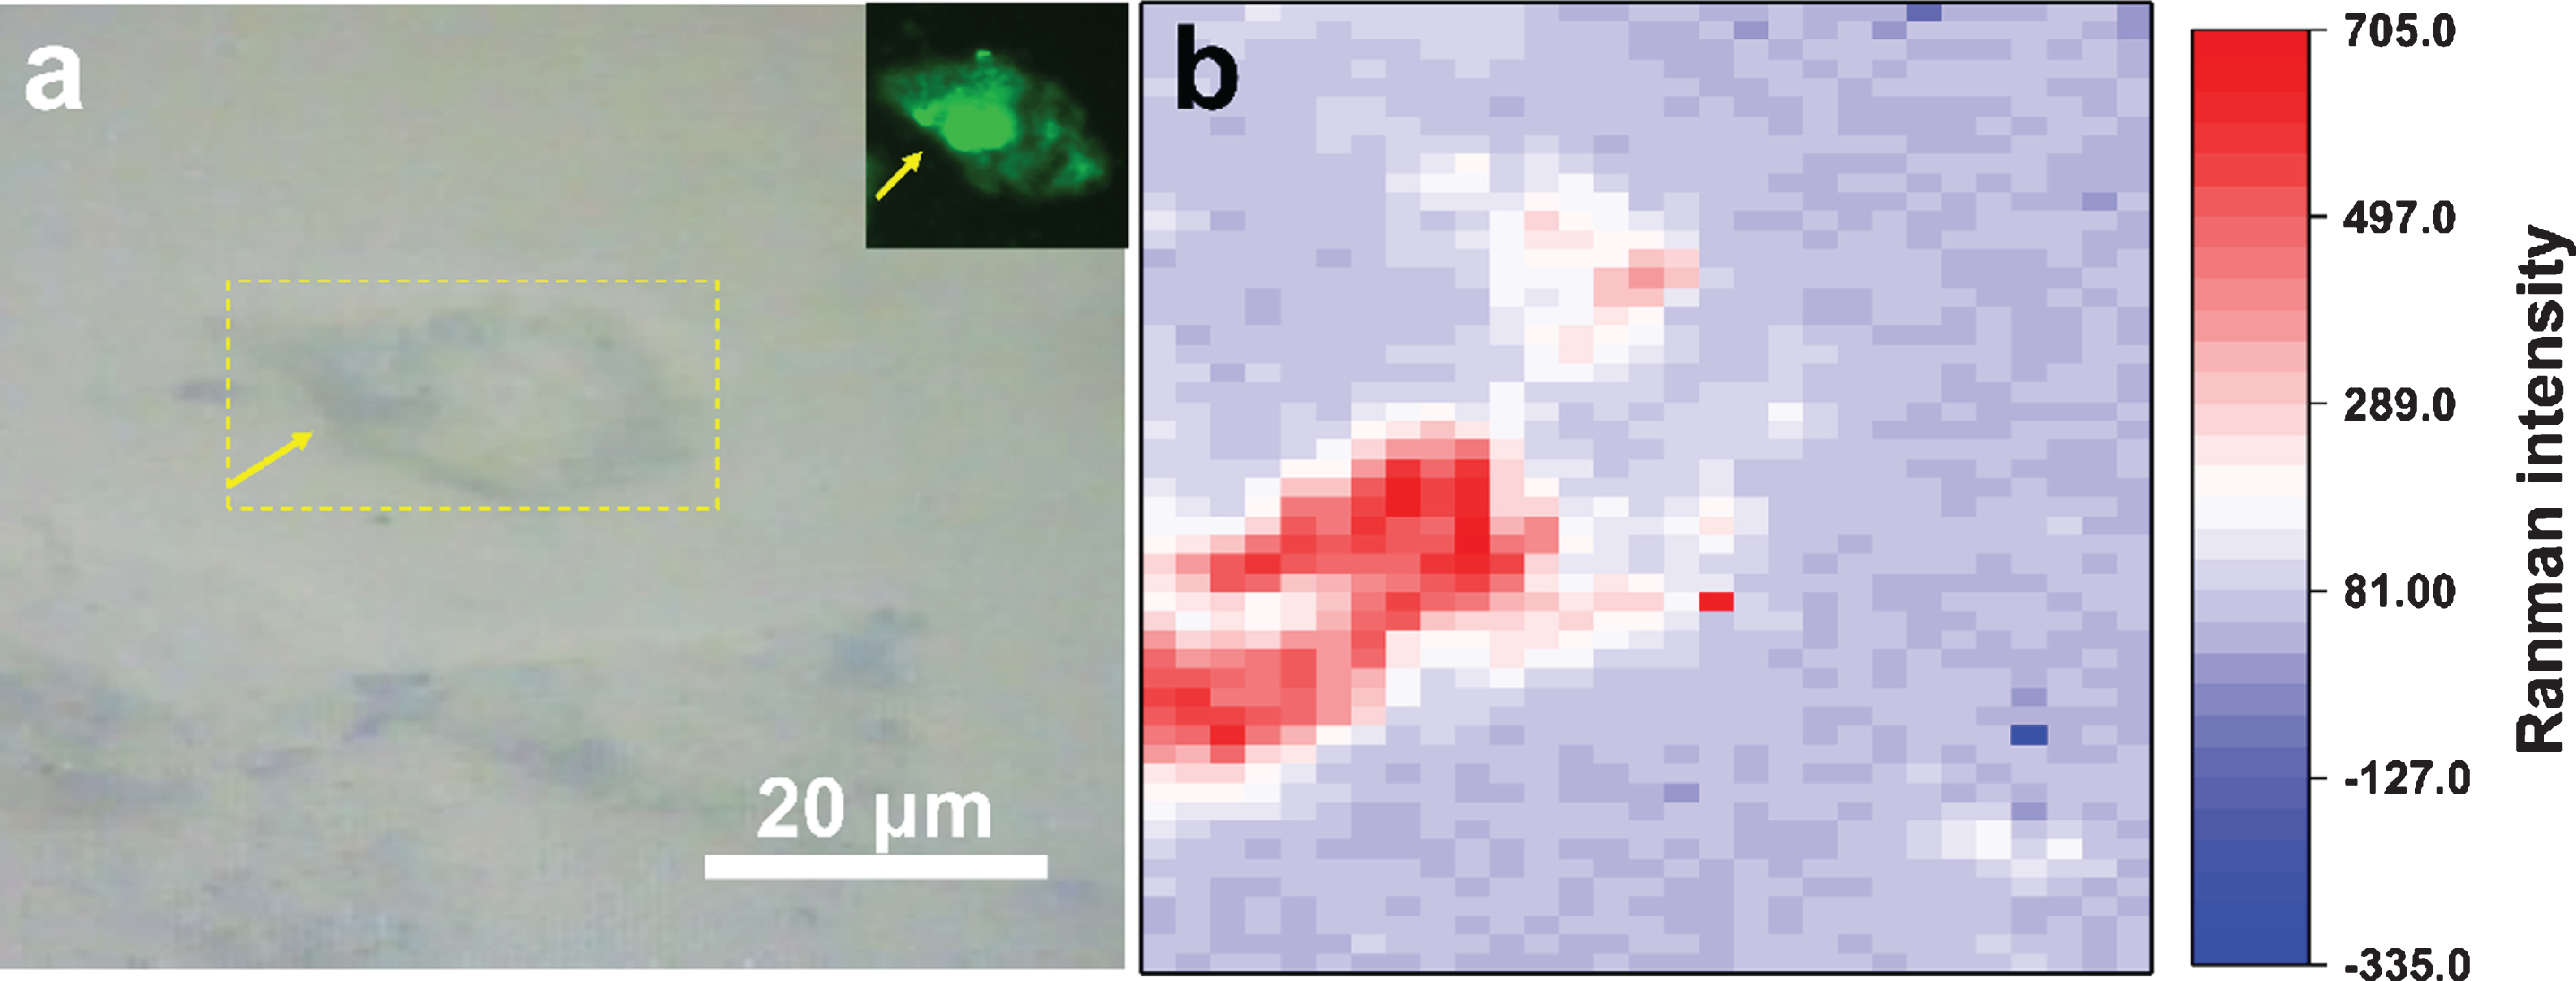
Monitoring the ROS distribution in live cells, a) microscope image of SKOV3 cells (inset is the fluorescent image of ROS in SKOV3 cell), b) Raman mapping of SKOV3 cell in (a).
In summary, we fabricated the Raman-tag labelled Au@ZIF-8@MAB for intracellular ROS monitoring. High SERS performance was observed of Au nanoparticles toward R6G and MBA. The Au-mercapto bonds kept stable in acid conditions. Through incubating with cancer cells for 24 h, the labelled nanoparticles showed high Raman signals in the cell cytoplasm. The Raman mapping further observed the ROS distribution. Compared with fluorescent method measured by ROS Assay Kit, the result showed more detailed ROS distribution by different Raman intensities. Compared with typical ultrasound contrast and magnetic resonance imaging [36], Raman imaging provides a noninvasive point-of-care screening technology for molecular-level metabolism monitoring in cells, which implies the potential application of SERS imaging platform for other conditions in the broad field of metabolomics [17]. The above ROS detection method may provide a new thought toward subdividing intracellular metabolism for cell biology.
Conflict of interest
The authors declare no competing financial interest.
Footnotes
Appendix
Herein, we fabricated Raman-tag labelled Au@ZIF-8 for cell metabolism monitoring. The SERS platform provides an ultrasensitive monitoring method of ROS distribution and the mapping showed more detailed ROS distribution by different Raman intensities in SKOV3 cells.
Acknowledgments
We gratefully acknowledge the financial support by Natural Science Foundation of China (No. 51672043). The Shanghai Natural Science Foundation (15ZR1401200), and the Fundamental Research Funds for the Central Universities and Graduate Student Innovation Fund of Donghua University (CUSF-DH-D-2019017).