
Abstract
BACKGROUND:
Capsular contractures around breast implants usually develop leading to pain and aesthetically inadequate results and ultimately often requires the replacement of the implants. Textured silicone implants are the most commonly placed implant, but polyurethane-coated implants are increasingly being used in an attempt to ameliorate the long-term complications associated with implant insertion.
AIM:
Capsular contracture is traditionally classified using the Baker scale, a subjective classification system based upon clinical findings. Aim of this study was to evaluate the association between pain due capsular contraction, Baker score and different techniques of US elastography.
MATERIAL AND METHODS:
Patients were contacted who had undergone an implant replacement due to capsular contracture. Inclusion criterion was the re-implantation of a PU-coated implant. In the third year after changing the implant a follow-up examination was performed in 16 patients with 23 implants. A conventional examination with anamnesis, tactile and visual findings to obtain a Baker score, and ultrasound examinations including shear wave elastography, ARFI and compound elastography were performed. In addition, pain was evaluated using a visual analogue scale (VAS).
RESULTS:
The pain data showed a significant improvement (before implant exchange: 4.1±2.8 score points) with significance in favor of the current state (1.7±1.0 pain score points; p = 0.002). All patients suffered from less or no pain three years after exchange of the implant. Pain values and elastography (ARFI values) correlated well (r = 0,873), with increasing Baker score the ARFI values increased. US elastography evaluations can locally determine tissue density but correlate only to a limited extent with the test findings according to Baker. US elastography values of mammary gland tissue without implant did not differ from mammary gland tissue around implants.
CONCLUSION:
Preoperative Baker scores prior to exchange and the current Baker scores at the follow-up showed significantly lower score points three years after exchange of the implants. Ultrasound elastography seems to be an objective classification of capsular fibrosis. These first results motivate to initiate a prospective multicenter investigation.
Introduction
Breast implants are not only used for aesthetic but also for reconstructive reasons in women after mastectomy. While textured silicone implants are still the most used breast implants, polyurethane (PU)-coated implants are becoming increasingly popular because they might reduce the incidence of capsular fibrosis (Spear et al. 2000). A capsule of connective tissue usually forms around implants after insertion [1]. Over time, capsular fibrosis can occur leading to pain and aesthetically inadequate results especially if there have been complications like implant rupture, silicone penetration, silicone migration and gel bleeding, which it the reason for painful palpation in up to 10% during the follow up after breast implants [2–7]. Then, the replacement of the breast implants is required necessarily.
Capsular fibrosis is traditionally classified using the Baker score, a subjective, clinical classification based upon visible and palpable findings like circumscribed nodules with fluid collection as well as local per prosthetic pain evaluation [3–5, 8].
Ultrasound is the most widely used imaging method as a substitute for the manual palpation. However, only high-resolution ultrasound can be used to represent the tissue changes around breast implants. Both in brightness modulation (B)-mode and color-coded duplex sonography (CCDS)-mode, only very severe degrees of fibroses, intra- or extracapsular implant rupture or hypervascularization as a sign of an inflammatory reaction can be detected. Changes of the periprosthetic tissue to edema in B-mode, irregular thickness of the capsular structures and hyperemia in CCDS are criteria of periprosthetic capsular fibrosis with inflammatory reaction. Early stages of fibrosis cannot be detected. Elastography is an advanced ultrasound technology, which enables to image the viscoelastic properties of tissue [9—13]. Initially, liver tissue was investigated using strain and shear wave ultrasound technique [14, 15]. Furthermore, a classification for the degree of liver tissue fibrosis could be established to monitor anti-inflammatory therapies [16, 17]. ARFI imaging using abdominal e was the first technique which was evaluated in multicenter studies to classify liver tissue stiffness [18]. It is increasingly being attempted to apply this knowledge to other types of tissue and to evaluate the degree of fibrosis for different tissue entities using ultrasound elastography [19–21].
Therefore, aim of this study was to compare the clinical Baker score with strain, shear wave elastography and Acoustic Radiation Force Impulse (ARFI) imaging using a multifrequency linear probe for their ability to diagnose capsular fibrosis after breast implant insertion.
Materials and methods
Only female patients from the center of plastic surgery in Regensburg, who had an implant replacement due to a capsular fibrosis and who got a polyurethane (PU)-coated implant (Polytech, Dieburg, Germany) inserted in this context, were included. The breast implants were initially inserted in some patients for aesthetic (n = 7) and in others for reconstructive reasons (n = 9).
A follow-up examination was performed on 16 patients and 25 implants in the third year after implant replacement. After review of their medical history the patients were examined clinically. Therefore, palpable and visible findings of the breast tissue were evaluated by an experienced physician to obtain the clinical Baker score: Stage palpation Baker I breast is soft, implant not palpable, Baker I breast is soft, implant is palpable but not visible, Baker III breast is hardened, implant is palpable and visible, Baker IV breast is hard, deformed and painful; implant is palpable and clearly visible.
The occurrence of pain was evaluated using a visual analogue scale (VAS) from 1 to 10. Considering the clinical practice the standard for evaluation early changes of the capsular fibrosis is the manually palpation of the implants and the surrounding tissue by very experienced examiners. The ultrasound diagnostics were performed by one experienced radiologist without knowledge of the clinical examination. Only high-end ultrasound devices (Acuson S3000, Siemens, Erlangen, Germany, and LOGIQ E9, General Electric, Frankfurt, Germany) and high resolution multifrequency transducers (6–9 MHz, 6–15 MHz and 6–18 MHz) were used for this study. In terms of ARFI imaging the Siemens Acuson S3000 device and the 6–9 MHz transducer were used.
For all patients B-mode, CCDS and strain and shear wave elastography including ARFI were evaluated by one experienced examiner (more than 3000 examinations over more than 20 years). A second experienced examiners for modern ultrasound techniques was not available, al limitation for evaluation the interobserver variability. To reduce the intra observer variability a quality reference marker was used. Only images with a good and high image quality for elastography (at maximum 5 points in green color) were used.
Sono-elastography is an examination in which the stiffness of the tissue is described by elastic moduli. There are two types of elastographic examination: conventional and shear wave elastography. In the first one, compression of the tissue is required, and the result of the examination is the color-coded map of tissue elasticity. In the shear wave method, tissue compression is replaced by mechanical vibration produced by an ultrasonic probe.
Strain and shear wave elastography were performed and documented in five different regions of interest: cranio-lateral, caudo-lateral, caudo-medial, cranio-medial (according to the 4 breast quadrants) and subareolar. A standardized preset for breast imaging was used for elastography evaluation, at maximum 4×3 cm in size [22]. Windows for measurements by ARFI were 10 mm in diameter and could not be changed. Measurements by shear wave elastography were limited at maximum 6 cm in depth, for strain elastography at 8 cm in depth. Moving artefacts, heart pulsation and respiration artefacts may limit precise measurements of the tissue stiffness.
Color coded evaluation could be different by the high-end technologies of different ultrasound high-end machines. The definition of false colors for strain and shear wave elastography were different. Using strain elastography soft tissue is coded in red and yellow color and in blue and green for hard tissue. A color-coded classification of tissue stiffness in eight different levels was used. Here, tissue stiffness describes a higher degree of fibrosis (0 = not to be assessed, 7 = maximal homogenous stiffness).
Using shear wave elastography blue and green indicated low, red and yellow high degree of tissue stiffness. There were three different measurements done in each region of interest (meaning 15 measurements per breast). Highest degree for stiffness measurements were up to 300 kPA or 10 m/s.
According to the established ARFI imaging for the detection and classification of liver fibrosis the same ultrasound preset was used to examine the breast tissue in the five different regions of interest (cranio-lateral, caudo-lateral, caudo-medial, cranio-medial and subareolar). To receive ARFI values short acoustic pulses were emitted into the tissue by the Siemens Acuson S3000 device inducing localized micrometer-sized tissue displacements. These shifts lead to the propagation of transverse waves. The propagation velocity of these transverse waves can be detected and measured: The stiffer the tissue, the higher the velocity. Corresponding to the liver tissue stiffness evaluation for a F4 fibrosis ARFI values higher than 2.3 m/s have been assessed as higher degree of tissue stiffness of periprothetic tissue respectively fibrosis. There were three repeated measurements performed in each region of the breast and in the center.
For better evaluation of ARFI and strain elastography values, breast tissue without implant was examined in patients, who had only one breast implant inserted (due to reconstructive surgery), and compared to breast tissue with implant (n = 7).
The study was approved by the ethics committee of the University Hospital Regensburg.
Statistical analysis was performed using SPSS Statistics (IBM, Version 22.0.0). Average values and standard deviations were calculated. T-tests and McNemar tests were done to determine (significant) differences between variables. Differences with p values of less than 0.05 were considered significant. Moreover, analysis of variance (ANOVA) and regression analysis were used to determine correlations.
Results
At the time of breast implant replacement, the examined patients were on average 49.6±13.3 years old. The breast implant replacement was performed 91.1±75.1 months after implant insertion meaning that there were big differences regarding the period of time until a capsule contracture -requiring implant replacement- occurred (minimal 8 months, maximal 268 months). In the population examined, the incidence of capsular fibrosis increased with increasing period of time after breast implant insertion.
The McNemar test revealed a significant difference between the two groups (p = 0.008). At higher Baker-Scores, the score improved significantly after implant replacement using PU-coated implants (p = 0.008; s. Fig. 1).

Baker score pre- and post-implant replacement.
Comparing the occurrence of pain pre- (4.1±2.8) and post- (1.7±1.0) implant replacement there was a significant pain reduction 3 years after implant replacement using the visual analogue scale (VAS) (p = 0.002).
The occurrence of pain correlated with the ARFI measurements significantly. If there were higher values in pain evaluation, there were also higher ARFI values observed meaning the occurrence of stiffer tissue (R = 0.648, p = 0.05). Comparing the occurrence of pain with measurements generated using strain elastography the same tendency between these two variables was observed.
Regarding the ARFI and shear wave elastography measurements, there were no significant differences between the 5 different regions of interest observed (s. Table 1 and 2). The shear wave technique nicely confirmed results achieved with the ARFI technique. nicely confirms results achieved with the shear wave technique.
Mean ARFI measurements±standard deviation in [m/s] in the five different regions of interest
Mean shear wave elastography±standard deviation in [m/s] the five different regions of interest
Furthermore, the ARFI values correlated well with the Baker score in a positive way (R = 0.873, s. Table 3) meaning increased ARFI values (stiffer tissue) with increasing Baker score. The Figs. 2 and 3 show Acoustic Radiation Force Impulse (ARFI) values for patients with minor (Baker score 1, s. Fig. 2) and relevant fibrosis (Baker score 4, s. Fig. 3).
Mean ARFI measurements±standard deviation in [m/s] in the five different regions of interest in relation to the Baker score
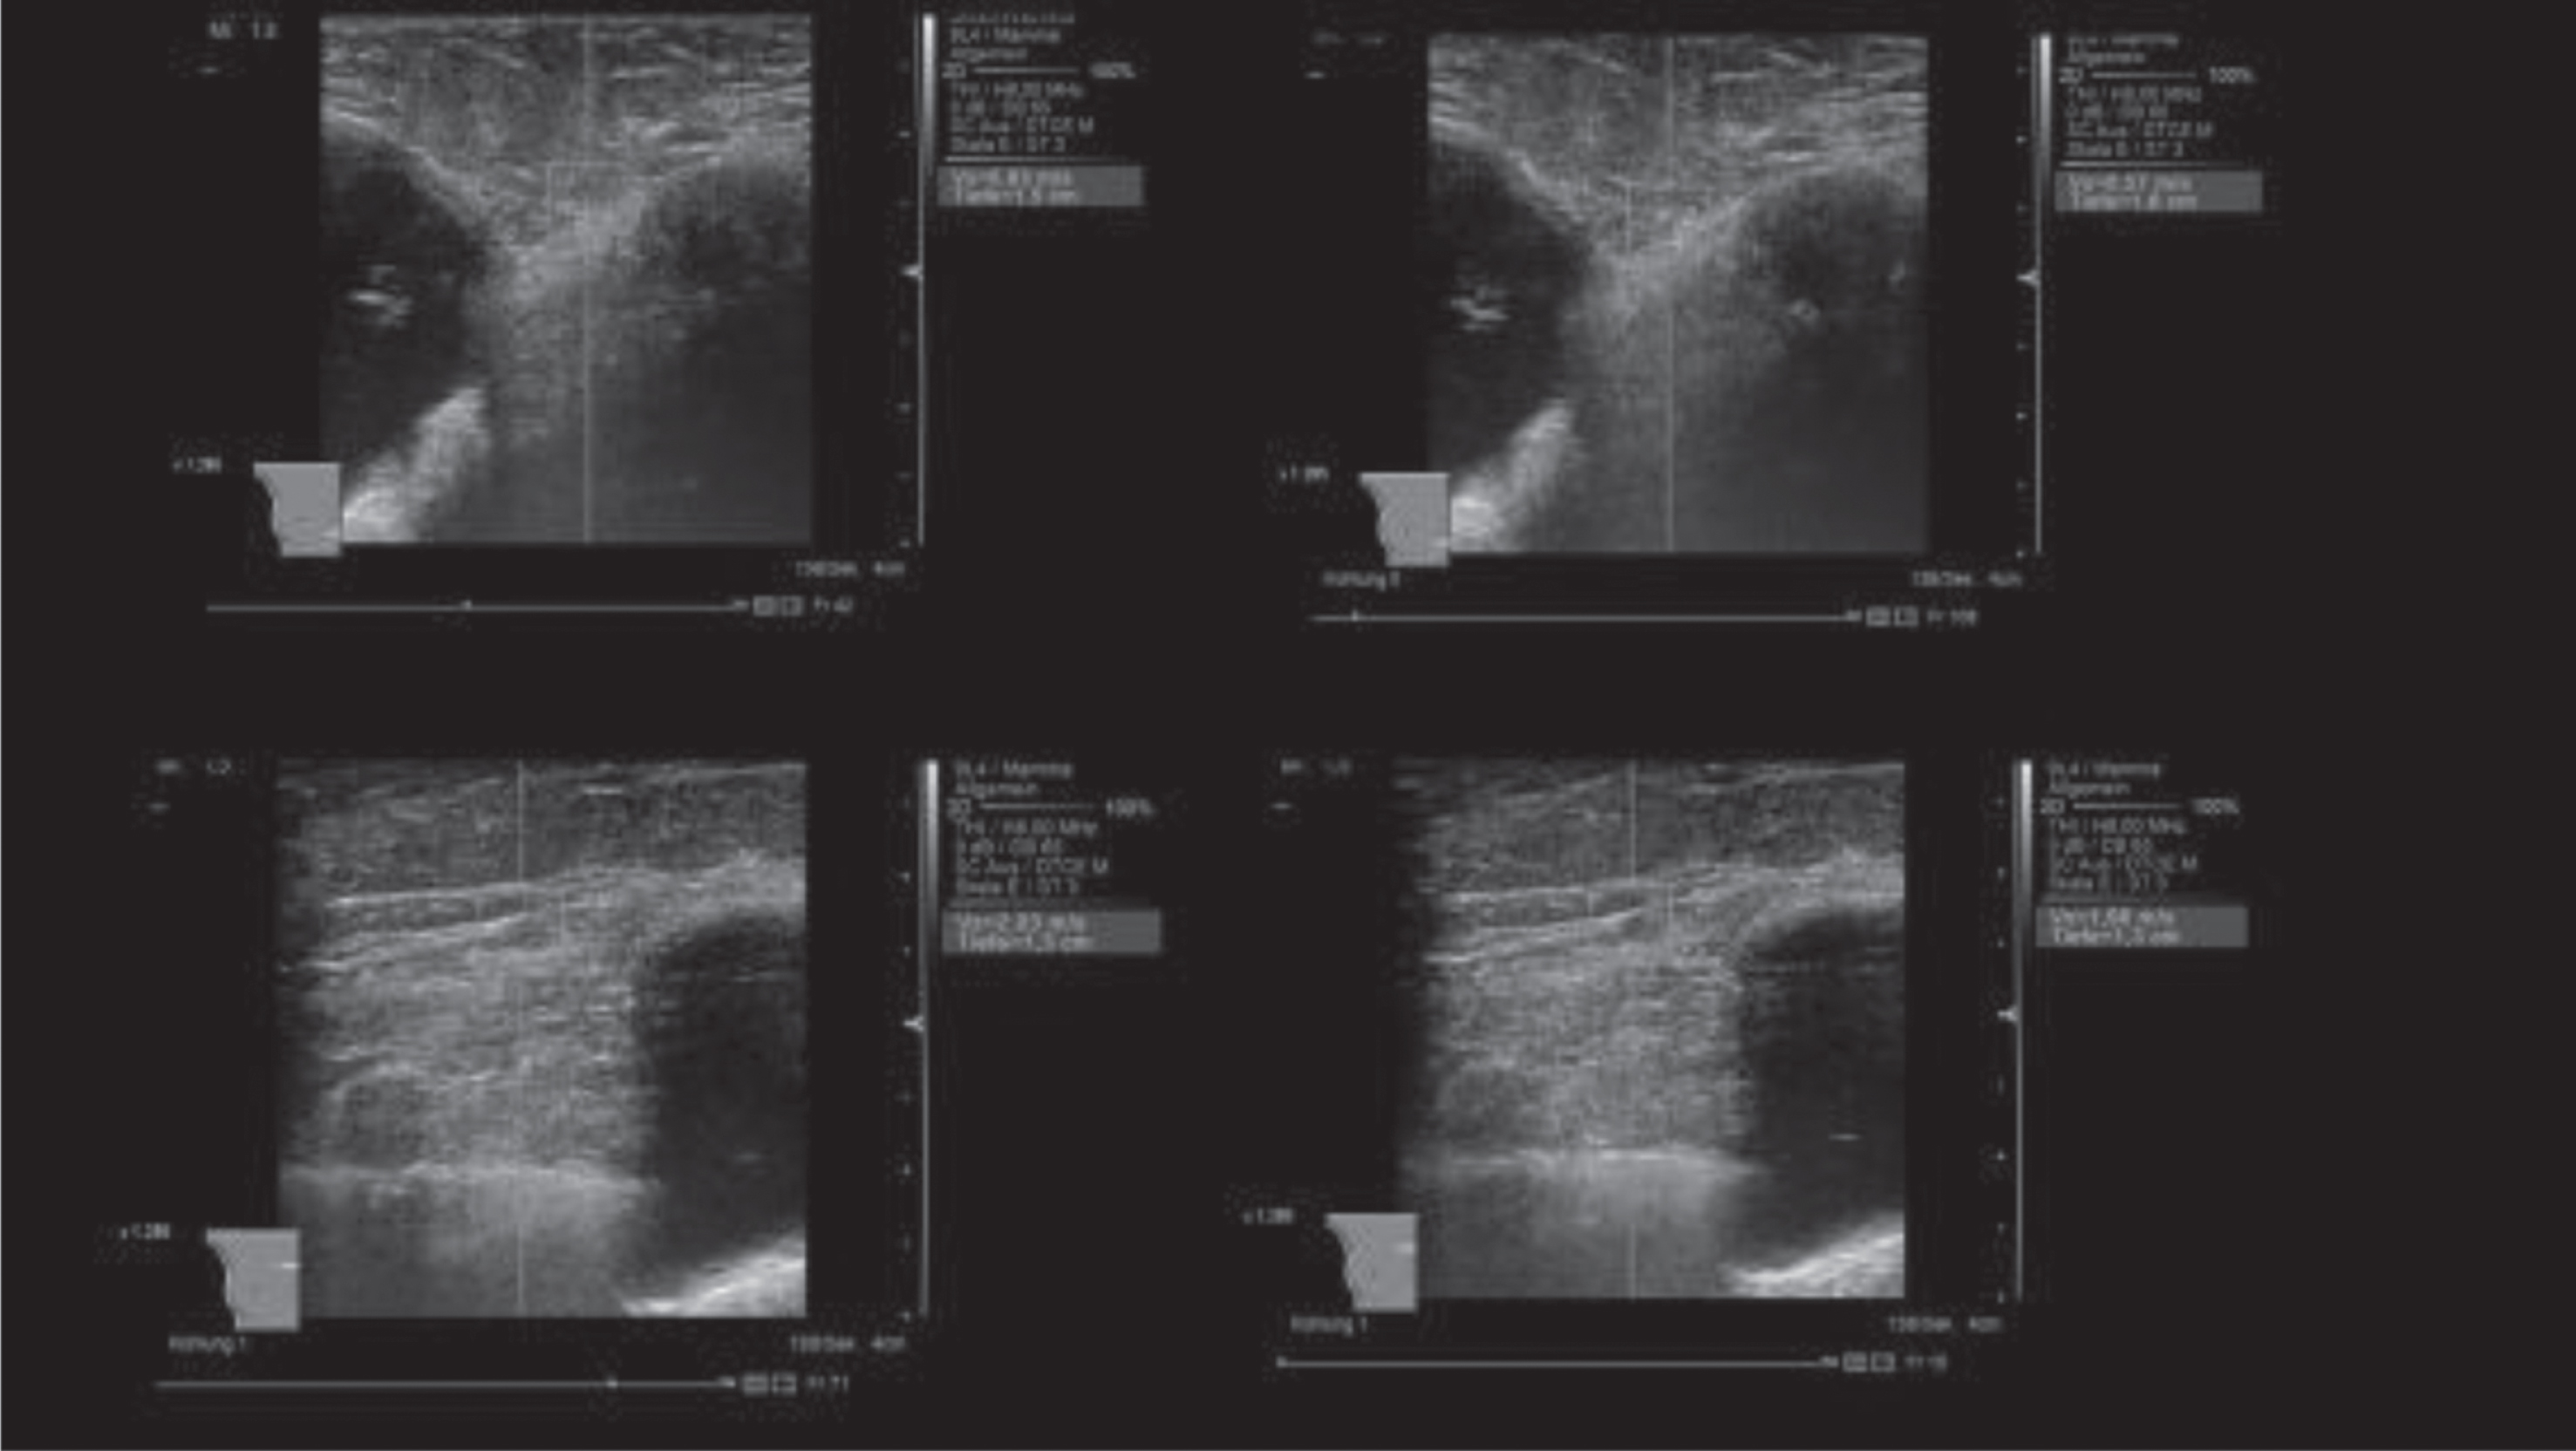
Acoustic Radiation Force Impuls (ARFI) values between 0.57 m/s –2.03 m/s in the region of interest indicating an unhardened finding of the tissue near (patient with Baker score 1).
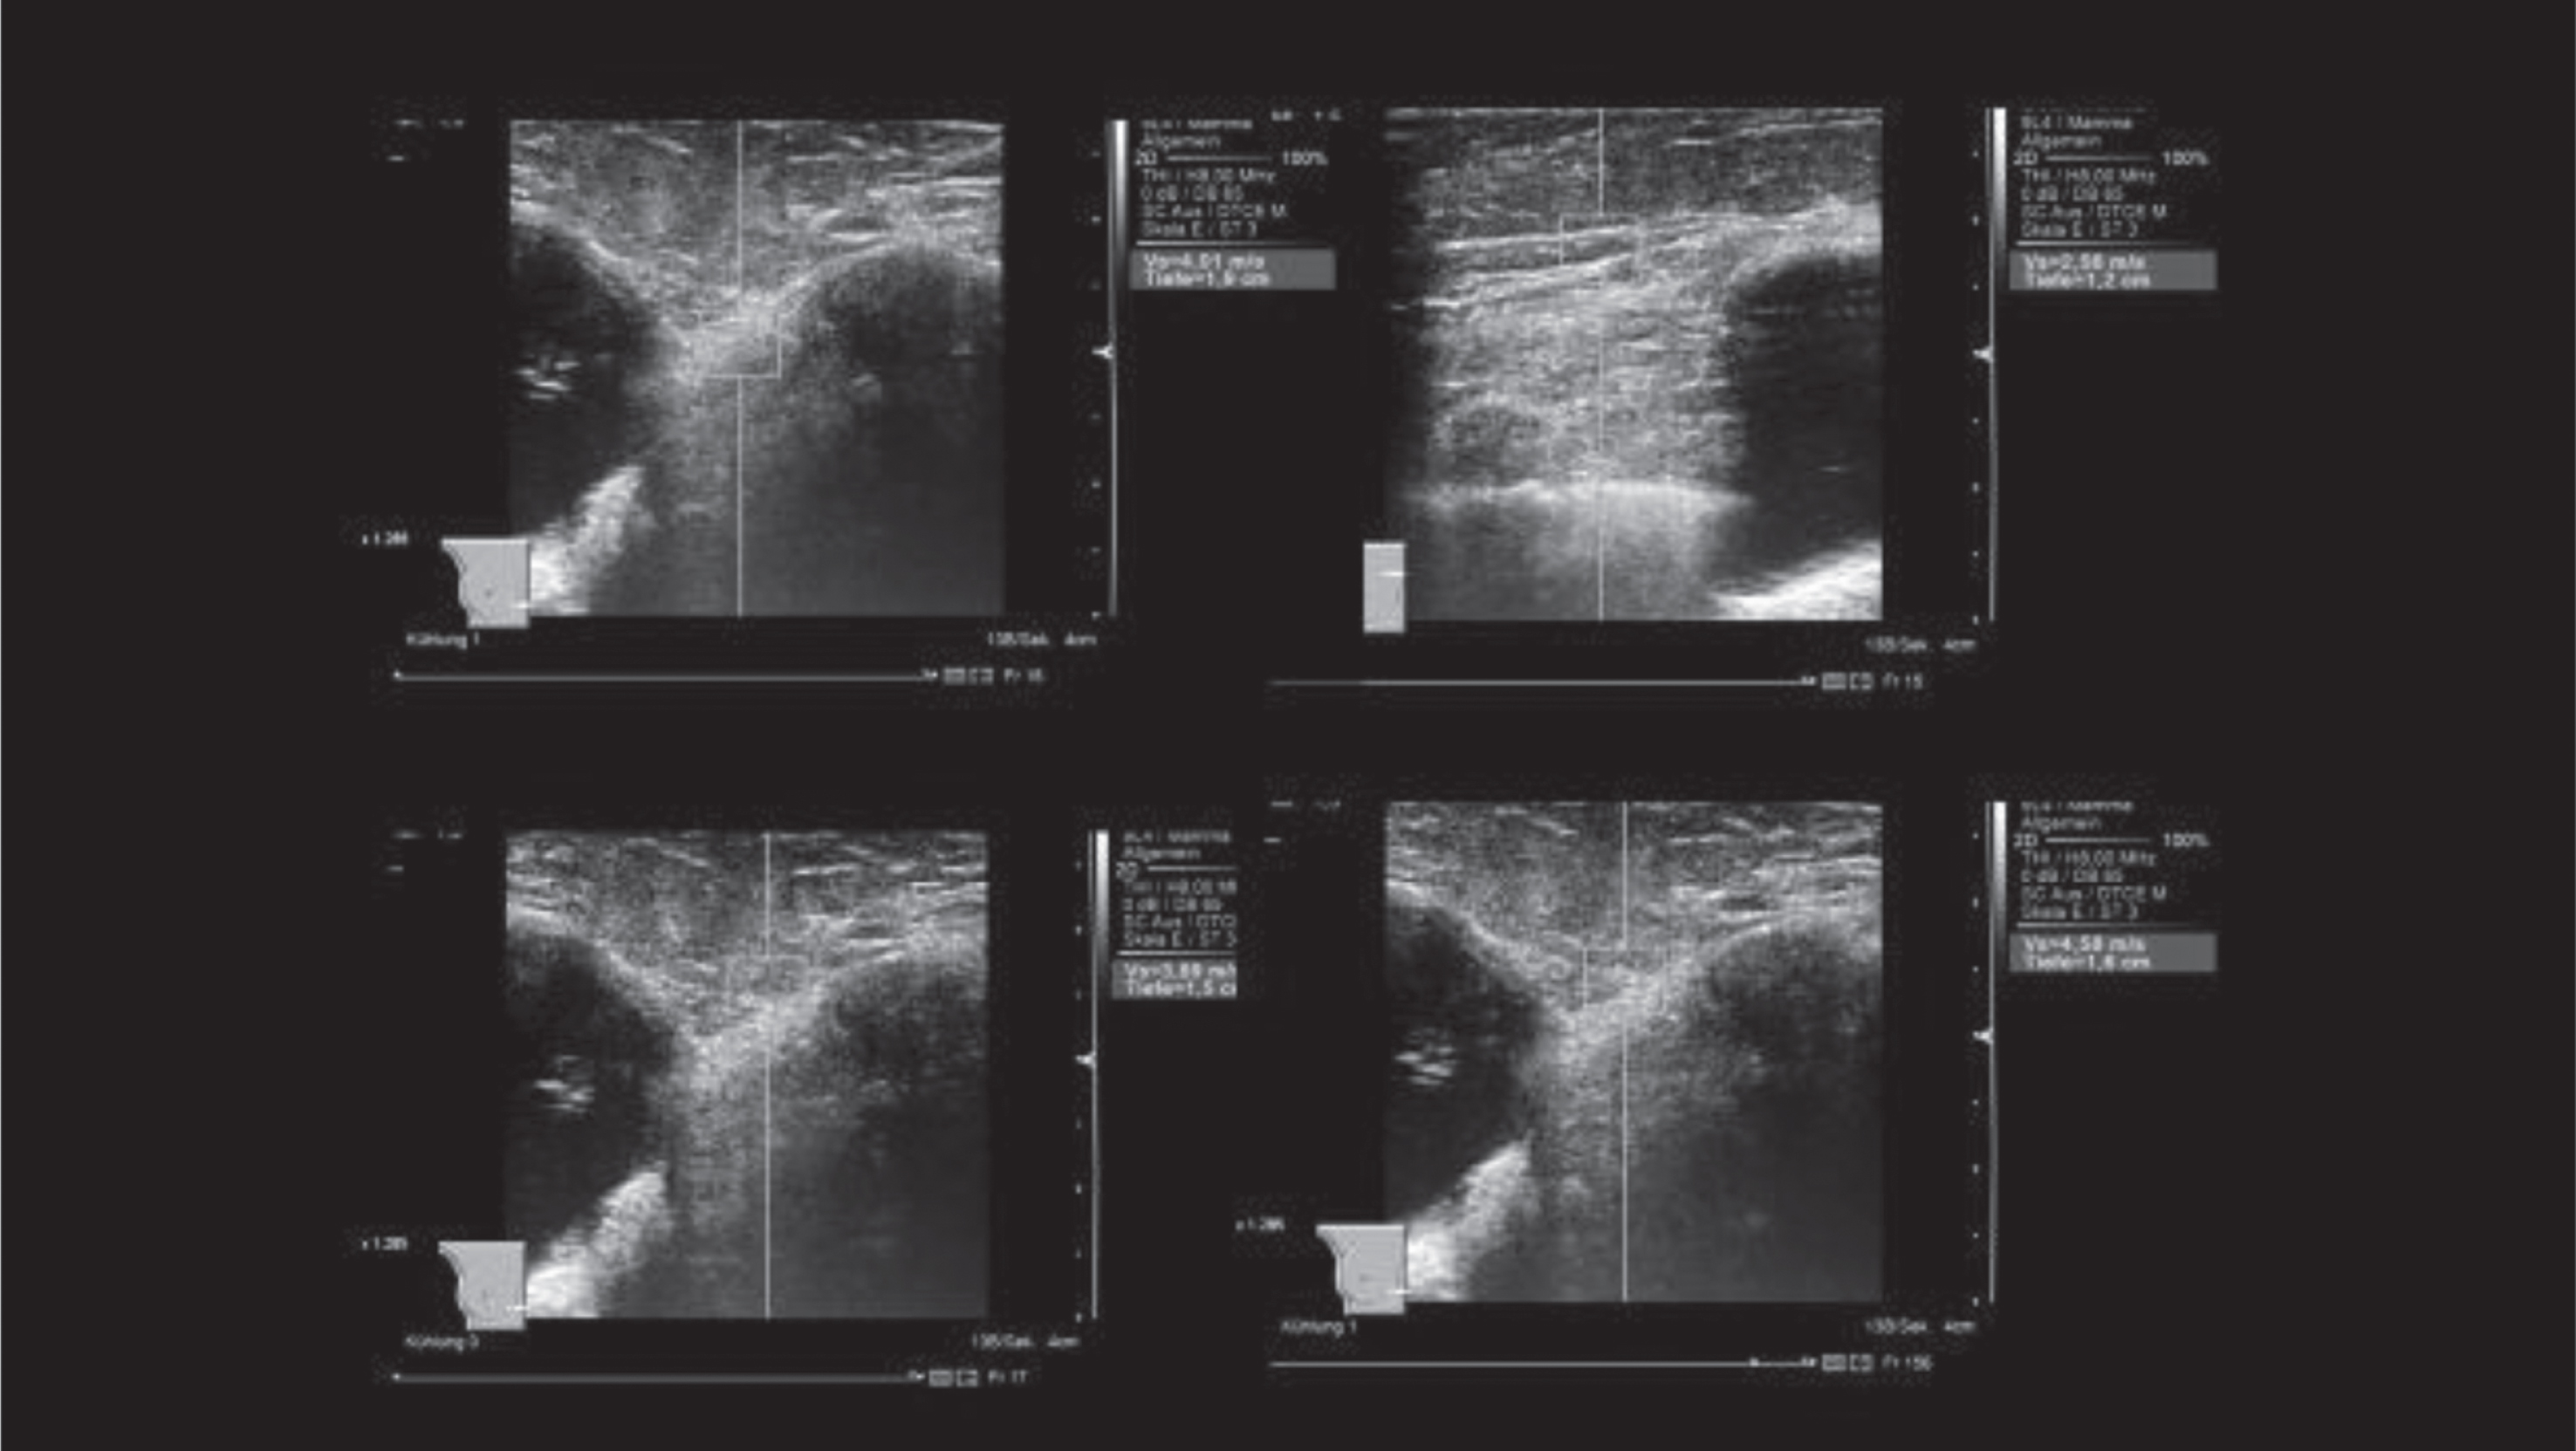
Acoustic Radiation Force Impulse (ARFI) values from 2.56 m/s to 4.58 m/s in the region of interest. Irregular surface structure and thickening of the capsule. The ARFI values indicate periprosthetic densification (patient with Baker score 4).
Baker score and shear wave elastography correlated also in a positive way (R = 0.754, s. Table 4).
Mean shear wave elastography values±standard deviation in the five different regions of interest in relation to the Baker score
Figure 4 shows two representative examples of strain elastography. Figure 3 shows a represent image of minor capsular fibrosis (Baker score 1), whereas Figure shows relevant capsular fibrosis (Baker score 4).
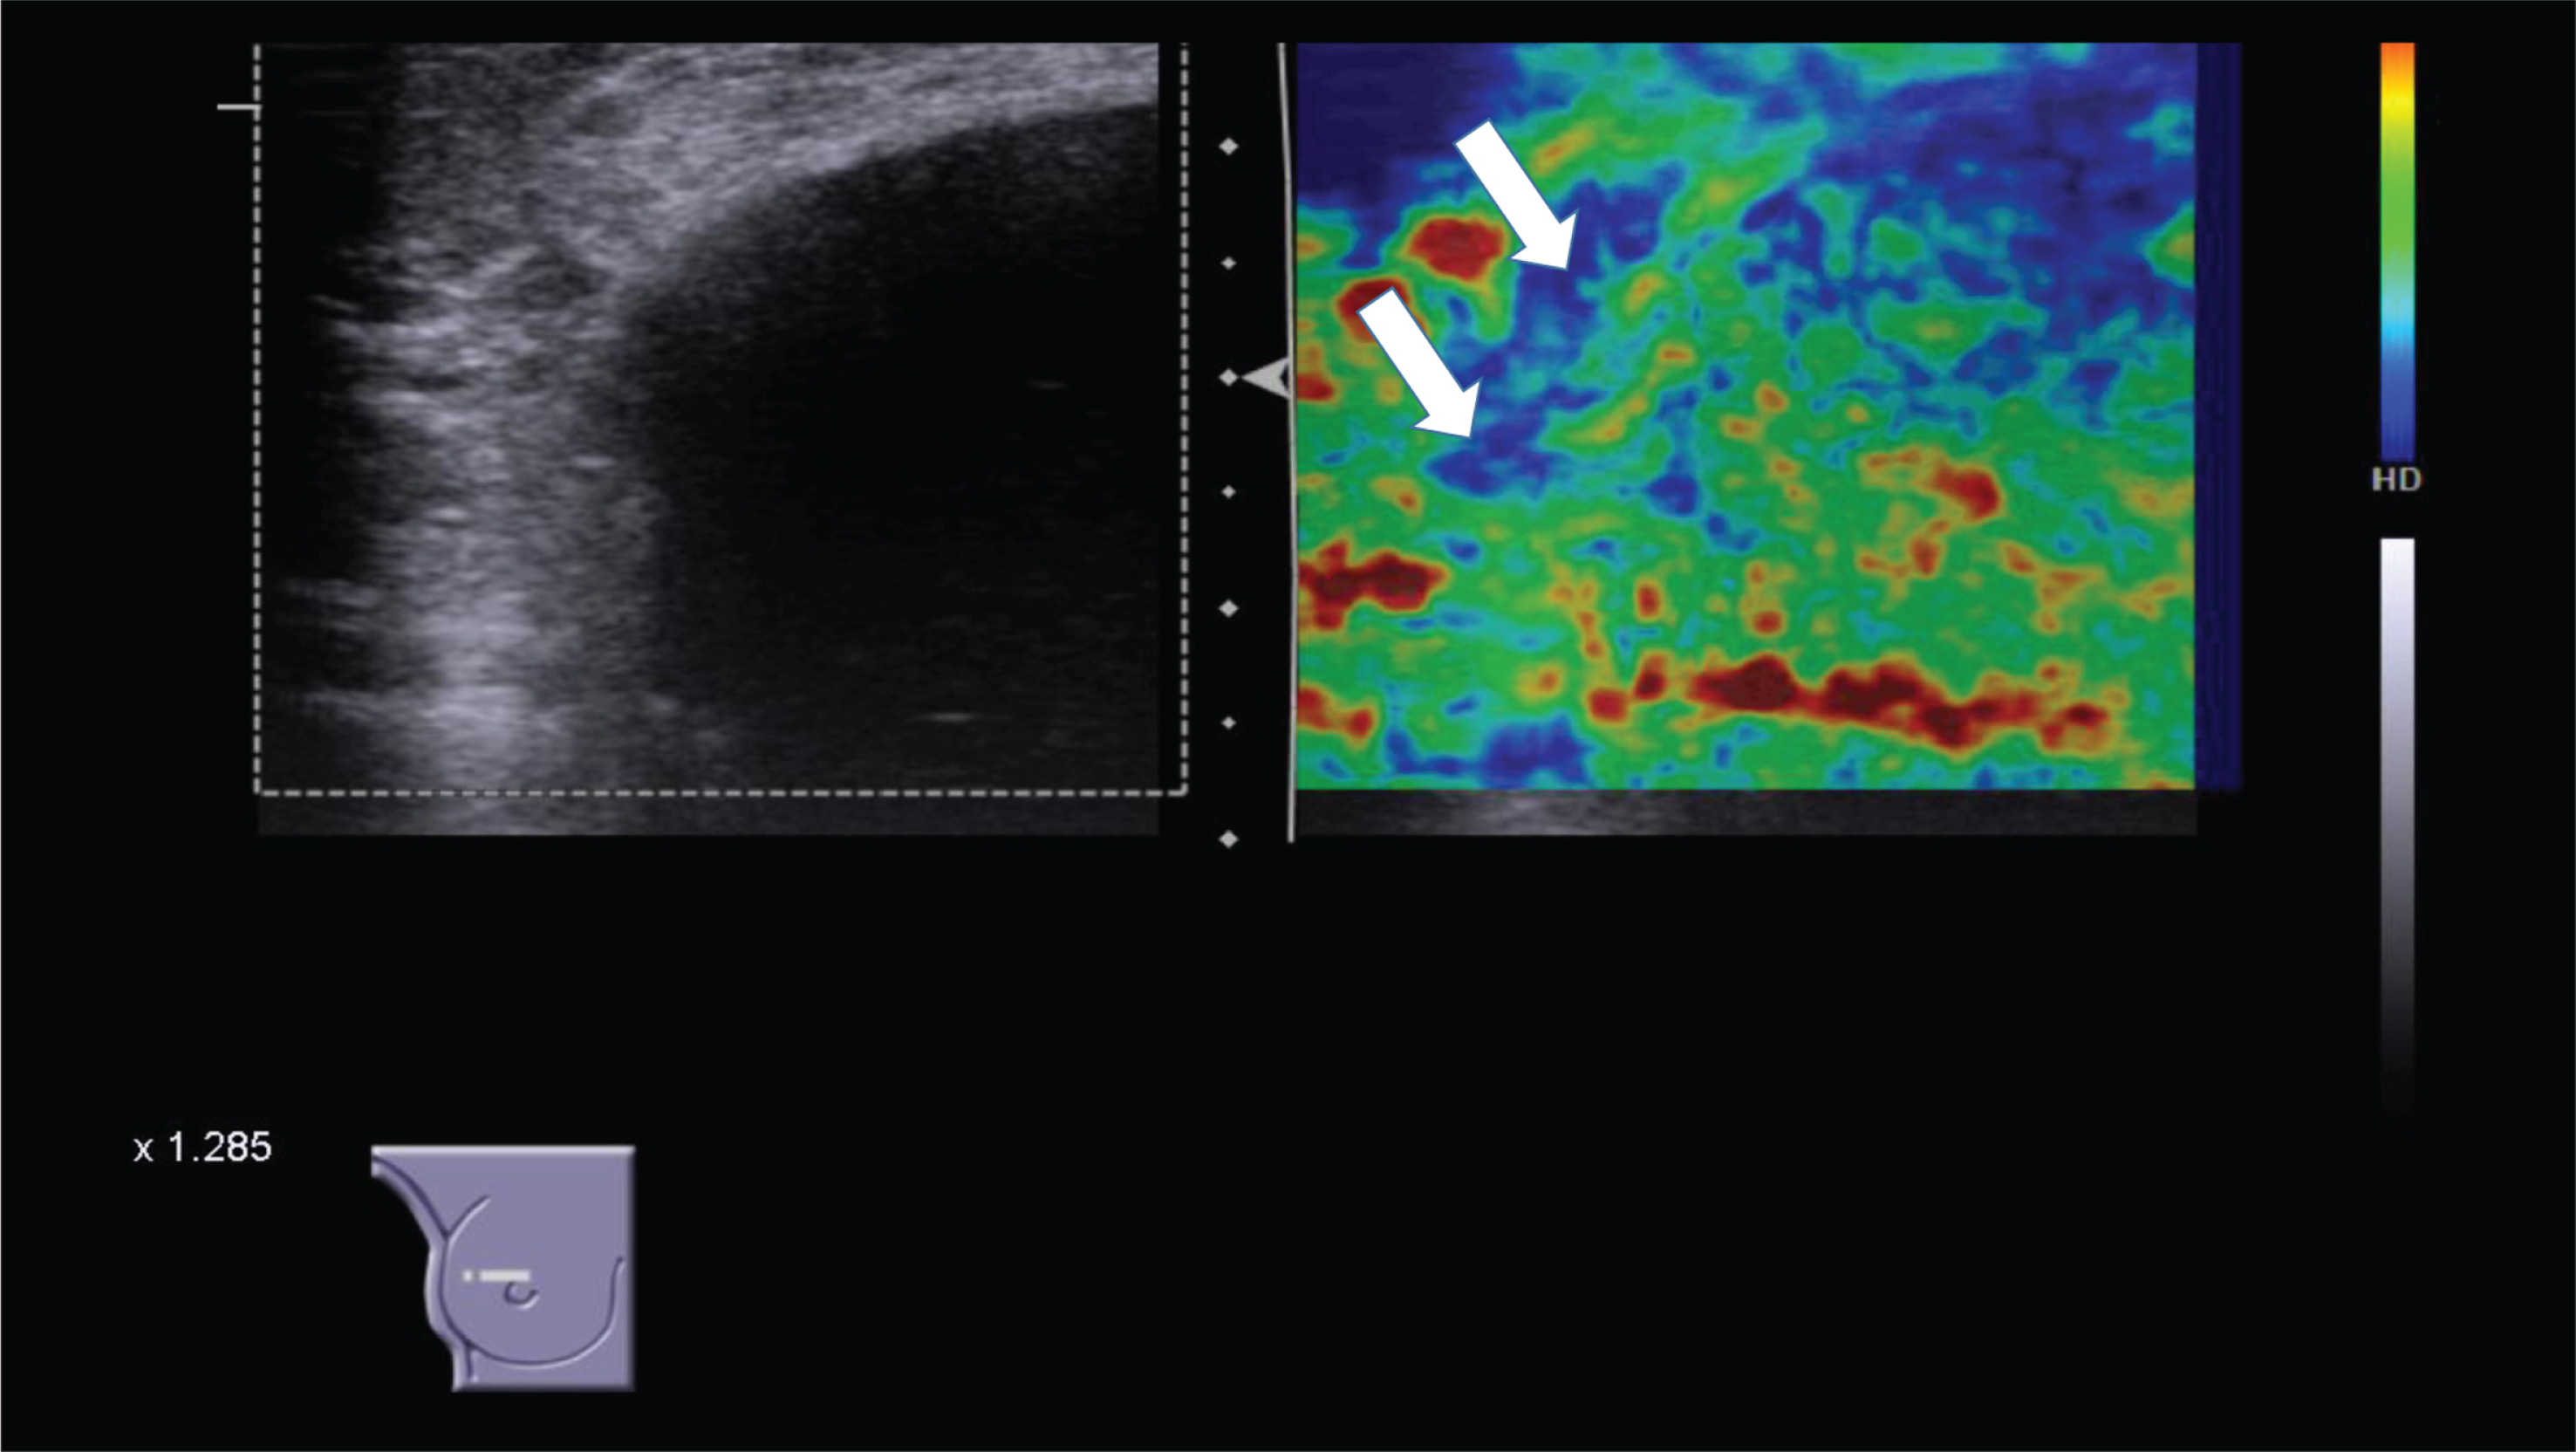
Strain elastography. Low densification. In pseudo-colors only slight periprosthetic condensations are visible as a blue-coded seam around the implant capsule (arrows). Normal soft tissue is coded green, yellow or red.
Strain elastography shows, that the tissue surrounding the breast implant is coded in green and red pseudo colors, when there is minor capsular fibrosis (Fig. 4, Baker score 1). When there is relevant fibrosis (Fig. 5, Baker score 4) the breast tissue is coded blue and green showing the enhanced stiffness of the surrounding tissue.
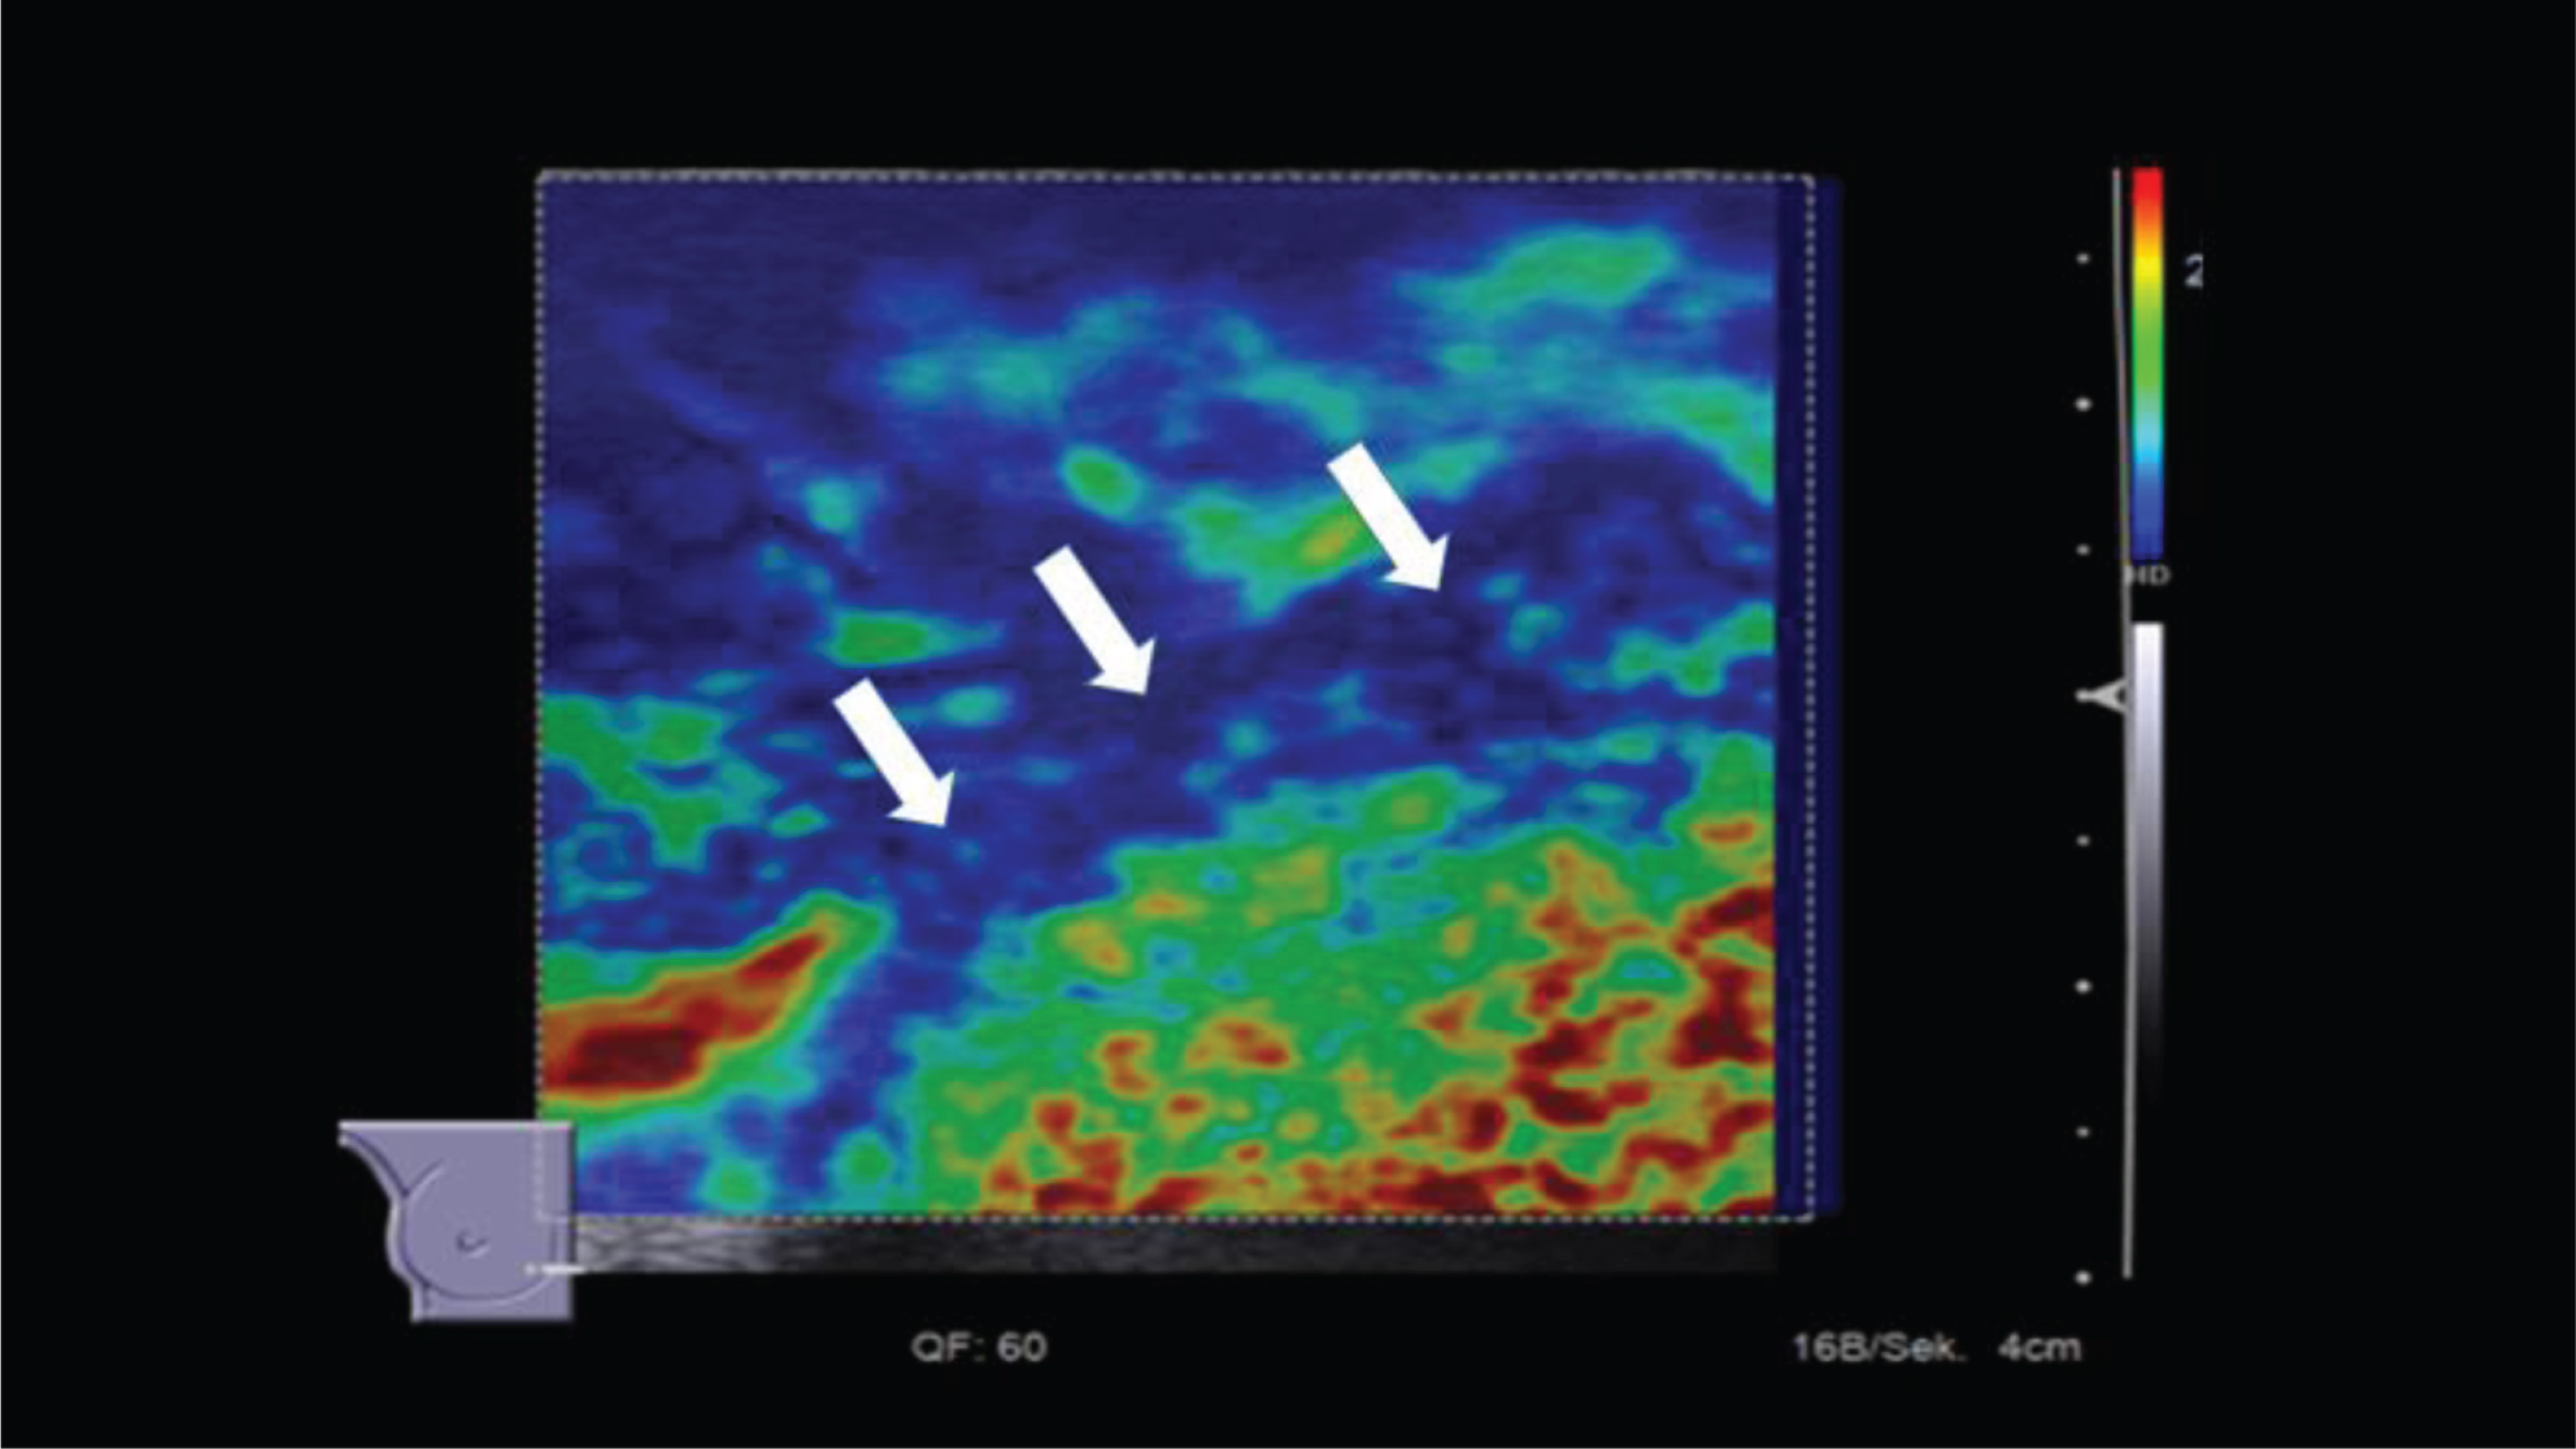
Strain elastography. Marked densification. Significant periprothetic densifications visible s blue-coded seam around the implant capsule. Pseudo-colors of physiological tissue would be coded as green, yellow or red.
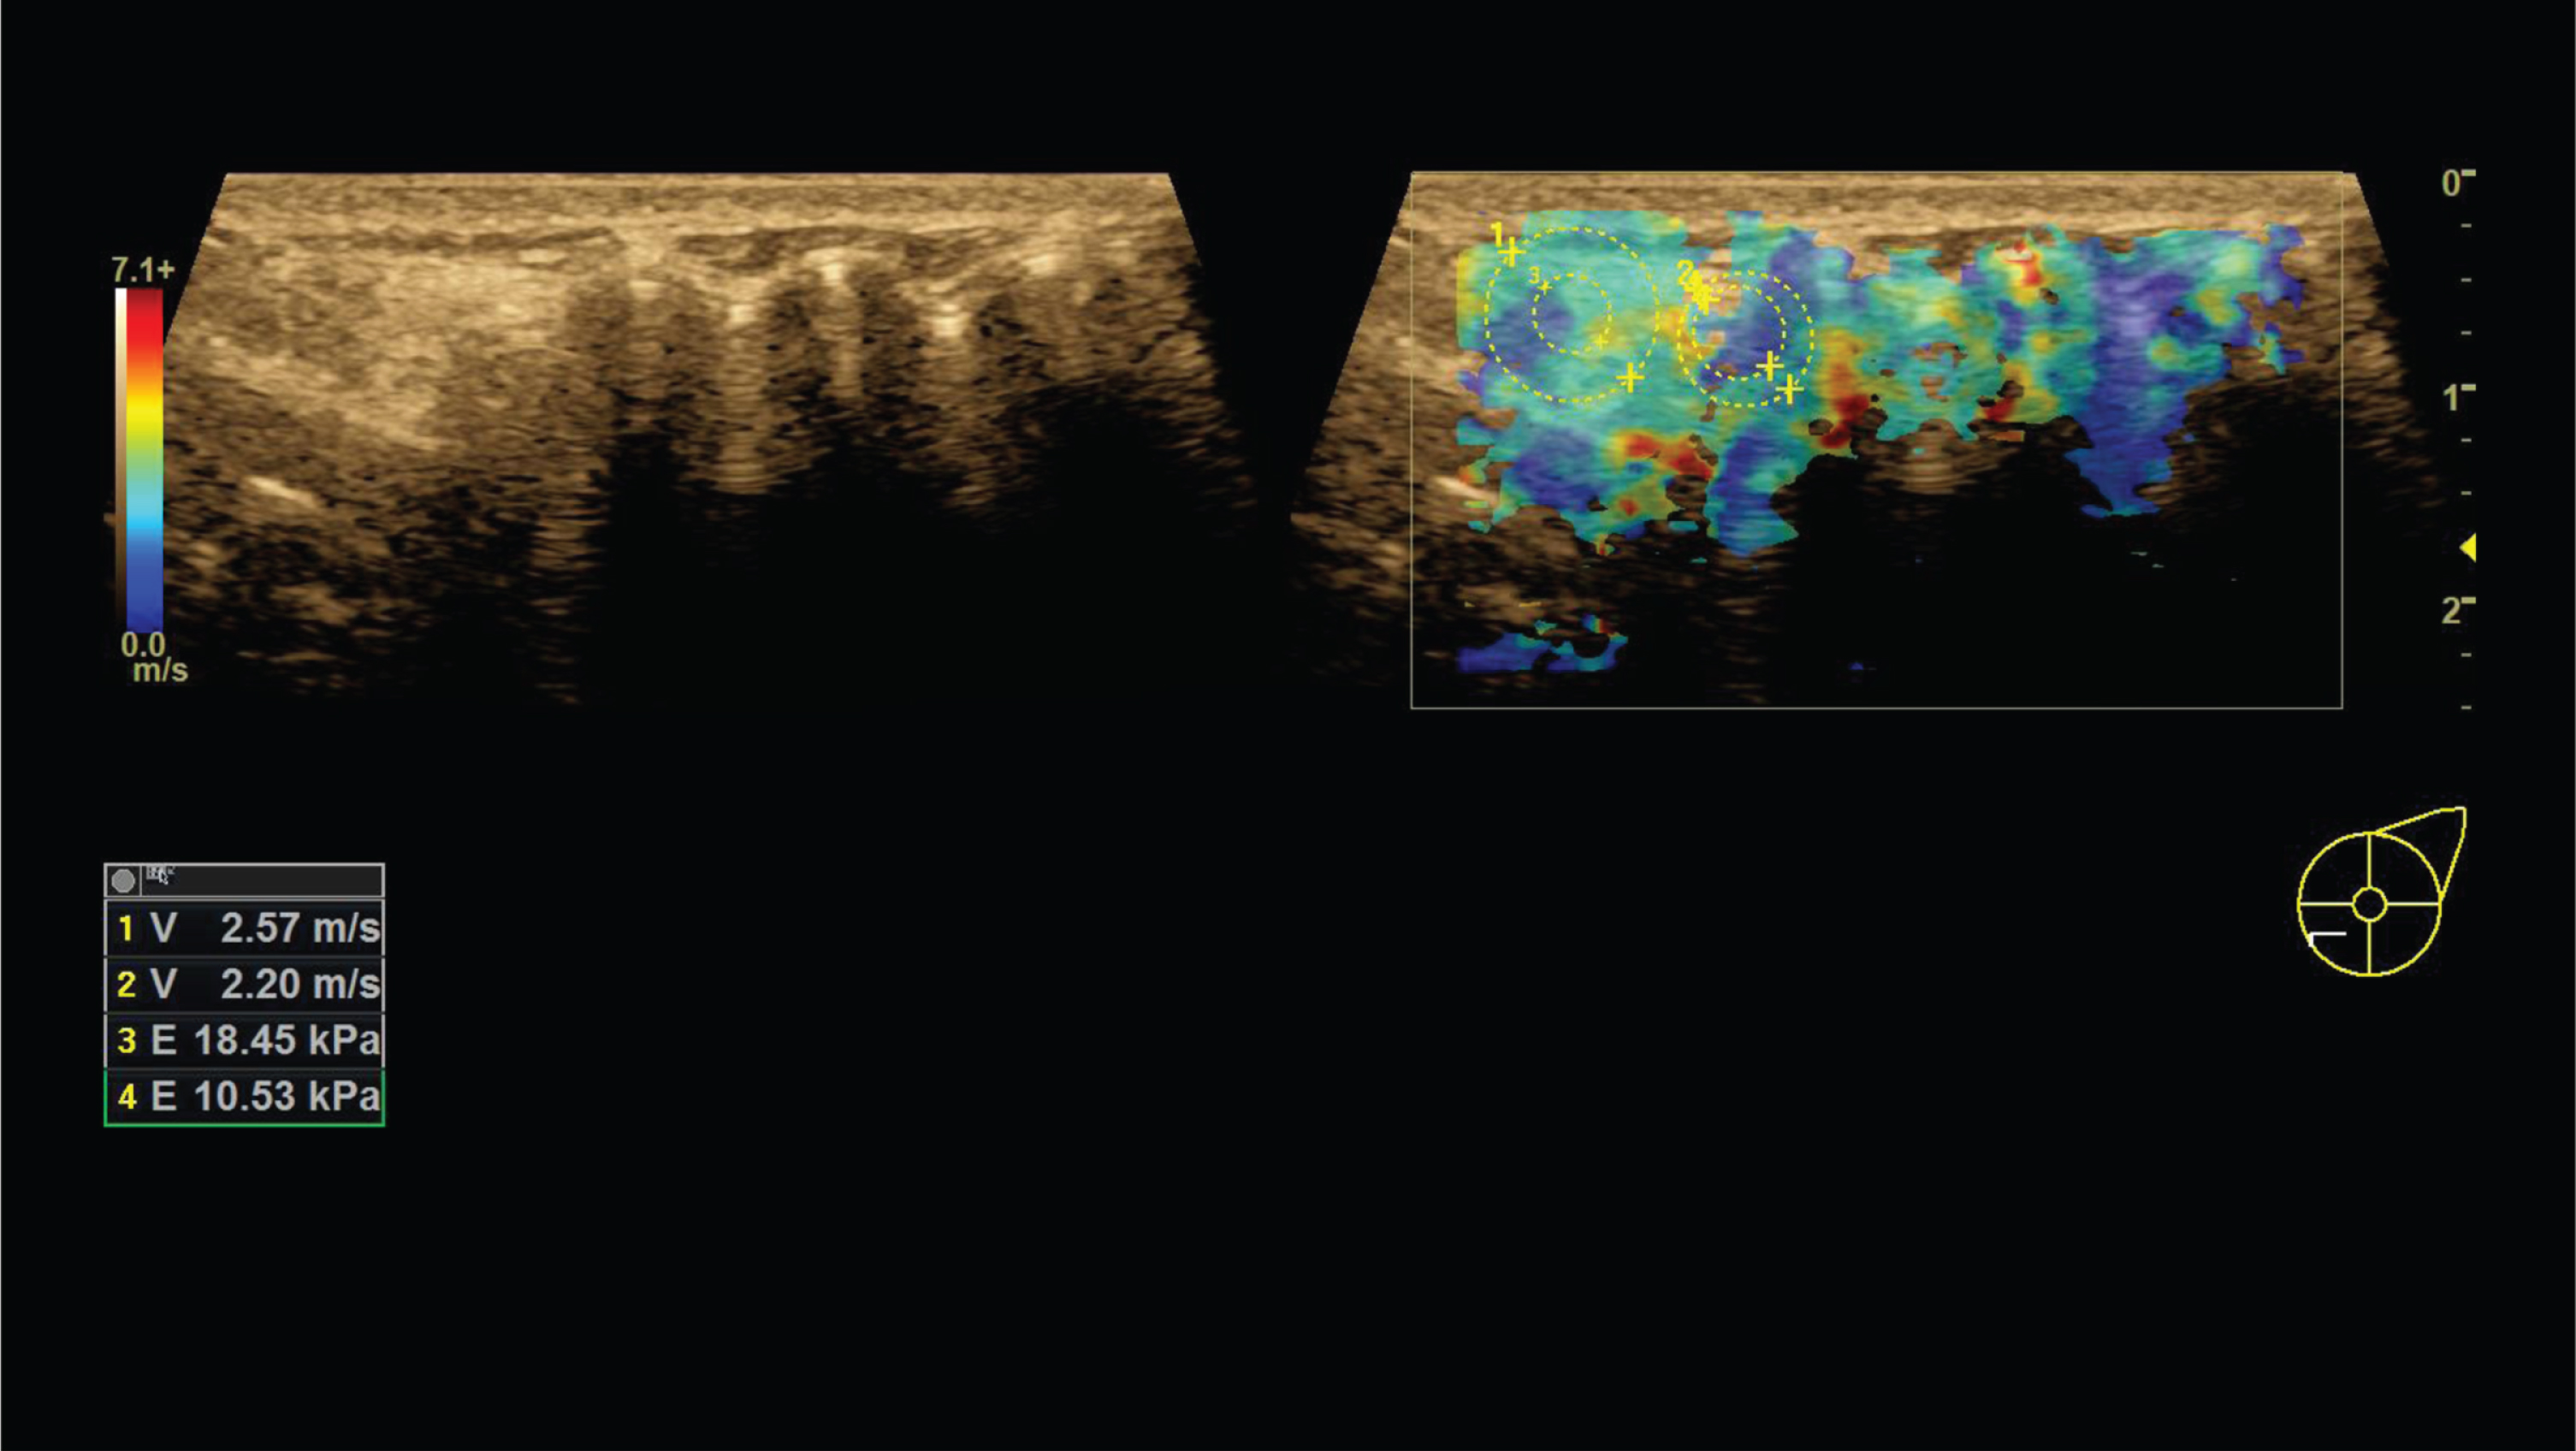
Shear wave elastography: folds with low compression and slight periprothetic hardening. Proportionally wavy surface of the implant, slight thickening of the capsule. Measured values between 2.2 m/s and 2.57 m/s or 10.53 kPA and 18.45 kPA as an expression of low densification of the periprosthetic tissue. Pseudo-colors are coded so that red corresponds to a clear hardening and blue and green indicate rather soft tissue.
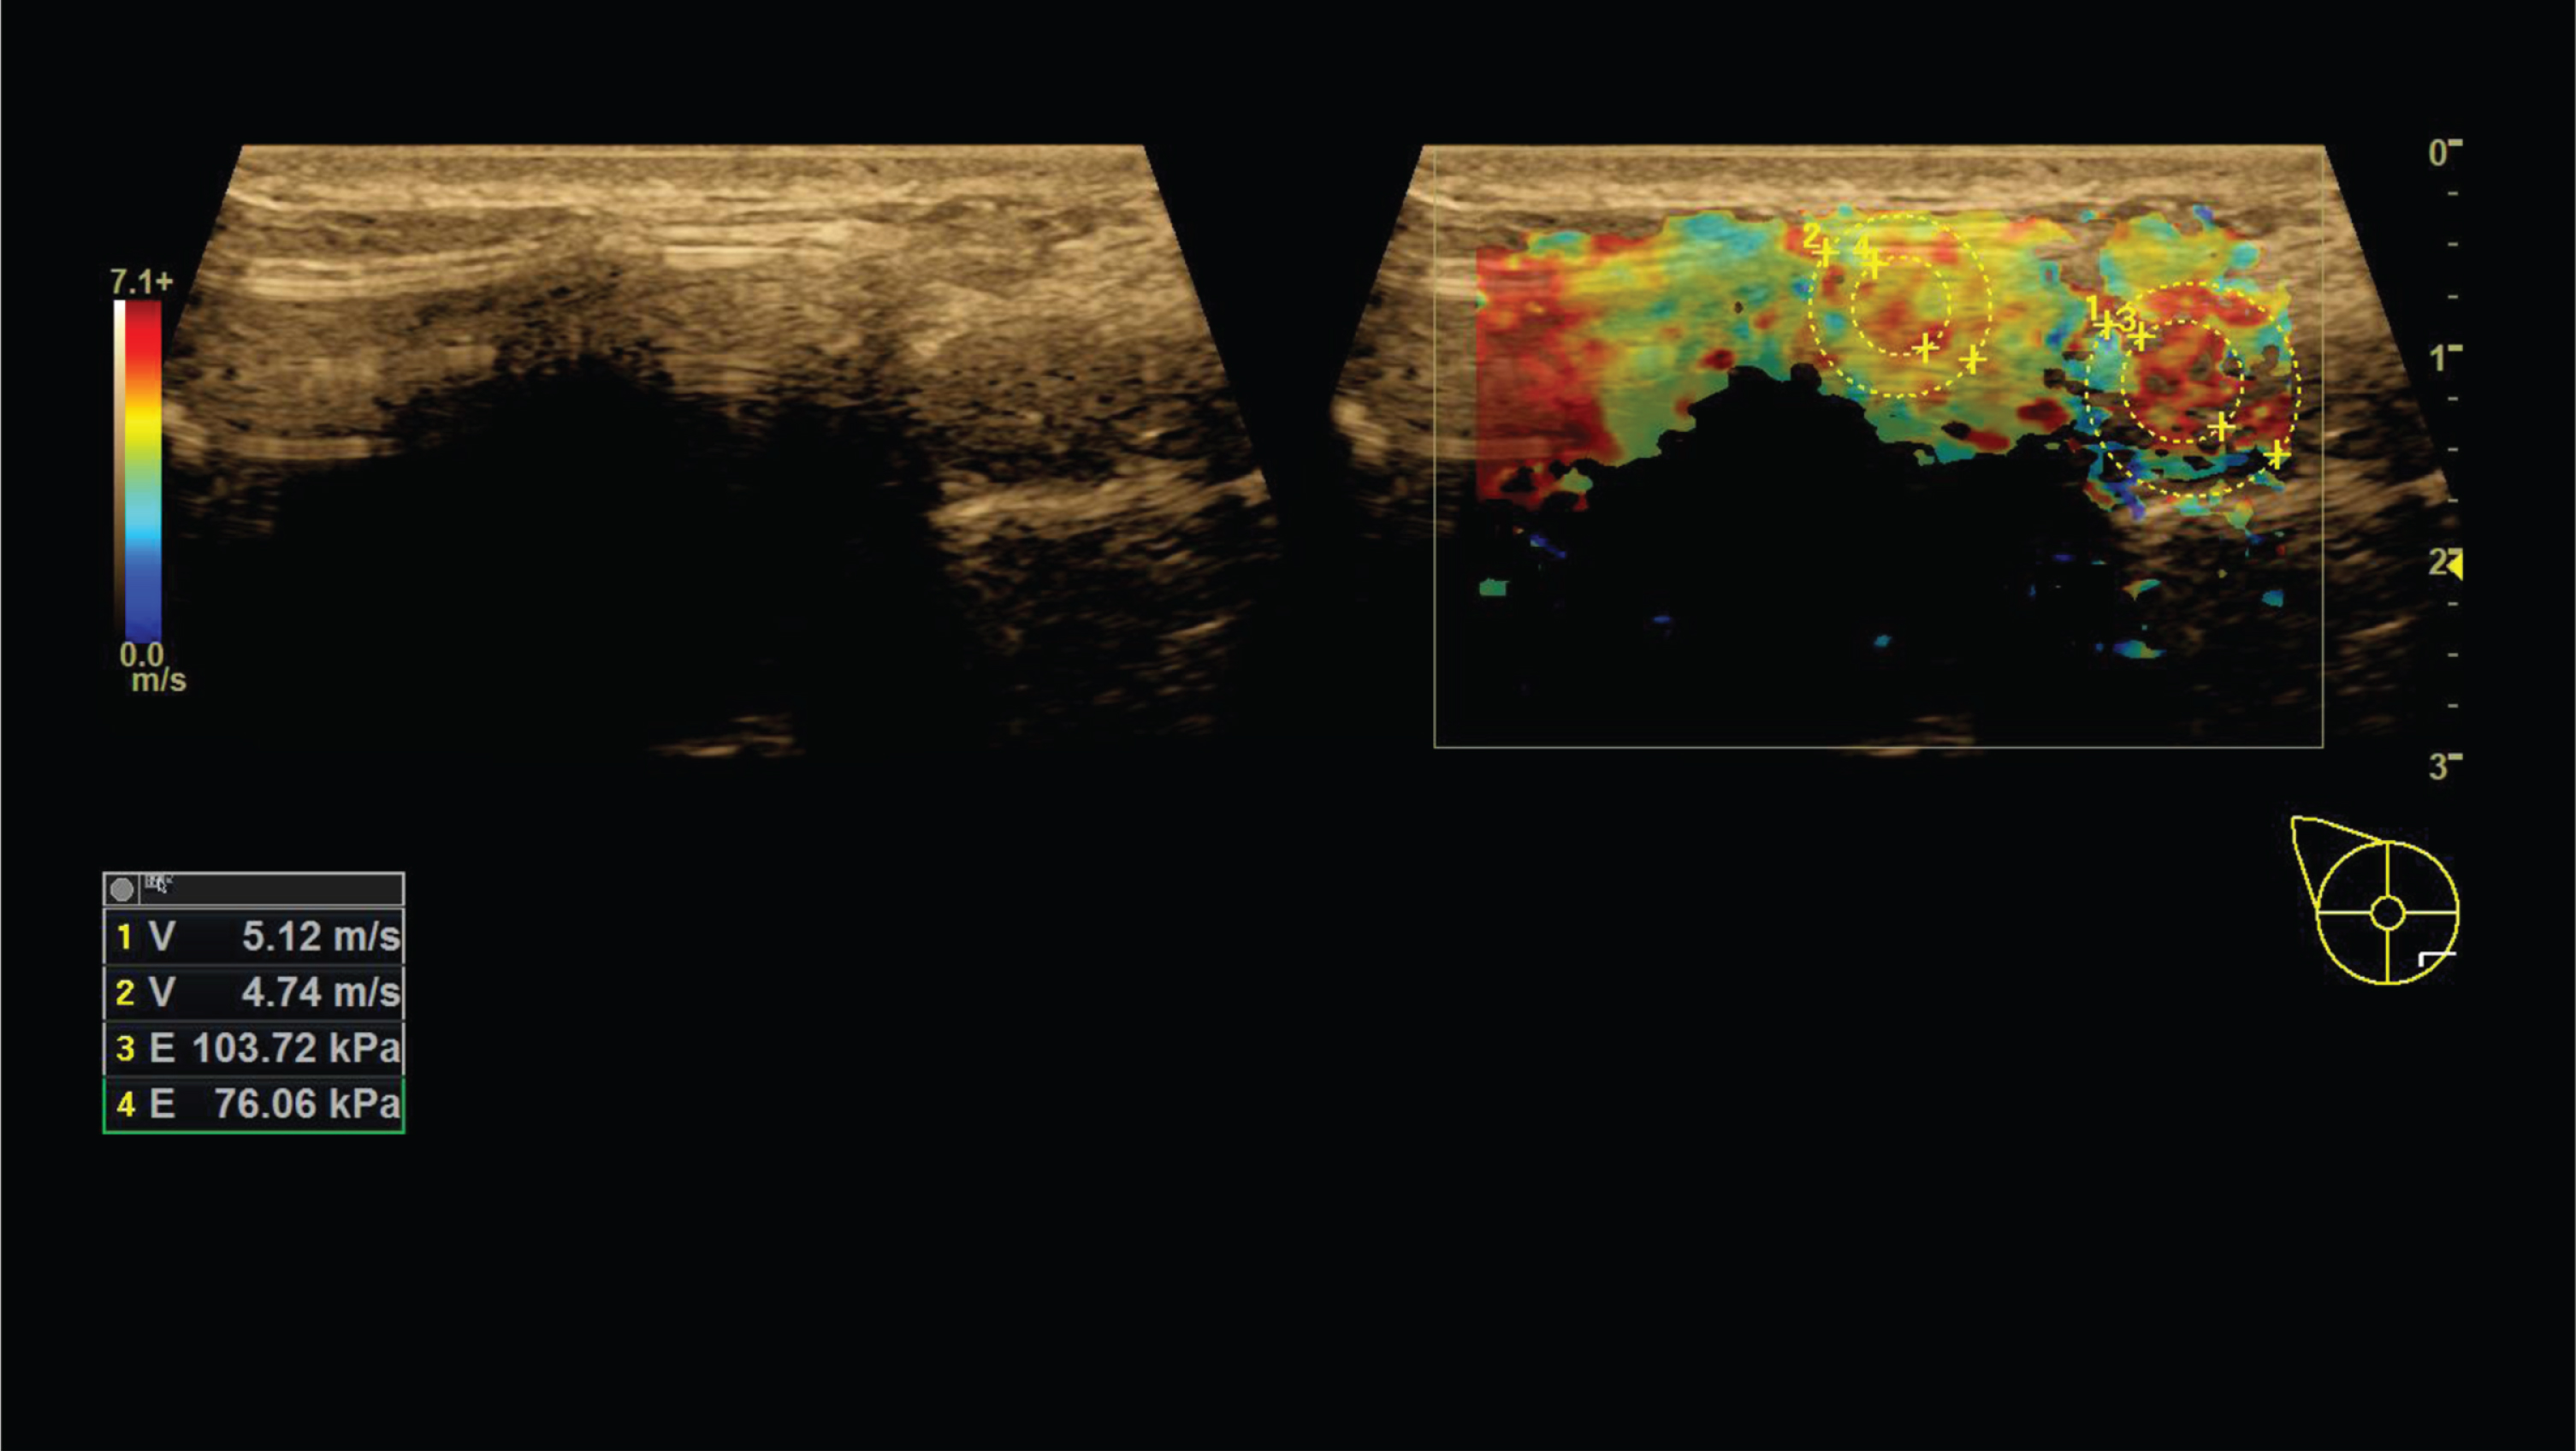
Shear wave elastography: Significant fibrosis. Irregular surface of the implant, significant thickening of the capsule and distinct periprosthetic hardening. Measured values between 4.74 m/s and 5.12 m/s or 76.06 kPA up to 103.72 kPA as an expression of significant periprosthetic fibrosis. Pseudo-colors are coded so that red corresponds to a clear hardening and blue and green indicate rather soft tissue.
To evaluate ARFI and strain elastography values breast tissue without implant was examined also (n = 7). Therefore, the breast without implant was examined in patients with only one breast implant (due to reconstructive surgery). The resulting values were compared to values from the contralateral (breast implant) side. The ultrasound examination on mammary gland tissue without implant did not differ significantly from breast tissue with implants (p > 0.05).
Currently, capsular fibrosis is classified according to the clinical Baker score, which is based upon visible and palpable findings of breast tissue. An assessment of the exact tissue morphology is hardly possible. Ultrasound diagnostics including elastography provide useful additional information therefore. Changes regarding the surface of breast implants, tissue texture or circumscribed indurations can be mapped and quantified in different ways. While ARFI imaging is established to detect the stiffness of liver tissue and the degree of liver fibrosis [15], it is used for the detection of capsular fibrosis in this study [23–26]. A linear multi-frequency transducer was used, whereas liver ultrasound is performed with convex transducers usually. In this regard, it was necessary to implement the technical requirements for the linear transducer and breast tissue. The ultrasound transducer sends out defined pulses to measure the tissue densification as changes in the wave velocity. These wave changes can be detected in defined measuring fields or via color-coded boxes to be set manually. The different procedures were used to record tissue properties to compare them with the clinical Baker score.
The improvement in pain sensation using a visual analogue scale preoperatively and postoperative after insertion of polyurethane (PU)-coated implant (Polytech) confirms the benefit of this implants for patients at risks for capsular contracture. A limitation of the study is that a hardening of the tissue occurs also after PU implants, but not a homogeneous capsule formation as with smooth or textured implants. The evaluation of PU implants according to the clinical Baker score is therefore much more difficult if at all possible than with the other implants.
The periprothetic breast tissue could be classified into different degrees of density from a complete involution to tissue densification and fibro-glandular tissue in all quadrants. However, further differentiation of the local extent of tissue properties is possible using elastography ultrasound technologies. The strain technique allows gradual classification in 6 different levels. Only the shear wave elastography technique allows quantitative measurements with defined measuring units in m/s or kPA. ARFI imaging established in numerous studies in terms of liver fibrosis can be used to define quantitative values. Values greater than 2.3 m/s indicate an enlarged stiffness of the periprothetic tissue and refer to fibrosis. These initial results show that in case of capsular fibrosis, values of up to 6 m/s (or >50 kPa respectively) may occur.
Considering the literature, the Baker scale was created to evaluate capsular contraction, but this classification could be somewhat subjective. In the Baker scale capsule formation gives a result of 3 or 4. The highest score was up to 2.5, and it was determined in two breasts, in two different patients. The evaluation of the second breast of these patients was correct, and the result on the Baker scale was lower [35]. Sono-elastography is a non-invasive examination which may be used in the assessment of capsule formation. It is important to note that this method give us a possibility to examine all tissue elasticity separately, which is impossible in palpation and the Baker score evaluation. On the other hand, the results of the research showed that there is no correlation between the elastographic measurement at the second and third visit (postoperatively) and the Baker score.
A first pilot study showed a high correlation between these evaluations [30]. Differences in the results might be caused by a more variable group in the Prantl study [30] (in our study, the score on the Baker scale was not higher than 2.5) or insufficiently large groups: in Prantl’s study the research group included 11 patients, in ours 13 patients. Our results and those of Prantl are the first results so far in evaluation of capsule formation by the new method. In other applications sono-elastography was proved to be reproducible and useful in breast tumor detection [30, 36].
Limitations of the study were, that the techniques of shear wave elastography and ARFI are not developed for scanning of breast implants. Normally evaluation of the tissue stiffness is possible only in layers deeper than 1 cm, up to a maximum of 5 cm. But considering the results of others studies just published by experienced examiners ultrasound elastography could be very helpful for future detection of different degrees of periprothetic fibrosis [27–33]. For inflammatory reactions appositional contrast enhanced ultrasound would be helpful [34]. The study revealed a positive correlation between the clinical hardening of the breast (Baker score) and ultrasound elastography. However, the individual measurements can show high variability. Especially at tissue boundaries with high density differences such as breast tissue, capsule and silicone, various factors can influence ultrasound signals such as absorption, reflection, refraction which might induce artifacts such as reflections and reverberation.
It is important to gain further experience to be able to define standard values for different degrees of tissue densification. Therefore, it is important that both clinical examination and ultrasound diagnostics are performed by experienced physicians. These first results motivate to initiate a prospective multicenter evaluation.
Conflicts of interest
The authors have nothing to disclose.
Funding
No funding was received for this article.