
Abstract
BACKGROUND + OBJECTIVE:
Age-related macular degeneration (AMD) is the most common cause of practical blindness in people over 60 years of age in industrialised countries. We formulated a hypothesis that a group of initial laboratory parameters would be suitable for prediction of prognosis of AMD, allowing for individual modifications in treatment intensity.
PATIENTS AND METHODS:
66 patients with dry form of AMD were treated using rheohaemapheresis with an individual follow-up period of more than 5 years. The patients’ initial laboratory data was split in two subgroups based on treatment success and analysed using discriminant analysis (analysis of the linear and quadratic models using the automated and interactive step-wise approach) by means of the Systat 13 software.
RESULTS:
Prediction of prognosis based on the initial laboratory parameters was correct in 79% of unsuccessfully treated patients, allowing for early detection of high-risk patients. With the use of a quadratic model, the prediction was correct in 100% of unsuccessfully treated patients and in 75% of successfully treated patients.
CONCLUSION:
Implementation of discriminant analysis is a promising method for prediction of prognosis, especially when the patient is at risk of AMD progression, which allows for early and more intensive monitoring and treatment.
Background
The evaluation of clinical medicine prognosis is extremely important in a number of diseases. These are mainly cerebral, cardiovascular and other diseases that lead to complications varying from serious to fatal, unless effective prevention and treatment are carried out. The identification of indicators that could determine the future fate of patients as early as at the time of disease detection would make it possible to modify the manner and intensity of therapy in individual cases – enabling the choice of more effective treatment for a progressive disease, or more saving treatment for mild forms of disease. This is called “custom-tailored medicine” in modern methodology.
In our paper, we focused on age-related macular degeneration (AMD), which usually progresses over the long term. Patients are monitored for a long time, therefore clinical results are available, enabling accurate assessment of disease progression. Due to our long-term experience in the monitoring and treatment of this disease, our Ophthalmology Department has relevant results, acquired over the past 10 years.
Characteristics of AMD and therapy possibilities
AMD is a degenerative retinal disease that causes progressive changes of visual acuity (visus) in patients and is the most common cause of practical blindness in people over 60 years of age in industrialised countries [1]. The incidence of this disease increases with increasing average age of the population. Some new information regarding diagnostics and therapy is stimulating, AMD, however, continues to be an incurable disease. Serious loss of visual acuity occurs in approximately 10–15% of patients [2–5].
Despite all efforts, there is currently no satisfactory therapy for AMD. Treatment modalities include changes of lifestyle (no smoking, physical activity, omega-3 fatty acids), and increased use of antioxidants (vitamin C, vitamin E, β-carotene, zinc and copper). Based on the AREDS2 study, the aforementioned combination of antioxidants had a partial effect on reducing the risk of AMD progression –after 5 years, progression occurred in 20% and 28% of patients in the treated and placebo groups respectively [6]. Other treatment options are subject to ongoing research –complement inhibitors, prostaglandins, anti-amyloid antibodies, neuroprotective medication, and others [1, 7].
Another treatment modality in the case of the dry form of AMD is rheohaemapheresis, which we have been developing in our Department over a long period [8–10]. Rheohaemapheresis leads to elimination of a precisely defined spectrum of high-molecular weight proteins, including fibrinogen, 2-macroglobulin, LDL-cholesterol, IgM, fibronectin, and von-Willebrand factor. These changes improve erythrocyte flexibility and result in the reduction of whole blood and plasma viscosity, erythrocyte and thrombocyte aggregation. Repeated pulses of lowered whole blood and plasma viscosity lead to rapid changes of blood flow, subsequently inducing sustained improvement of the microcirculation [11, 12]. In this context, it represents the complete interactive network between epithelium, fibroblasts, and endothelial cells, extracellular matrix, and blood components [13]. Repeated results show that rheohaemapheresis may lead to the reduction of AMD progression in the long-term perspective [14, 15]. Rheohaemapheresis in the dry form of AMD is also recommended by the Guidelines of the American Society for Hemapheresis [16].
Objective
We have created a hypothesis that a group of initial laboratory parameters would be suitable for the prediction of AMD prognosis. Laboratory indicators from the beginning of the treatment were compared between groups of successfully and unsuccessfully treated patients, in an attempt to identify the relevant biomarkers for predicting success.
Methods/Patients
Rheohaemapheresis method used as treatment
We used our own modification of Borberg’s “rheohaemapheresis” [17–19]. To obtain plasma, we used continuous separators (Cobe Spectra or Spectra Optia, Terumo BCT, Lakewood, Co, USA) and Evaflux 4A filters (Kawasumi, Tokyo, Japan) to wash the obtained plasma. The flow through the filter was controlled, using the CF100 automatic machine (Infomed, Geneva, Switzerland). See Fig. 1. Anticoagulation was performed using a combination of heparin and ACD-A (Baxter, Munich, Germany). Between 100% and 150% of body blood volume was washed. The procedures were performed from the peripheral vein in the elbow pit or in the forearm. We presented some more detailed data separately [20, 21].
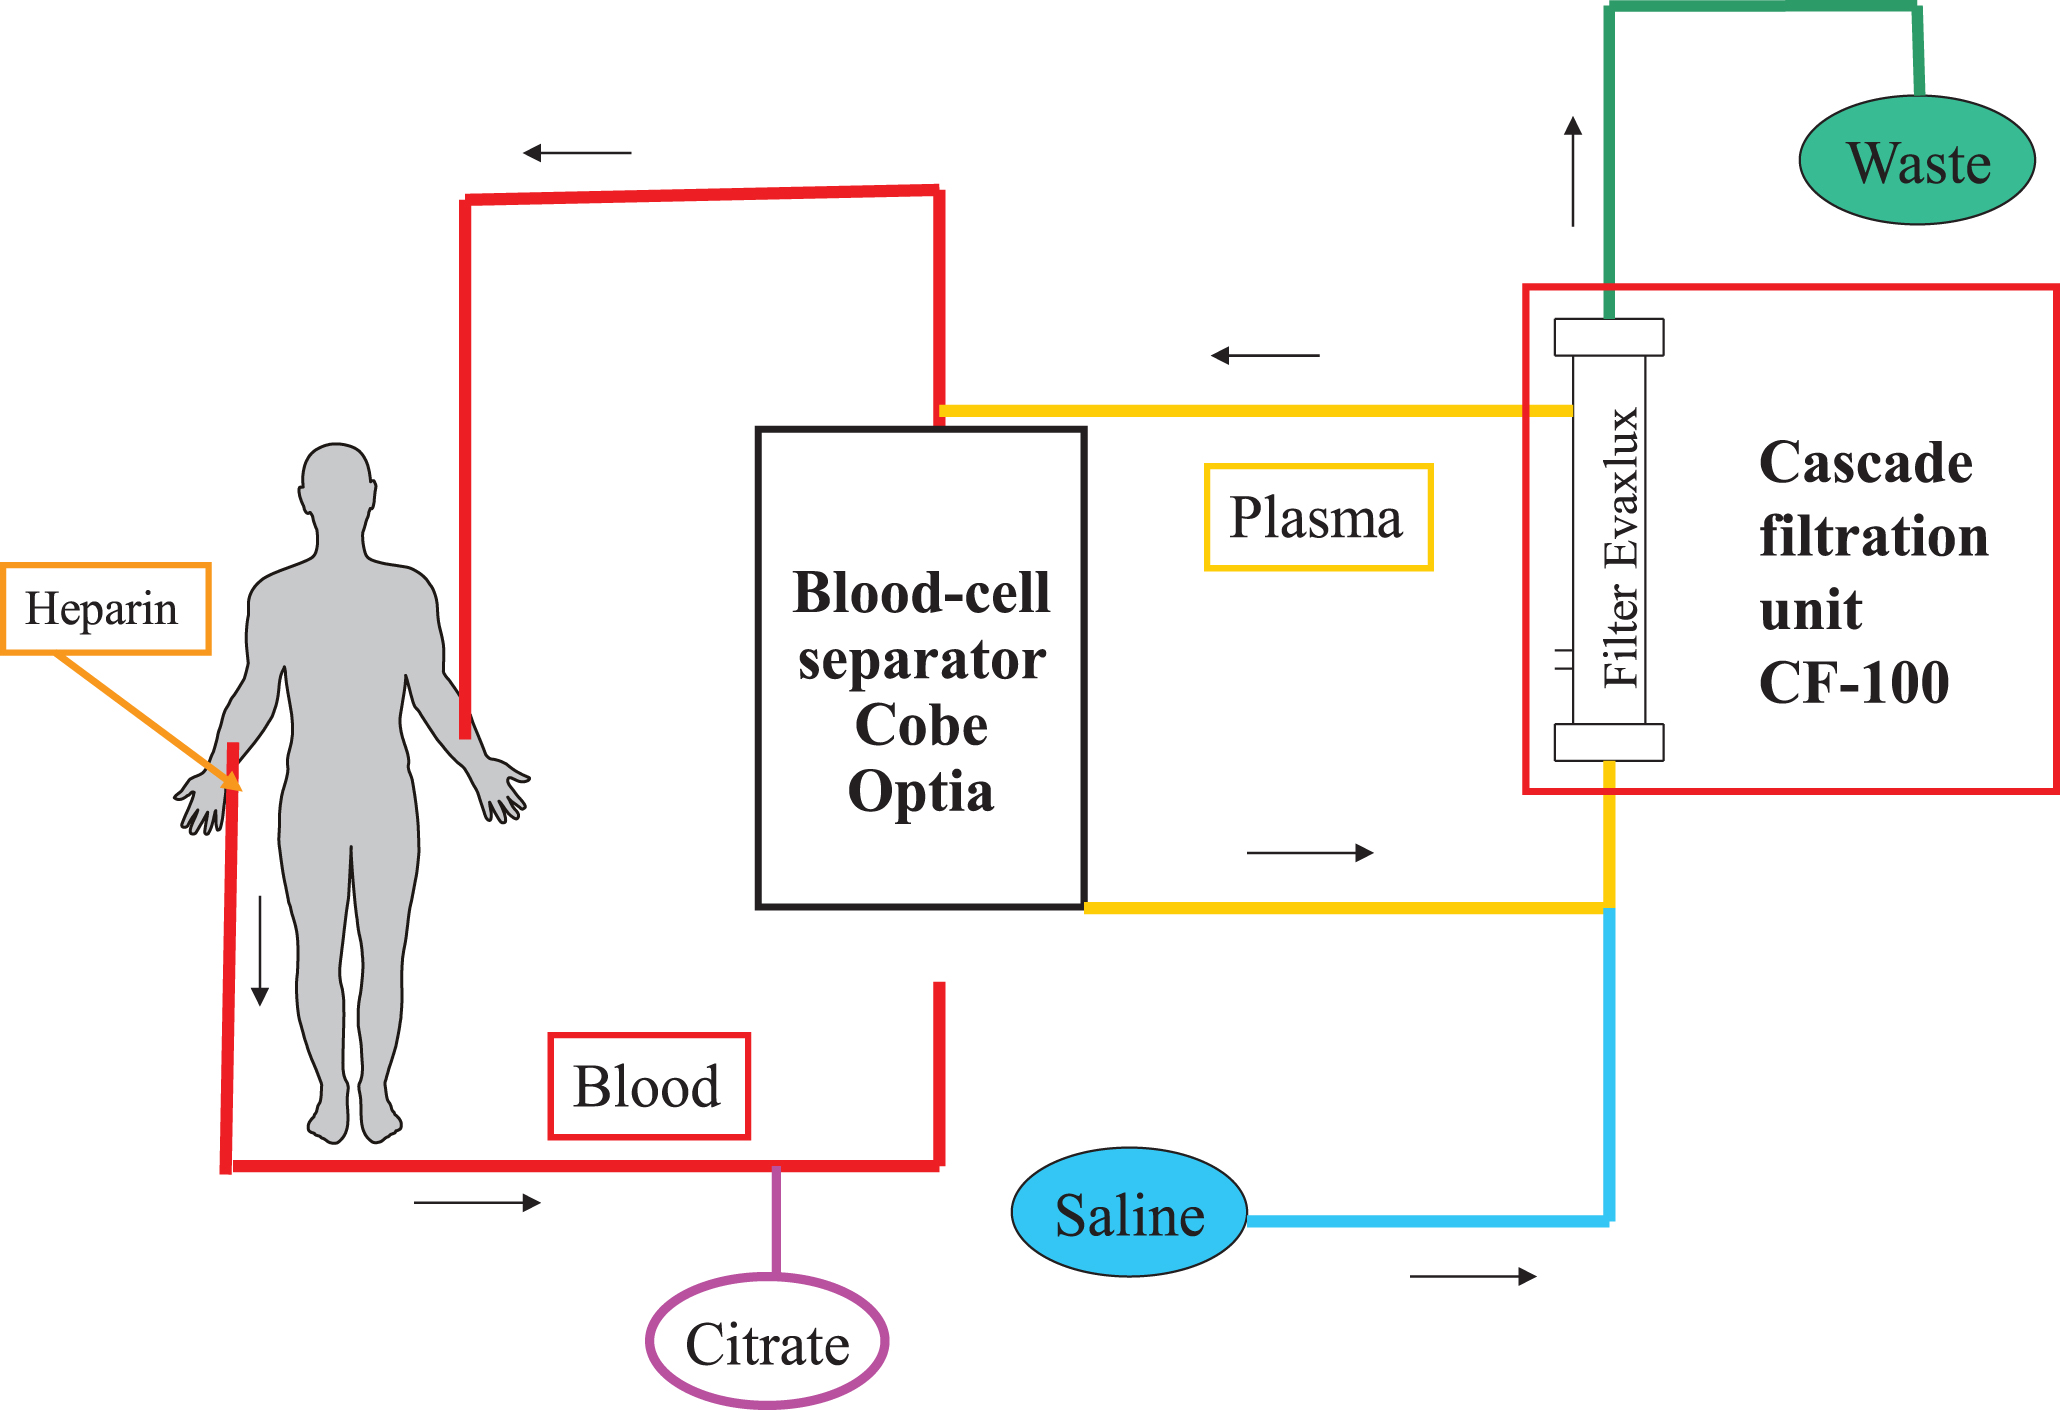
Principle of Rheohaemapheresis. Legend: Blood is collected from the peripheral vein, plasma is obtained in the separator and flows through the Evaflux filter. Washed plasma with erythroctes is then returned to another peripheral vein of the patient.
The treatment scheme was performed for patients with AMD according to the MIRA-1 study [22]; 8 procedures in 10 weeks, i.e. 2 aphereses weekly at intervals of 2–4 days, followed by a break of 14 days, followed by another series of aphereses. The patients were then followed up every 6 months. The effects of a successful treatment last from 2 to 2.5 years, according to our experience. It is recommended (based on the literature data and our experience [13, 23]) that 1–2 additional procedures are performed to boost the effect (“booster therapy”) after this 2-year period. For our group of patients, we decided on 2 procedures within 1 week.
Patients and methods
We treated 81 patients with AMD, using rheohaemapheresis between January 2006 and August 2019. The patients were followed up for a long period of time. As of 31 August 2019, the median of follow-up was 8.95 years. In this study, 66 patients who completed rheohaemapheresis treatment using the predetermined scheme, with at least a 5-year follow-up, were included for evaluation. The group consisted of 28 males and 38 females. Average age was 75.2±6.6 years.
The patients were divided into 2 groups. The first group consisted of patients who were clinically successfully treated, and the second group included patients with therapeutic failure. Out of 66 patients, 52 were evaluated as successfully treated, 14 patients as treatment failure. Patients whose disease became stable or improved (visual acuity, morphological ocular findings) were considered as being successfully treated. (Note: the group of successfully treated patients is numerically larger, as it includes patients who were found to have improved, as well as those with a stable disease. Generally, long-term stabilisation is considered as successful therapy in the case of AMD). The most important criterion, especially from the patient’s point of view, is visual acuity: this was evaluated as stabilisation if the visual acuity was within±10 letters of the original value on a specified date (i.e. change of maximum of 2 lines of the ETDRS optotypes). Improvement of visual acuity by 11 or more letters was evaluated as an improvement; deterioration by 11 or more letters was evaluated as a worsening. Stabilisation of the morphological finding was evaluated as a change in the original area of pathological changes (drusenoid pigment epithelium detachment, area of soft drusen, area of RPE-atrophy) by±25%. A decrease of more than 25% in the pathological changes was considered as an improvement; analogical increase by more than 25% from the baseline was considered as a worsening. The effect of the therapy was evaluated by an experienced ophthalmologist.
All patients signed informed consents and the study followed the guidelines of the Helsinki Declaration. Study was also reviewed and approved by University Hospital Hradec Kralove Ethics Committee (approval number 201607 S03P).
Results
At first, rheolobically important factors were tested and the usual routine statistical tests were used. Rheologically significant factors seemed to be promising factors for proof of our hypothesis: modulation of blood rheology is a theoretical basis for the treatment effect of rheohaemapheresis in AMD [24]. Therefore the levels of the “rheologically significant” parameters were compared with the clinical outcome at the end of the long-term follow-up.
Prognosis prediction using rheologically significant biomarkers
The results of the following examinations were used for comparison:
1) Rheologically effective parameters
Spectrum of rheologically effective high-molecular proteins according to Klingel et al. [13]: Viscosity of whole blood and plasma. Spectrum of lipoproteins - total cholesterol, LDL-cholesterol, lipoprotein(a), apolipoprotein B. Fibrinogen, α2-macroglobulin. Immunoglobulin IgM.
2) Special clinical examinations used for evaluation of the therapy
Anatomical changes were evaluated every 6 months: the area of soft drusen, the area of retinal pigment epithelium detachment, the area of RPE atrophy in a colour photo using the VISUPAC program (fundus camera FF450 + IR, Zeiss, Germany); the presence of ellipsoid layer defects in the transfoveolar scan by optical coherence tomography (Cirrus, Zeiss, Germany). We also reviewed changes in the retinal functional status of patients after the rheohaemapheresis treatment: the best corrected visual acuity on ETDRS boards and electrophysiological examinations of retinal neuron function: electroretinography (ERG), ERG and multifocal ERG (Electrophysiological System+mf ERG; Roland Consult, Germany).
Evaluation of therapy success must be based on a combination of all the special examinations stated above. However, the most important criteria (from the patient’s point of view) is visual acuity. Specific details were not part of this study.
We compared the levels of rheologically active factors in the group of clinically successfully treated patients (52 patients) versus the unsuccessful patients (14 patients) (see Table 1). There was no statistically significant difference in age (p = 0.349) or gender (p = 0.698) between the two groups. We performed this evaluation, using paired samples taken from the patients at the beginning of a series of rheohaemapheresis. One sample was taken before and one after the rheohaemapheresis. Lipoprotein(a) was evaluated only during examinations performed before the laboratory limits in our laboratory changed (September 2014); a smaller number of samples was also used for the examination of immunoglobulin M.
Rheologically effective factors before and after rheohaemapheresis in successful and unsuccessful therapy
Rheologically effective factors before and after rheohaemapheresis in successful and unsuccessful therapy
Legend: N = number of examined samples; IQR = interquartile range; Chol = total cholesterol; LDL = LDL-cholesterol; Lp(a) = lipoprotein(a); ApoB = apolipoprotein B; IgM = immunoglobulin M; Fbg = fibrinogen; Visc.P = plasma viscosity, Visc.K = whole blood viscosity; M-W. test = Mann-Whitney test.
The results show that the levels of rheologically significant factors evaluated before and after the treatment were not significantly different between the groups of clinically successfully treated patients and those with treatment failure. The prognosis therefore cannot be determined by using the baseline levels of individual rheologically important factors. See Table 1.
We also took and compared samples at the end of the whole treatment cycle with equivalent results (data not presented).
Other individual laboratory indicators were analysed, using classic statistical methods (t-tests, ANOVA, Pearson correlation analysis). We carried out the following: parameters of blood count, basic coagulation examinations (aPTT, INR), basic biochemical examinations (blood minerals, blood proteins, creatinine, glycaemia, liver enzymes, uric acid). There were no significant differences between the baseline and outcome results for the two groups of patients (successfully/unsuccessfully treated).
Evaluation using the method of discriminant analysis
We chose multivariate statistical analysis, using discriminant analysis for further data analysis. We used Systat 13 software (Systat, Chicago, IL, USA) for analysis of the linear and quadratic models (using the automated and interactive step-wise approach).
Only those patients for whom the values of all the factors in the calculation were available were included in the calculation of the classification function. Selection of the spectrum of anticipated effective factors: we selected a spectrum of rheologically active high-molecular proteins according to Klingel et al. [13], i.e. total cholesterol, LDL-cholesterol, apolipoprotein B, IgM, 2-macroglobulin, fibrinogen, whole blood and plasma viscosity. Other factors, called “secondary factors”, were also selected –indicators which are readily available and commonly used: albumin, total protein, haemoglobin, leukocytes, thrombocytes, creatinine, glycaemia (other factors could be included in the evaluation in future research).
The system determined the coefficients of the two classification functions for our model (one for successful and the other for unsuccessful treatment), gradually eliminating the insignificant indicators. The following indicators remained for further evaluation: glycaemia, creatinine, total cholesterol, LDL-cholesterol, lipoprotein(a), and whole blood and plasma viscosity. All patients were classified using this method. The program then performed a final evaluation and determined the percentage correctness of the prediction of successful treatment. In this case, the prediction was correct in 79% of patients with unsuccessful treatment and in 60% of patients with successful treatment. The overall prediction correctness was 64%. See Table 2 - upper part. We also used the “Jackknife” method. However, this provided less optimistic results (57% and 54% of predictions were correct). See Table 2 - lower part.
Classification matrix (cases in row categories classified into columns)
Classification matrix (cases in row categories classified into columns)
Legend: see text.
The results were more accurate when the quadratic model was used. In this case, the prediction was correct in 100% of unsuccessfully treated patients and in 75% of successfully treated patients, 80% for all patients overall (66 patients were evaluated in this way). For the results of the final evaluation of the program, see Table 3.
Classification matrix (cases in row categories classified into columns) –quadratic model
Legend: see text.
The program for the prediction of prognosis, using the model described in Table 2 as well as the quadratic model –see the classification matrix in Table 3 –is currently being run in a trial version at https://www.vejrazka.name/apps/med/prognoza/, but there is no guarantee that it will be available at any particular time in the future.
An important goal of modern medicine is to find readily available bioindicators relevant for disease development wherever possible, as well as to develop early detection of impending health problems and subsequently to manage any therapy according to the principles of individualised medicine. This effort tends to be successful in cases where the origin and pathophysiology of the diseases are at least partially established. For example, a high level of LDL-cholesterol is a risk factor associated with the development of atherosclerosis; high uric acid levels increase the risk of gout symptoms, etc. Laboratory results can be used to predict, prevent or even control treatment.
In other cases, there are no such options [25]. This is the case for AMD: its pathophysiology is not clear. The disease often progresses and causes practical blindness. In the opinion of ophthalmologist, Professor P. Rozsíval, the burden of conveying information about an AMD diagnosis to a patient is similar to providing them with information about a malignant disease diagnosis [26].
In the case of AMD, we used a number of biochemical, haematological and other bioindicators of interest (see above) to discover the nature of their association with AMD during the course of its development. Using individual laboratory indicators to evaluate the prognosis of AMD in a univariate analysis appeared to be inadequate. However, experience from years of research gave us the impression that there were more complex procedures that could be more successful. Our hypothesis is stated above and its testing confirms this. The use of discriminant analysis was also driven by the fact that it has been used successfully in various other fields of human activity, as well as in medicine e.g. in the diagnosis or assessment of risk groups of patients in other situations [27–30]. Discriminant analysis is promising in the case of AMD, especially when the patient is at risk of AMD progression (prediction of failure was correct in up to 100% of cases - see Table 3), which allows for early and more intensive monitoring and treatment of these patients (for example, using “booster therapy”, i.e. using additional individual procedures after the completion of the basic cycle of 8 rheohaemapheresis).
In order to evaluate the success of the therapy, less important factors were eliminated during the discriminant analysis, so that the group of critical biomarkers was gradually reduced. Finally, the most useful predictive factors were those generally significant for the assessment of basic metabolic functions –glycaemia, creatinine, determining factors of lipoprotein metabolism (total cholesterol and LDL-cholesterol, lipoprotein(a)), as well as rheologically important factors (whole blood and plasma viscosity). It is interesting to note that, while the causes of AMD development are still unclear and under discussion, one of the theories that has recently been raised is lipoprotein metabolism disorder. If that is indeed crucial for the development of AMD, then it is consistent with our finding that the level of basic indicators of possible lipoprotein metabolism disorders (total cholesterol, LDL cholesterol, and lipoprotein (a)) is significant for predicting the success of using discriminant analysis. It was also interesting to find that, when attempting a prediction using a single indicator, the differences before the treatment and after the long-term follow-up were mostly clearly non-significant, but total cholesterol and lipoprotein(a) (post-treatment measurement) were close to significant levels - see Table 1.

Distribution of the LDL-Cholesterol and Lipoprotein values (A) –Scatter plot matrix. Legend: LDL1 = LDL-cholesterol before rheohaemapheresis; LDL2 = LDL-cholesterol after rheohaemapheresis; HDL1 = HDL-cholesterol before rheohaemapheresis; HDL2 = HDL-cholesterol after rheohaemapheresis.
With regard to the theory of a causal relationship between lipoprotein metabolism disorders and the pathogenesis of AMD, the distribution of lipoprotein(a) and LDL-cholesterol values in one part of the scatterplot matrix is also interesting. The values of lipoprotein(a) in unsuccessfully treated patients are distributed almost in a straight line, while in successfully treated patients they are much more dispersed. It might be possible that lipoprotein(a) and LDL-cholesterol levels appear to be most suitable for the evaluation of the prognosis in the discriminant analysis program, and the resulting success of the prediction is better for unsuccessfully treated patients. See Graph 1.
The results of the prediction of prognosis using the stated experimental model are encouraging. They show some optimistic tendencies in the prediction of prognoses. However, the number of patients in our study is still insufficient to draw convincing conclusions. The compilation of this model, however, allows the possibility to continue relatively easily during further testing –by gradually collecting further results obtained during ongoing research activities and recruitment of further patients. After inclusion of the results in the created matrix (see above - in a trial version on https://www.vejrazka.name/apps/med/prognoza/), the computer automatically calculates the probable prognosis of the patient –the probability of successful or unsuccessful therapy is predicted. It would then be possible to choose a more intensive procedure at the beginning of treatment, based on the result. The laboratory values that are used in our model are relatively easily available. Once the patient is recruited to the research protocol and undergoes the first rheohaemapheresis, the laboratory results in question are available. It will be possible to re-evaluate the model more accurately and to specify its practical value when data from the necessary number of patients are available.
Further research directions
To broaden the focus of our research, we have also investigated the dynamics of plasma circulating biomarkers (microRNAs) during the follow-up of AMD patients. MicroRNAs are small RNAs (18–22nt) that play an important role in the regulation of gene expression. We found significant changes in miRNAs levels in response to rheohaemapheresis treatment in our research cohort of 9 patients (Dlouhá et al, unpublished data). It is possible that the differences in occurrences of certain types of miRNAs are another suitable marker for assessing the long-term prognosis, as is the case of some other diseases. This is the subject of our ongoing research.
Conclusion
Although using univariate statistical methods did not prove the ability to predict patients’ prognosis in the treatment of dry AMD by rheohaemapheresis, using discriminant analysis was promising and showed the possibility of predicting the prognosis when using a group of selected indicators that are commonly available at the start of treatment. The suitability of the selected methodology and its accurate significance in the clinical setting should be verified in detail, using a larger group of patients.
Conflict of interest
The authors declare that they have no conflict of interest.
Footnotes
Acknowledgment
The study was supported by the grant of the Czech Ministry of Health, AZV 1729241A.