
Abstract
BACKGROUND:
Red blood cell (RBC) aggregation plays an important role in the physiological processes of the microcirculation. The complete mechanism of aggregation is still unclear, and it is influenced by several cellular and plasmatic factors. One of these factors is the hematocrit (Hct).
OBJECTIVE:
We hypothesized that the relation of RBC aggregation and Hct differs between species.
METHODS:
From anticoagulated blood samples of healthy volunteers, rats, dogs, and pigs, 20, 40, and 60 %Hct RBC, autologous plasma suspensions were prepared. Hematological parameters and RBC aggregation was determined by light-transmission and light-reflection method.
RESULTS:
Suspensions at 20%and 60%Hct expressed lower RBC aggregation than of 40%Hct suspensions, showing inter-species differences. By curve fitting the Hct at the highest aggregation value differed in species (human: 45.25%- M 5 s, 40.86%- amp; rat: 44.44 %- M1 10 s, 39.37%- amp; dog: 42.48%- M 5 s, 44.29%- amp; pig: 47.63%- M 5 s, 52.8%- amp).
CONCLUSION:
RBC aggregation - hematocrit relation shows inter-species differences. Human blood was found to be the most sensitive for hematocrit changes. The more obvious differences could be detected by M 5 s by light-transmission method and amplitude parameter using light-reflection method.
Introduction
Red blood cell aggregation plays an important role in physiological and pathophysiological processes in the microcirculation. However, the process of aggregation formation has not been fully elucidated yet. It is known that enhanced aggregation increases the whole blood viscosity [1–3] and in vivo flow resistance and may cause perfusion problems, therefore it has significant clinical relevance [4–6]. Changes in red blood cell aggregation may be indicative of various metabolic diseases, such as diabetes mellitus, obesity, hyperlipoproteinemia, or cardiovascular disorders [4–8]. Increased aggregation may occur in sepsis, in tumors, or certain hematological disorders, such as for example β-thalassemia [5–9]. Different pathological conditions may significantly increase the degree of aggregation, however, incre-ased aggregation may also occur on the arterial side, further deteriorating the microcirculation [10].
Among the hemorheological parameters, the degree of aggregation shows the greatest inter-species diversity [11–14]. Previous studies have determined that hematocrit significantly affects aggregation, but this relationship is not linear [15–17]. Deng et al. [15] determined a “peak” point in the aggregation indices of human blood samples with different hematocrit (Hct) values, in the range of 40–42%Hct [15]. However, no detailed data were found in the literature for other species. We hypothesized that the red blood cell aggregation –hematocrit relation differ in human, rat, dog and pig.
Several methods are available for measuring red blood cell aggregation, such as various microscopic techniques, indirectly the erythrocyte sedimentation rate, ultrasonic methods, and light-transmittance and light-reflectance methods [4, 18–20]. It is also supposed that the sensitivity for detecting red blood cell aggregation –hematocrit relation also differ.
Materials and methods
Volunteer participants, experimental animals and sampling protocol
From seven healthy men volunteers (average age: 29 years; Clinical Ethical Committee approval nr.: DE-RKEB 3189-2010) blood samples were taken from the antecubital vein using 21 G needle into BD Vacutainer® tubes (1.8 mg/ml K3-EDTA; Becton, Dickinson and Company, USA). Informed consent was obtained from all individual participants included in the study.
Blood samples were also drawn from 6 Wistar male rats (bodyweight: 353±80 g; anesthesia: 60 mg/kg thiopental, i.p.; sampling site: caudal caval vein), 6 male beagle dogs (bodyweight: 18.05±2.05 kg; anesthesia: 10 mg/kg ketamine + 1 mg/kg xylazine + 0.25 mg/kg diazepam, i.m.; sampling site: cephalic vein) and 7 Hungahib-39 female pigs (bodyweight: 15.26±1.02 kg; anesthesia: 15 mg/kg ketamine + 1 mg/kg xylazine, i.m.; sampling site: medial saphenous vein) into tubes with K3-EDTA (1.8 mg/ml). Comparative studies on blood samples from experimental animals were carried out according to the EU regulation (EU Directive 63/2010) and the Hungarian laws (The Hungarian Animal Protection Act, Law XVIII/1998) about animal experimentations, and with ethical approvals registered by the University of Debrecen Committee of Animal Welfare (permission registration Nr.: 13/2014/UDCAW, 7/2014/UDCAW, and 24/2016/UDCAW).
Sample preparation
Blood samples were centrifuged (3000 rpm, 10 min), the plasma was put aside, and the ‘buffy coat’ was removed. After it we diluted the RBC suspension with phosphate buffered saline (PBS, 1:1) and centrifuged it again (3000 rpm, 10 min), then we removed the supernatant, and repeated this washing step once more. We determined the hematocrit value of the RBC suspension, and accordingly we prepared the 20, 40, 60%RBC-autologous plasma suspensions.
Laboratory measurements
The hematological parameters were determined with Sysmex F-800 or Sysmex K-4500 automated hematology analyzers (TOA Medical Electronics Co., Ltd., Japan).
Red blood cell aggregation was tested with methods based on light-transmission (Myrenne MA-1 aggregometer, Myrenne GmbH, Germany) and light-reflection (LoRRca MaxSis Osmoscan ektacytometer, Mechatronics BV, The Netherlands) [4, 20].
By the Myrenne MA-1, using a small sample size (20μl/measurement), four aggregation parameters were determined: aggregation M index values under stasis (M 5 s, M 10 s) and M1 values at 3 s–1 shear rate (M1 5 s, M1 10 s). The device is not temperature-controlled. The measurements were carried at room temperature (20–25°C). Four parallel measurements were performed to determine each index parameter, and we used their average [4, 21].
The LoRRca MaxSis Osmoscan ektacytometer provides information not only about the rapid phase of aggregation (rouleaux formation, 5–15 s), but also about the entire aggregation process (100–120 s) [9, 20]. In this device the temperature is controlled. We performed our measurements at 37°C. The instrument measures the intensity of the reflected light in a Couette-system, in which 750–1000μl sample was filled. This device determines several parameters, such as the amplitude (Amp [au], the total extent of aggregation, as the whole light intensity change during the aggregation process), the syllectogram half-time (aggregation half time, t1/2 [s], describes the kinetics of the aggregation process, as half of the total amplitude), and aggregation index (AI [%], ratio of the area above the intensity curve related to the first 10 seconds over the sum of the areas above and below the curve) [9, 20].
Statistical analysis
For statistical analysis Student’s t-test, Mann-Whitney rank sum test and ANOVA test were used. Data are presented as means±S.D., and as box and whisker, which shows the median, 25%and 75%percentile, and the error bars represent the maximum and minimum value. A p < 0.05 was considered a statistically significant difference.
Results
Hematological parameters
Examining the hematological results, we observed that the dilution protocol was successful: the target Hct concentration was achieved for each suspension. The size and the density of the red blood cells did not change significantly, except in the pig blood at 40%, where the mean corpuscular hemoglobin (MCH), and at 60%where the mean corpuscular hemoglobin concentration (MCHC) changed (Table 1).
Selected hematological parameters of the species in whole blood sample at native hematocrit and in red blood cell–plasma suspensions of various hematocrit (20%, 40%, 60%)
Selected hematological parameters of the species in whole blood sample at native hematocrit and in red blood cell–plasma suspensions of various hematocrit (20%, 40%, 60%)
Mean±SD, †: vs. base, ‡: vs. human base, §: vs. rat base, ¶: vs. dog base, p < 0.005. Hct: hematocrit; RBC: red blood cell count (here); Hgb: hemoglobin; MCV: mean corpuscular volume; MCH: mean corpuscular hemoglobin; MCHC: mean corpuscular hemoglobin concentration.
Light-transmission method
We focused on the aggregation index M 5 s parameter, because the differences were the most pronounced at this parameter. The aggregation index M 5 s parameter showed significant inter-species differences in the whole blood at native hematocrit (human vs. rat: p < 0.0001; human vs. pig: p < 0.0001; dog vs. rat: p = 0.005; dog vs. pig: p = 0.0164). The differences were also significant in the RBC-plasma suspensions at 20%Hct (human vs. pig: p = 0.0187), at 40%Hct (human vs. pig: p = 0.0006; human vs. rat: p < 0.0001; pig vs. rat: p = 0.0251; dog vs. rat: p < 0.0001) and at 60%Hct (human vs. rat: p < 0.0001; human vs. dog: p = 0.0002; rat vs. pig: p = 0.02) (Fig. 1).

M 5 s aggregation index parameter (Myrenne MA-1 aggregometer) in whole blood at native hematocrit, as base sample (A), and in red blood cell–plasma suspensions at 20%(B), 40%(C) and 60%(D) hematocrit. Median, 25%and 75%percentiles, and the error bars with maximum and minimum values.
When values were plotted in the function of hematocrit and a curve was fitted, a kind of “peak” became visible (Fig. 2). After derivation the equation of the fitted curve with the highest regression coefficient (R2∼1), the Hct values corresponding to the highest aggregation index could be determined. It was 45.25%for the human blood (equation: y = –0.0042x2 + 0.3628×–3.2151), 42.48%for the dog (equation: y = –0.0039x2 + 0.3314×–3.1907), and 47.63%for the pig (equation:y = –0.0022x2 + 0.2096×–2.125). For rat blood samples, we could observed this peak value only for the M1 10 s index parameter, which was 44.44%(equation: y = –0.0027x2 + 0.24×–1.6) (Fig. 2)

Aggregation index M 5 s of human (A), rat (B), dog (C) and pig (D) blood in the function of hematocrit. Arrows show the maximum point of the fitted curves at the highest regression coefficient, calculated by derivation.
Aggregation index (AI [%]) significantly differed in the species in native-Hct whole blood samples (human vs. dog: p = 0.351; pig vs. rat: p = 0.0207; pig vs. dog p < 0.0001), and RBC-plasma suspensions at 20%Hct (human vs. dog: p = 0.0006; rat vs. dog: p < 0.0001; dog vs. pig: p = 0.0274), at 40%Hct (hu-man vs. pig: p = 0.0039; human vs. rat: p < 0.0001; pig vs. rat: p = 0.0081; pig vs. dog; p = 0.0371; dog vs. rat: p < 0.0001), as well as in case of 60%Hct suspensions (human vs. pig: p = 0.0002; human vs. rat: p < 0.0001; dog vs. rat: p = 0.0032) (Fig. 3). Only in case of rat data we could calculate the Hct value for the aggregation maximum: 43.3%(equation: y = –0.0835x2 + 7.2315×–70.481). For the other spe-cies, the curves did not give a maximum point with this parameter.
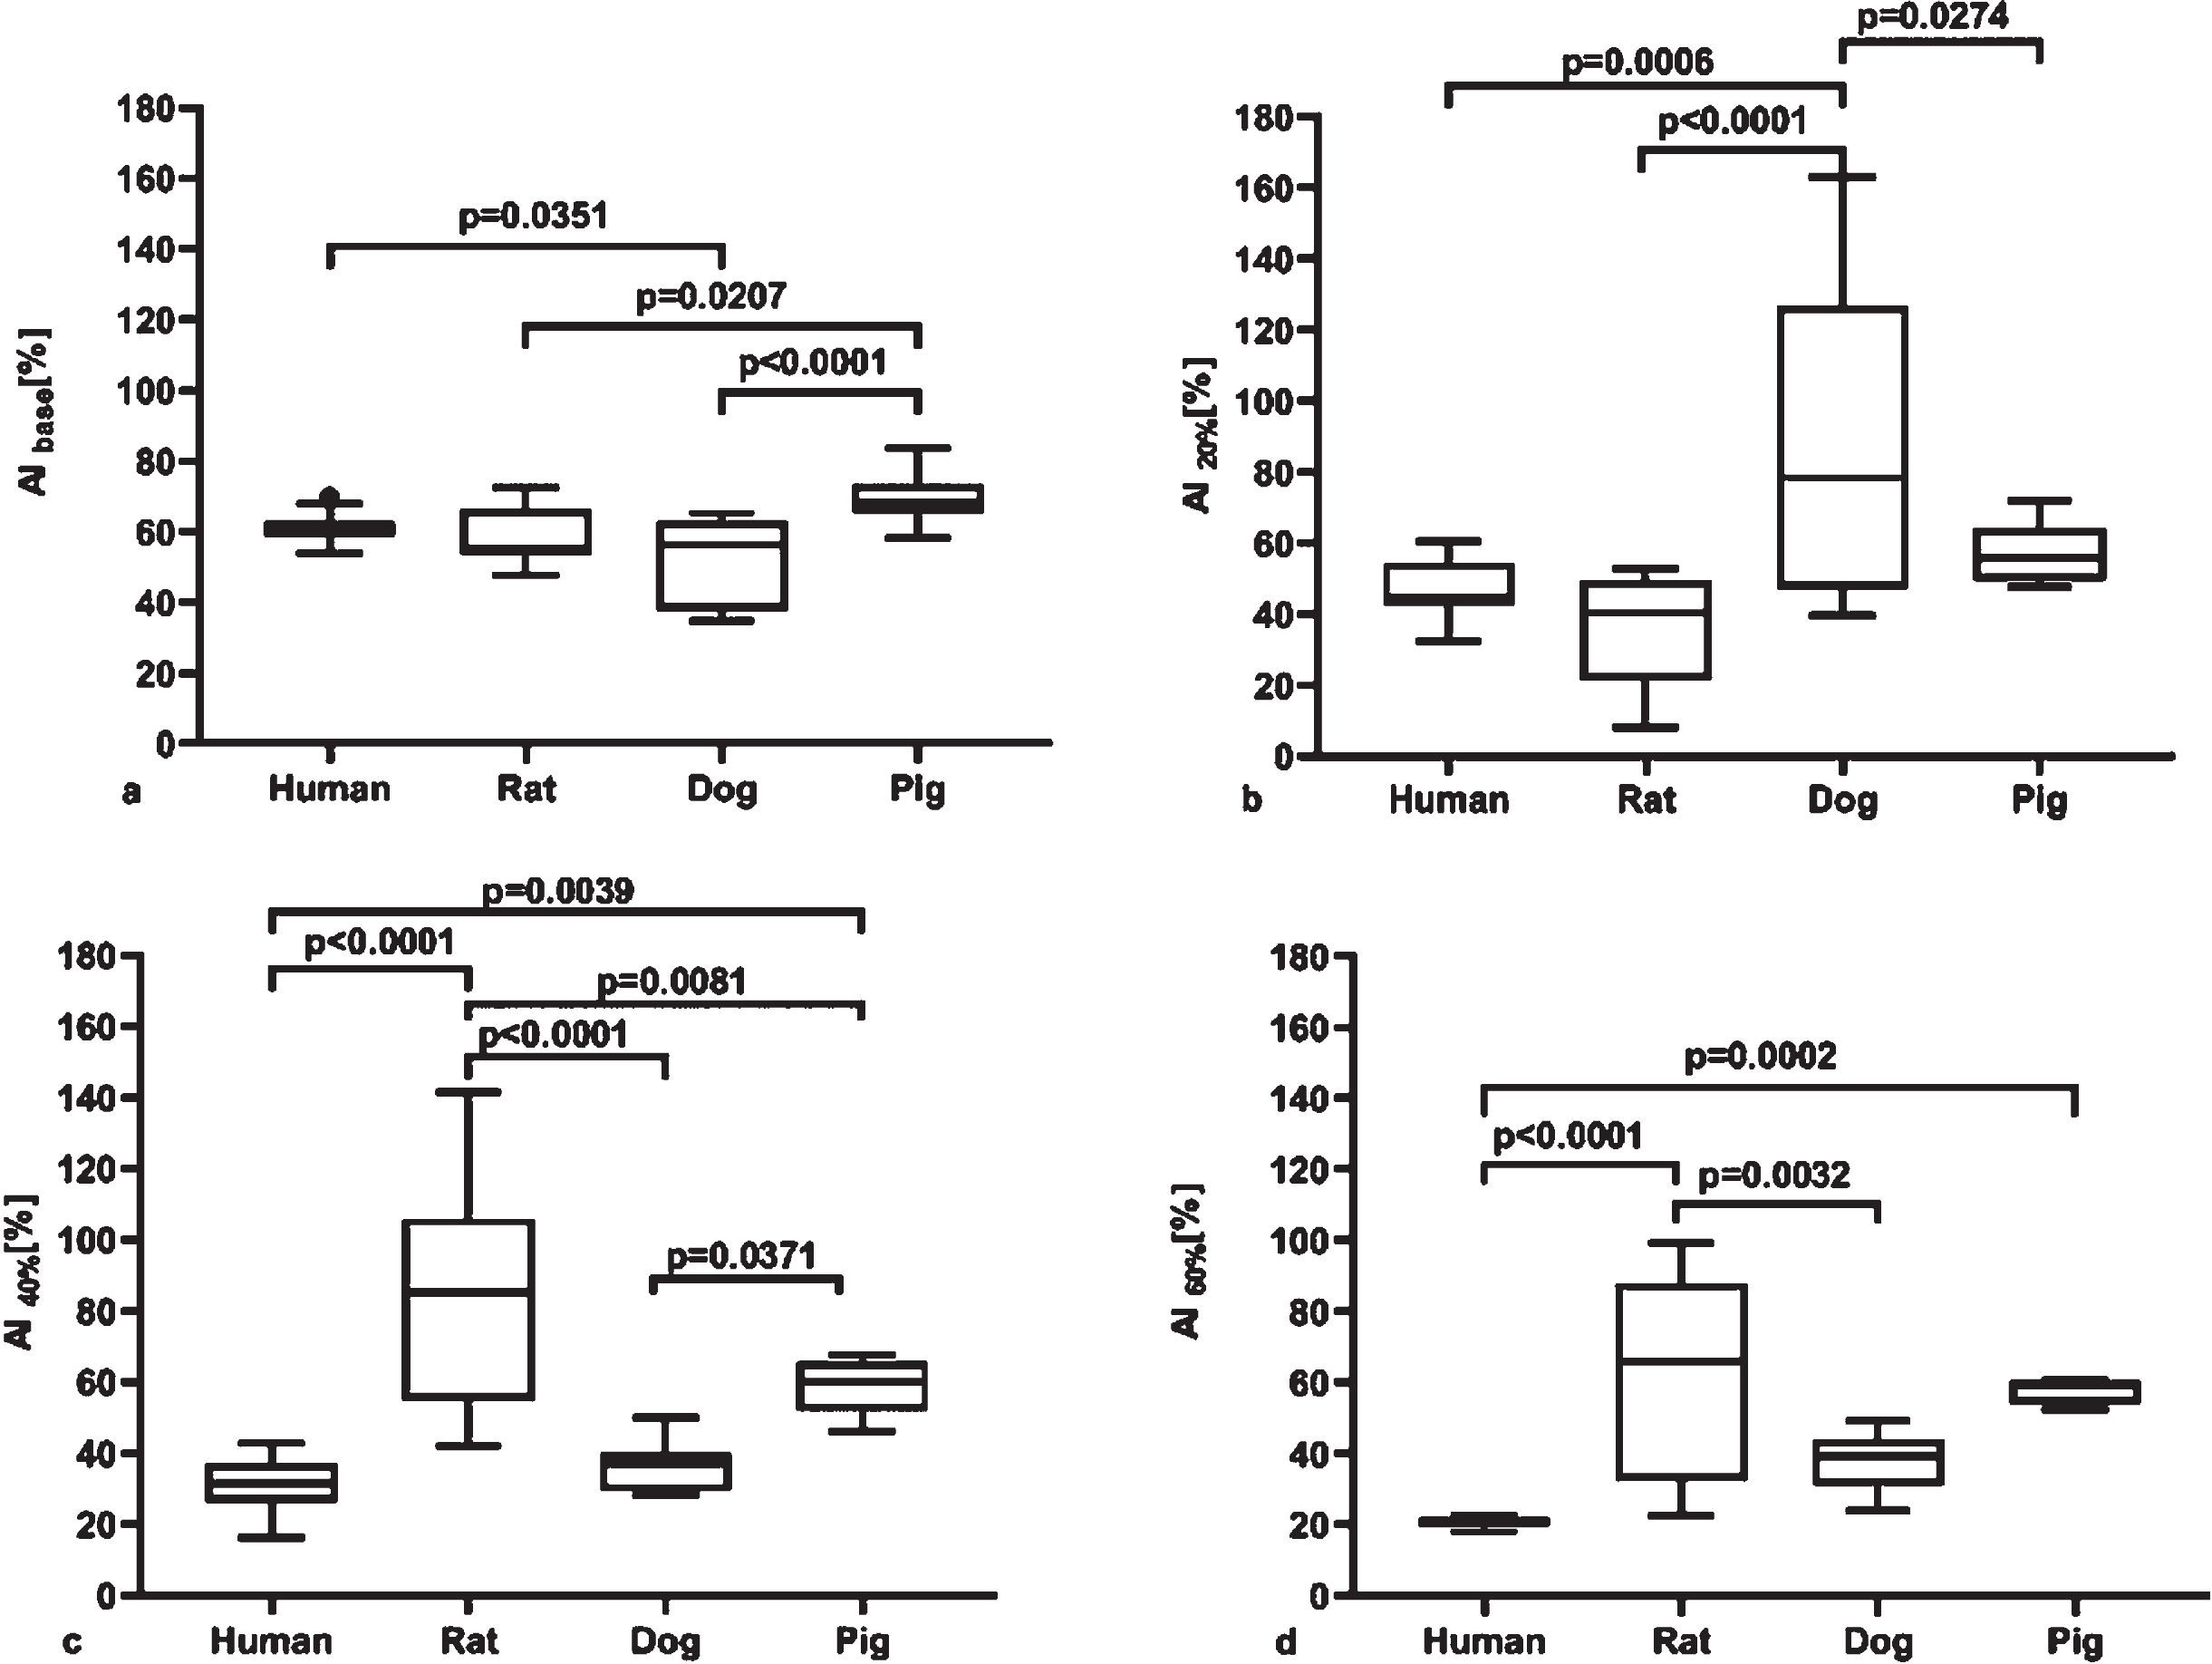
Aggregation index (AI, [%]) (LoRRca MaxSis Osmoscan ektacytometer) in whole blood at native hematocrit, as base sample (A), and in red blood cell–plasma suspensions at 20%(B), 40%(C) and 60%(D) hematocrit. Median, 25%and 75%percentiles, and the error bars with maximum and minimum values.
Amplitude (amp [au]) values of whole blood samples at native Hct showed significant inter-spe-cies differences (human vs. rat: p < 0.0001; human vs. dog: p < 0.0001; human vs. pig: p = 0.0096; dog vs. rat p < 0.0001; vs. pig p < 0.0001; rat vs. pig p = 0.0423). Values of rat, canine and porcine RBC suspensions at 20%Hct differed significantly from human samples (p < 0.0001, p = 0.0024 and p < 0.0001, respectively). In case of 40%Hct suspension, strong significant differences (p < 0.0001). The suspensions at 60%Hct significantly differed between human and dog (p < 0.0001), human vs. rat (p = 0.0101), rat vs. dog (p < 0.0001), and rat vs. pig (p = 0.0001) (Fig. 4). In case of total intensity change, a peak was calculated for each species: 40.86%for human (equation: y = –0.0287x2 + 2.2881×–23.641), 39.37%for rat (equation: y = –0.0027x2 + 0.2126×–0.0183), 44.29%for dog (equation: y = –0.0233x2 + 2.064×–25.884) and 52.8%for pig (y = –0.0056x2 + 0.5921×–4.9259) (Fig. 5).
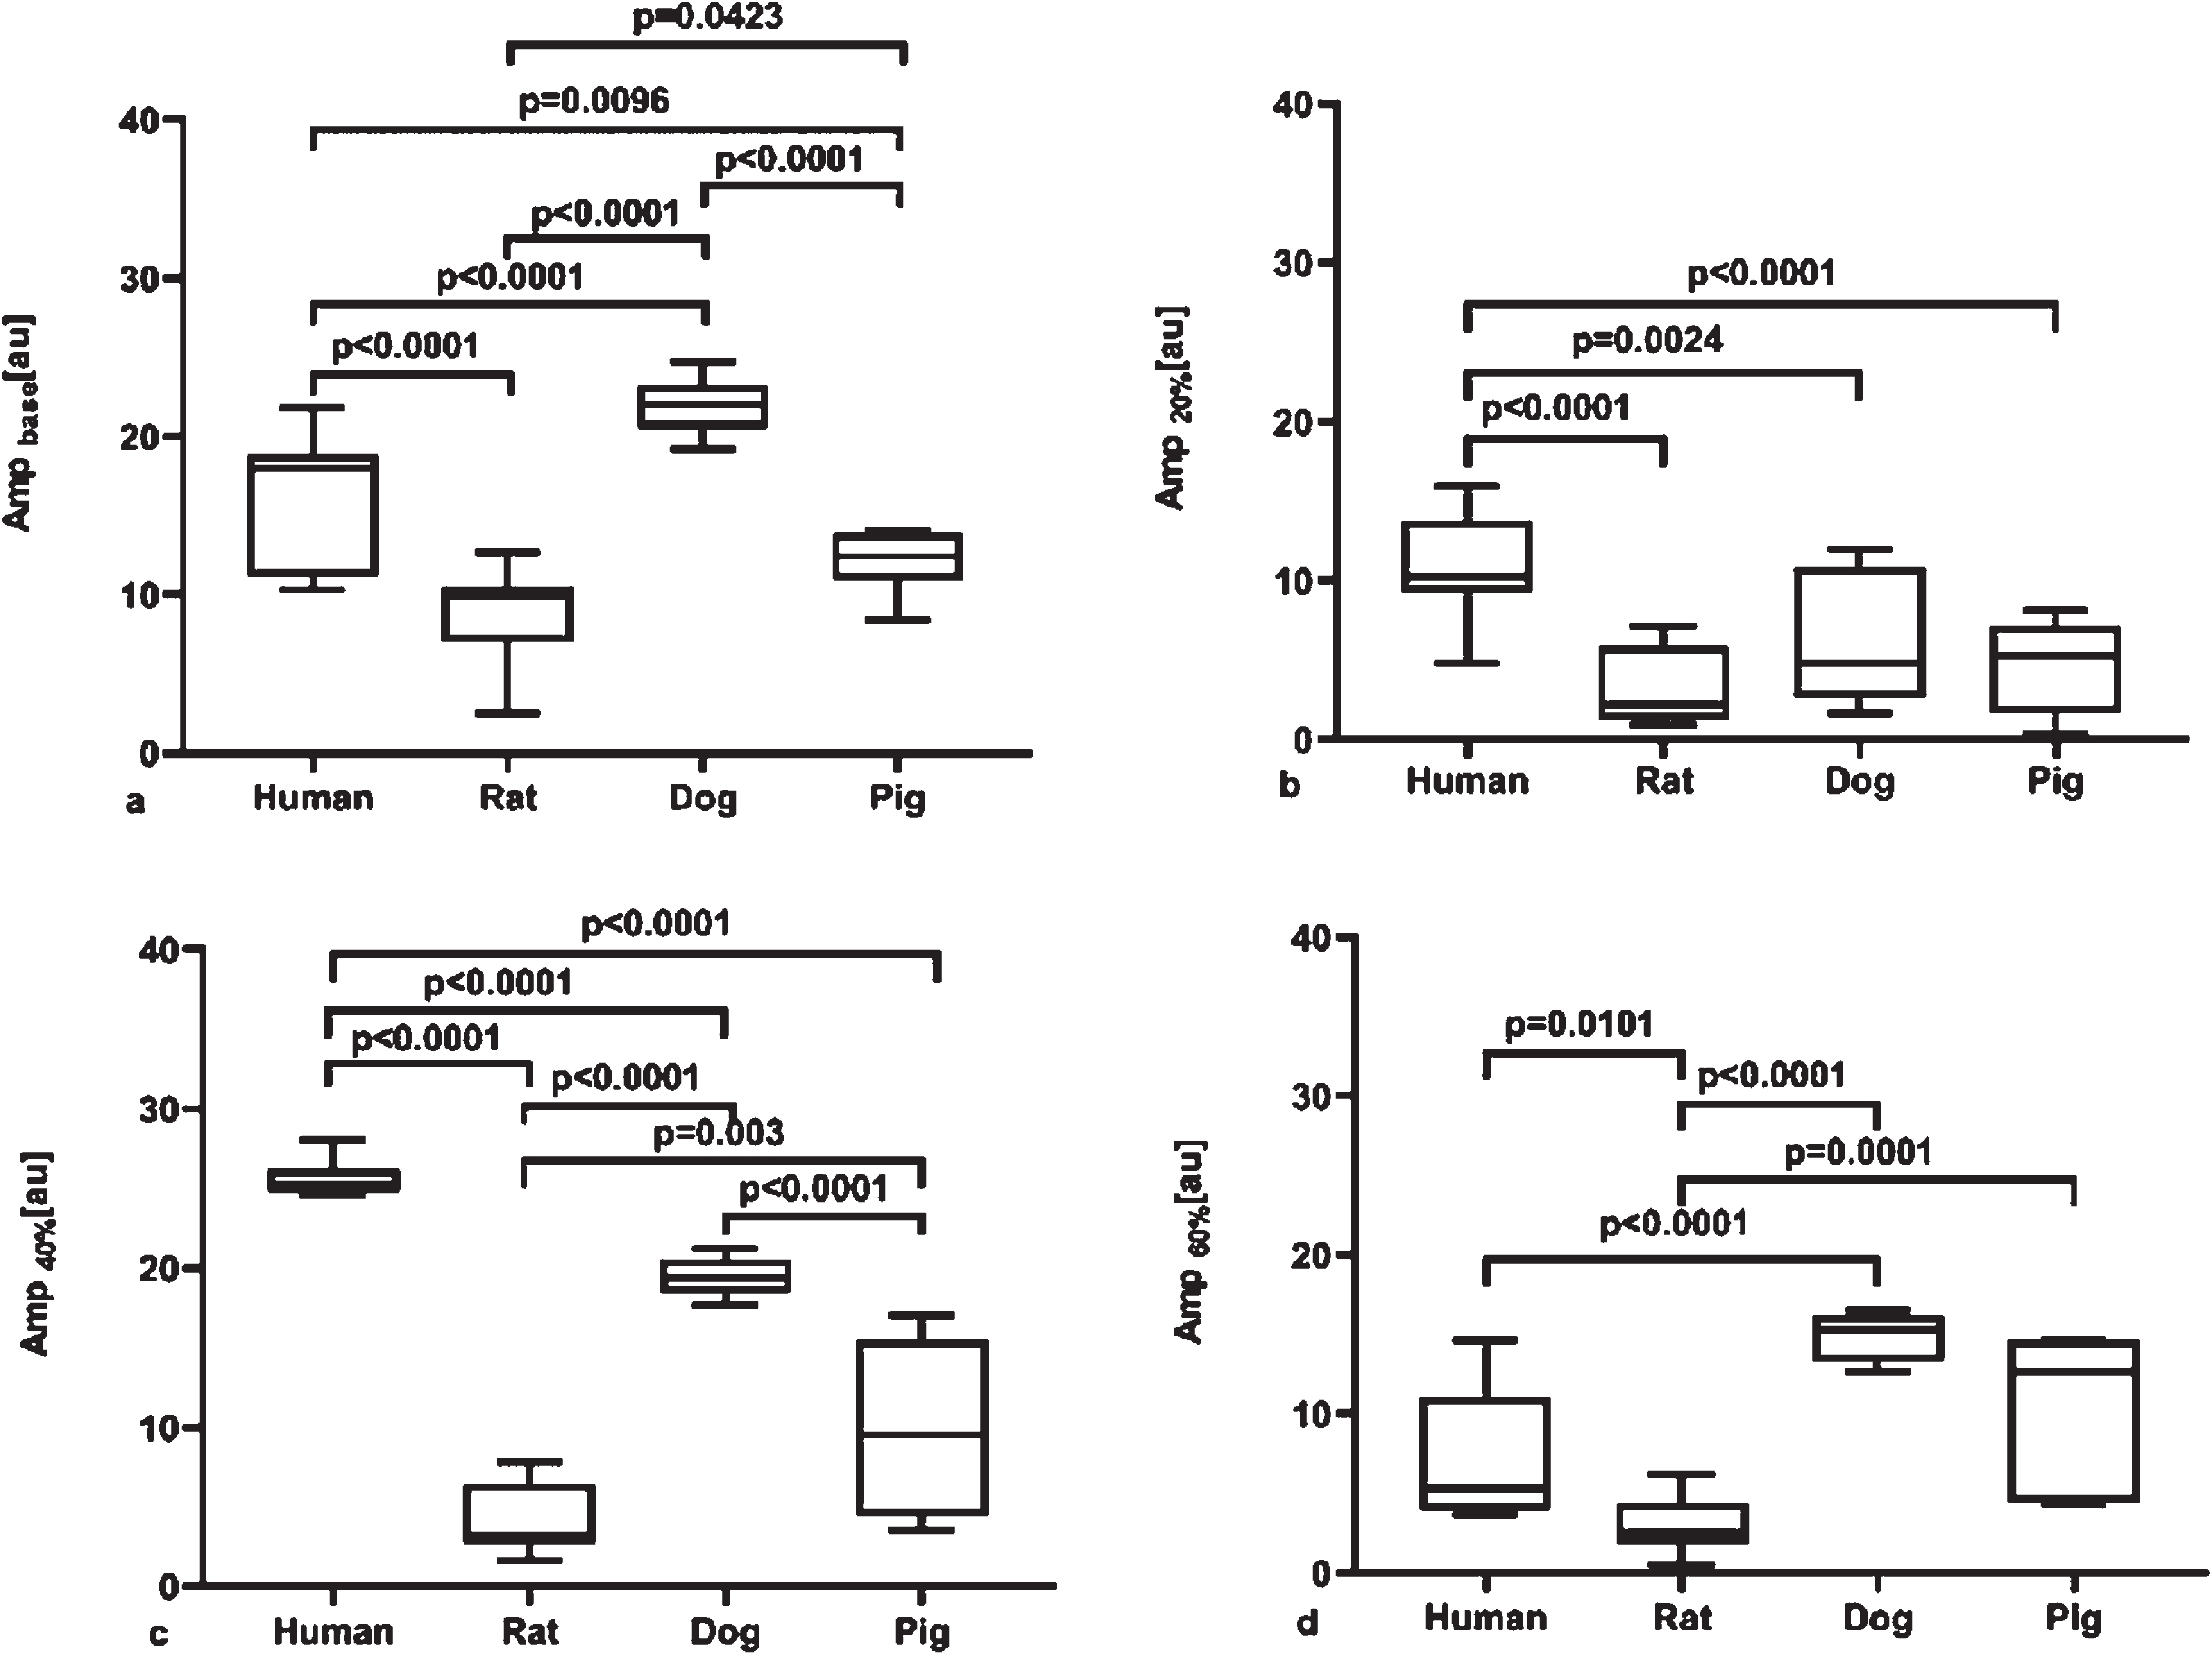
Amplitude (amp, [au]) (LoRRca MaxSis Osmoscan ektacytometer) in whole blood at native hematocrit, as base sample (A), and in red blood cell–plasma suspensions at 20%(B), 40%(C) and 60%(D) hematocrit. Median, 25%and 75%percentiles, and the error bars with maximum and minimum values.
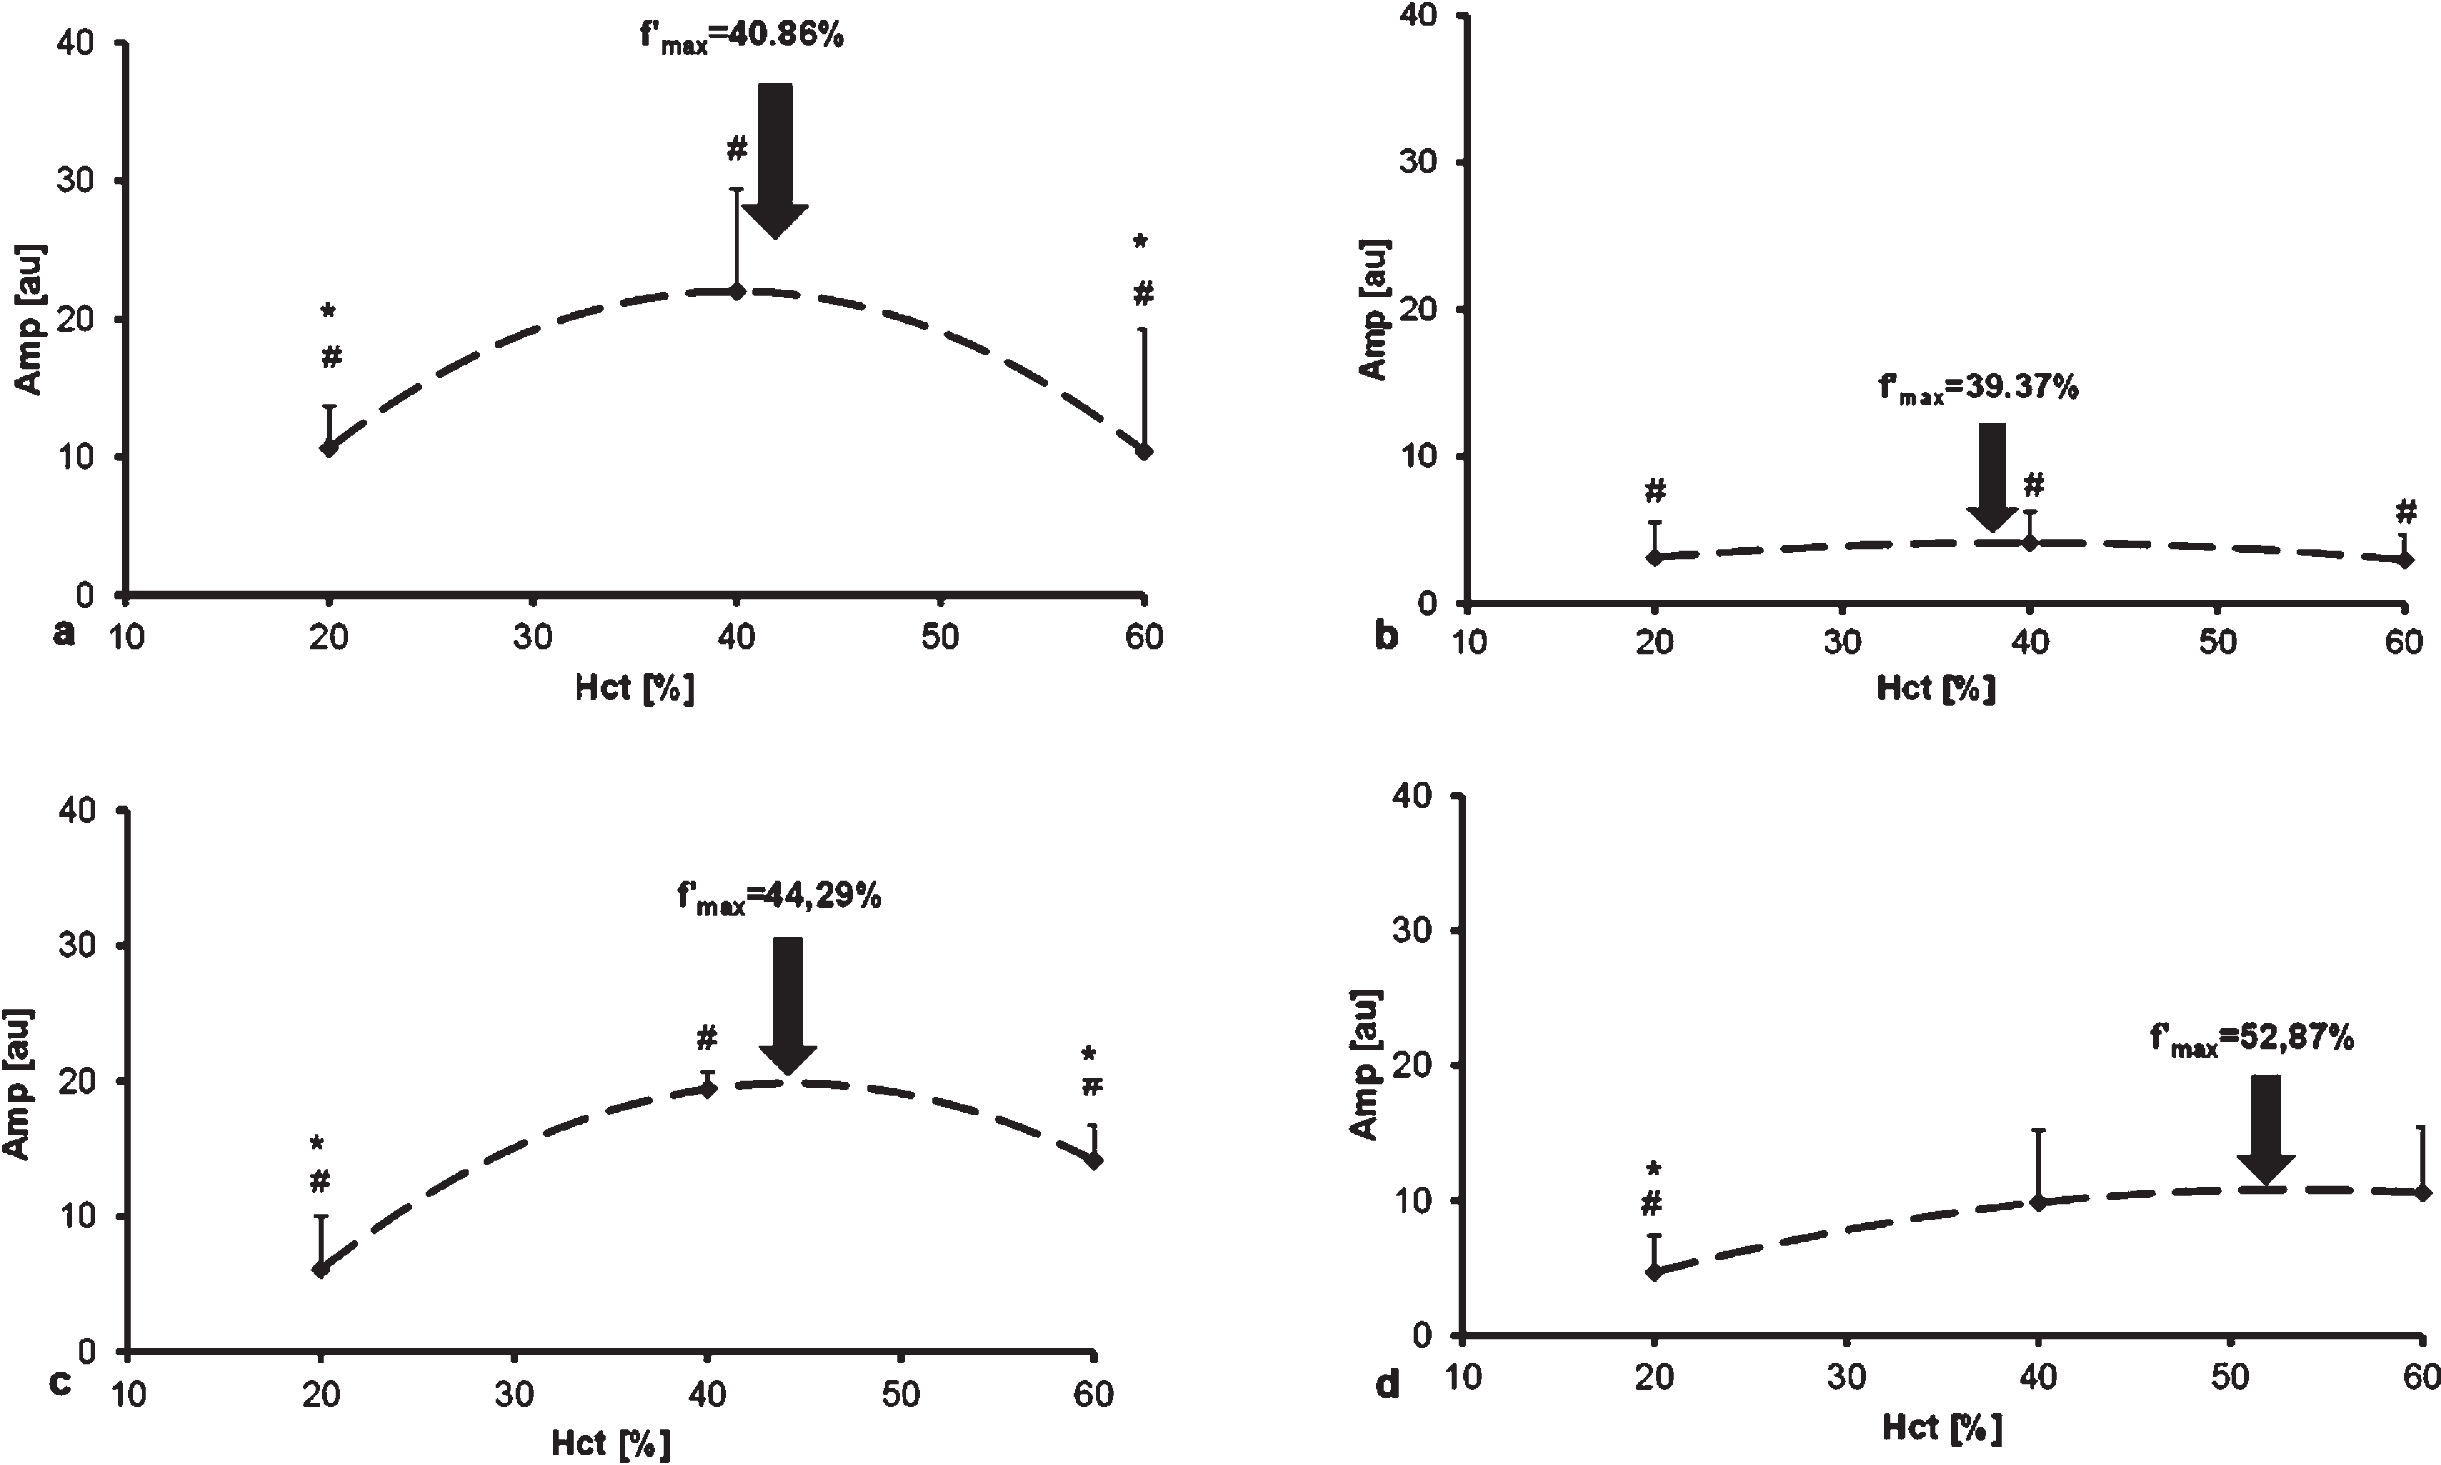
Amplitude (amp, [au]) values of human (A), rat (B), dog (C) and pig (D) blood in the function of hematocrit. Arrows show the maximum point of the fitted curves at the highest regression coefficient, calculated by derivation.
Syllectogram half-life (t1/2 [s]) of whole blood also expressed significant differences between human and the other investigated species (human vs. dog: p = 0.0025; dog vs. rat: p = 0.004; dog vs. pig: p < 0.0001). At 20%Hct, significant differences were found for rat vs. human (p = 0.035), rat vs. dog (p = 0.0002) and rat vs. pig (p = 0.0001), while at 40%Hct for human vs. pig (p < 0.0001), human vs. rat (p < 0.0001), rat vs. dog (p = 0.0015) and dog vs. pig (p = 0.0268). At 60%Hct the differences were significant for human vs. pig (p = 0.0001), human vs. dog (p < 0.0001), human vs. rat (p < 0.0001), rat vs. dog (p = 0.001) and dog vs. pig (p = 0.0275) (Fig. 6). In human, canine and porcine samples t1/2 increased with hematocrit. In canine and porcine data, maximum points of fitted curves could be identified: 54.21%for dogs (equation: y = –0.0051x2 + 0.5529×–6.5992) and 58.5%for pigs (equation: y = –0.0004x2 + 0.0468x + 1.43). We could calculate a minimum point in rat samples: 46.15%(equation: y = 0.0234x2 –2.1889x + 51.847).
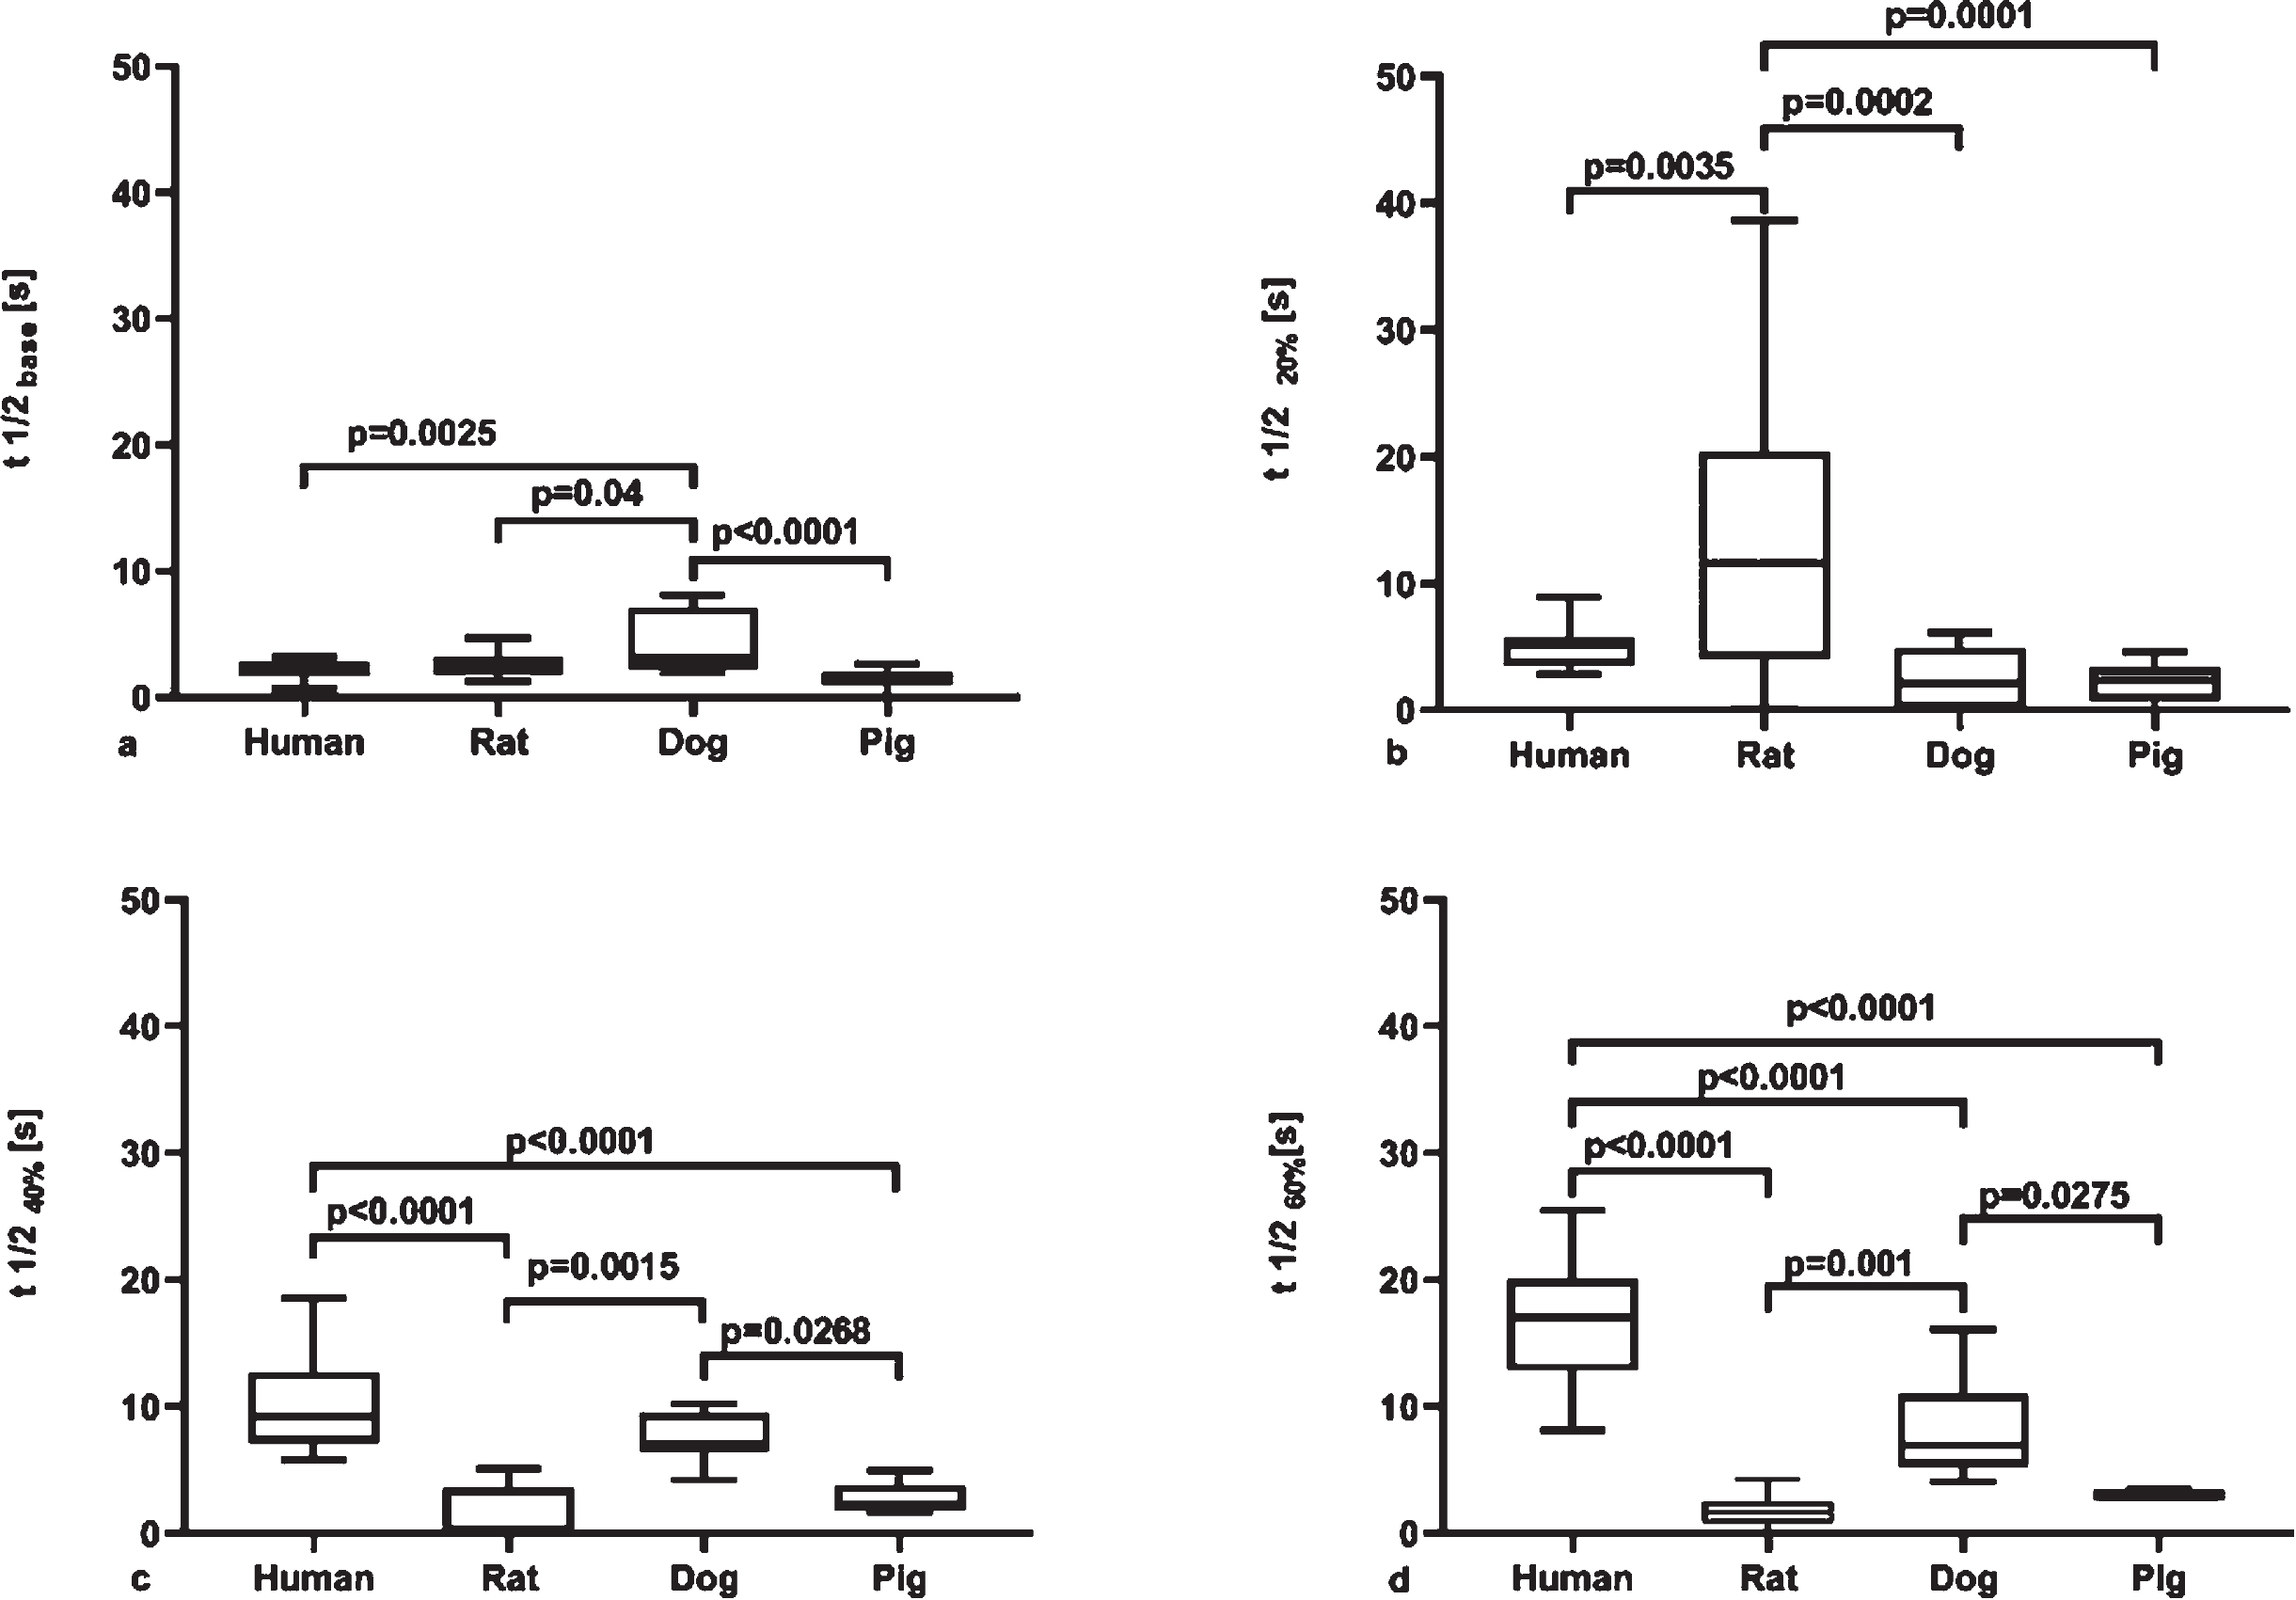
Syllectogram half-life (t1/2, [s]) (LoRRca MaxSis Osmoscan ektacytometer) in whole blood at native hematocrit, as base sample (A), and in red blood cell–plasma suspensions at 20%(B), 40%(C) and 60%(D) hematocrit. Median, 25%and 75%percentiles, and the error bars with maximum and minimum values.
The exact process and mechanism of red blood cell aggregation is still unclear, however, there are well-known plasmatic and cellular influencing factors [3, 22]. Plasma proteins, like fibri-nogen, immunoglobulins or transferrin are the major influencing factors. Fibrinogen is consi-dered the most important plasma protein in the induction of RBC aggregation. It is an acute phase protein, thus the level of fibrinogen is enhanced in inflammations or cardiovascular diseases [3, 23], which can explain the increase of aggregation in these processes. The aggregation is determined by promoting and opposing forces. Aggregating force, for example, the biconcave-discoid shape of the red blood cells. Disaggregating factors like the shear forces, the red blood cell’s surface charge, and the structure of the membrane, like the glycocalyx composition and the degree of rigidity [9, 22]. The cell shape, the size last but not least the cell count (hematocrit) also play a significant role [9, 24]. The relationship between red blood cell count and aggregation is not fully understood.
The degree of aggregation shows the greatest interspecies diversity among the hemorheological parameters [12, 13]. There are several factors behind this. These include differences in shape and size of erythrocytes of different species, characteristics of fibrinogen binding, hemodynamic and vascular geometry, nutrition, lifestyle, and glycocalyx composition of erythrocytes [9, 13]. There are differences in the normal fibrinogen level of the species (human: 150–300 mg/dL [9], CD rat: 128–153 mg/dL; Beagle dog: 177–229 mg/dL [25]; pig: 213–273 mg/dL [26]). These differences can also cause the diversity of the aggregability, whereas fibrinogen levels affect aggregation. Windberger et al. set “reference” ranges for Myrenne aggregation indices in the stasis of different animal species using samples with 40%Hct. This is 0.3–1.2 in rats; in dogs 2.7–4; in pigs from 2.2 to 4.6 [12]. For the 40%suspensions, the average of the aggregation index values obtained fell into these intervals in each case. In the literature, we did not find any reference ranges for human aggregation indices. Based on Windberger et al., we defined from our data a “normal” range (4.1–5.0) for humans [12].
Nutrition also plays a prominent role in hemorheology. In patients with hypercholesterolemia, shear stress at increased flow rates has been shown to negatively affect red blood cell deformability [27]. High cholesterol levels not only have a direct effect on the cardiovascular system, but can also increase whole blood viscosity as an indirect effect [27]. The viscosity has an exponential relation with the Hct value. The Hct/viscosity ratio differs between species. This ratio elevates with hematocrit, but after an “optimal” hematocrit value (which is the hematocrit value of the maximal oxygen transport capacity) there is a decrease. As a result of the increased whole blood viscosity, the Hct/viscosity ratio decreases, thereby reducing the oxygen carrying capacity of the blood. In native rat samples, it is higher than dog samples. This “optimal” value depends on the shear rate. At the most commonly used shear stress (90 s–1) the maximum of the Hct/viscosity ratio in rats is 36.5%Hct, in dogs is 39.7%[28].
Previous studies have determined that hematocrit significantly affects aggregation, but this relationship is not linear [15–17, 29–31]. In the M 5 s index parameter obtained with the Myrenne MA-1 aggregometer, in the examined 20%Hct samples we found a reduction in aggregation index for each species compared to the whole blood. In human, dog, and pig data, it was a kind of “peak” in the values followed by an aggregation-index decline. Deng et al. examining human blood this peak was found around 40–42%Hct [15], in our study, this calculated peak value or “optimal” Hct value for the M5s indices was in humans, dogs, and pigs close to 40%Hct. This trend was observed in rat samples only for the M1 10 s parameter. This suggests that the rat aggregation takes place between the first 5–10 seconds of the process.
The above measurements are also confirmed by LoRRca AI, as this parameter represents the change in light intensity of the first 10 seconds and only the result of rat blood showed the “peak” point (43.3%Hct). In the 20%Hct suspensions the dog samples were significantly higher, in 40–60%the rat and the human specimens differed significantly from the other species.
The reflection-based measurements of human, dog and pig specimens did not show the aforementioned peak point. For these, the aggregation indices of the 20%Hct suspensions were higher than the 40%Hct sample. In addition, there was a continuous increase in t1/2, the aggregation process slowed down with the increase in Hct. The highest increase was observed in humans. From this, it can be concluded that among the examined species the ability of human red blood cells to aggregate is the most sensitive to Hct change.
The optimal Hct values we have described are not the same as the optimal value of the Hct/viscosity ratio. There is a difference not only in meaning, as the optimum for the Hct/viscosity ratio is the Hct value where the viscosity peaks, while the described peak in our study indicates the peak of aggregation; but there are also differences in value. The aforementioned Hct values, of the maximum aggregation, are higher in both rats and dogs in every parameter than the optimal values for the Hct/viscosity ratio described in previous studies [28]. Enhanced aggregation increases the plasma skimming in the capillaries, which means that the number of red blood cells reduces in the lumen of the vessels [1, 16]. As a result, the blood supply to the tissue is reduced, thus decreased the oxygen transport to the tissues. This may be the reason why the Hct value for the maximum oxygen transport capacity is lower than the Hct value for the aggregation maximum. This suggests that adequate blood supply to tissues can only be ensured if red blood cell aggregation does not reach its maximum level. Excessive aggregation can worsen the oxygen supply.
It was previously found that the rats’ t1/2 value is five times lower than the pigs’ and ten times lower than dogs’ values [32]. In this study, native hematocrit t1/2 values of the dogs were also significantly higher than human, rat and pig results (dog > rat> pig> human). It is considered that in normal, native hematocrit, the aggregation of canine red blood cells is the slowest, and human blood cells’ is the fastest. The mean of the dogs’ native hematocrit values is significantly higher than the others’, and dog AI values are the lowest. This may be explained by the non-linear relationship of the Hct and aggregation, described by Deng et al. [15].
The acceleration of the aggregation process was observed in the medium Hct range in the rat samples. The syllectogram half time values were found to be decreased, as described by Deng et al. [15]. At the same time, the AI of the t1/2 minimum point was the highest, thus the significant part of the rat aggregation takes place in the first 10 seconds of the process. Specificities of the different measurement methods (light-transmission–light-reflection methods, static–kinetic parameters) might explain the differences [4, 20].
Regarding the amplitude, Deng et al. found the highest values in the 40%Hct samples [15], in our study clearly shows that the greatest change in the light intensity is in the 40–50%Hct range, however, it varies by species. The lowest values were measured in rats, followed by pig, human and dog samples. It follows that the rat blood is the least aggregated, as shown in previous comparative studies [12, 33]. In the case of whole blood, the lowest Amp values are found in the rat [32], which was confirmed by our study.
The limitation of our study is the low case number and the methodological features (e.g., sample preparation, measurement methods, instrument specifications, power of analyses). However, these data might have an additive information value for better revealing inter-species hemorheological differences and the aggregation behavior of erythrocytes at varying hematocrit values.
Conclusions
Relation of red blood cell aggregation and hematocrit (absolute values, sensitivity for Hct change, maximum point of aggregation and Hct curves) show obvious inter-species differences. Human blood was found to be the most sensitive for hematocrit changes. However, significant reduction was observed in canine and porcine blood as well (Table 2). The more obvious differences could be detected by M 5 s by light-transmission method and amplitude parameter using light-reflection method.
Inter-species relation of aggregation index values in whole blood sample at native hematocrit and in red blood cell–plasma suspensions of various hematocrit (20%, 40%, 60%)
Based on the mean values. H: human; R: rat; D: dog; P: pig.
Footnotes
Acknowledgments
The authors are grateful to the technical staff of the Department of Operative Techniques and Surgical Research, Faculty of Medicine, University of Debrecen.
Ethical statement
The authors comply with the Ethical Guidelines for Publication in Clinical Hemorheology and Microcirculation as published on the IOS Press website and in Volume 63, 2016, pp. 1-2 of this journal.
Funding
The study was partially supported by the Bridging Fund of the Faculty of Medicine, University of Debrecen.