
Abstract
BACKGROUND:
The endothelial glycocalyx (EG) plays a vital role in the physiology and pathophysiology of human microcirculation. Having relevant EG damage model would be important tool for testing new interventions aiming at EG protection and recovery. We describe the first in vivo EG damage model in pig.
OBJECTIVE:
To investigate the course of animal EG damage induced by specific enzymes.
MATERIAL AND METHODS:
Four anesthetized piglets received enzymes: 1g hyaluronidase and 25 IU heparanase I intravenously. Blood and urine samples were collected at baseline and 20/40/60/80/100/120 min for detecting markers of endothelial and EG function. Sublingual microcirculation and EG thickness were assessed by Side-stream Dark Field (SDF) imaging and Perfused Boundary Region (PBR) respectively. EG of the mesentery artery was visualized in fluorescent microscopy.
RESULTS:
Biochemical marker of EG damage syndecan-1 showed temporary increase with return to baseline and was reflected by PBR values. Albumin levels suggested brief period of capillary leakage (decrease in the serum, increase in the urine) with a trend to normalization. Urine glycosaminoglycans peaked at 120 minutes. Microcirculatory perfusion parameter showed significant alteration. Diffusion parameters were altered with no statistical significance.
CONCLUSION:
EG damage induced by specific enzymes was reflected by temporary changes of biochemical makers together with alteration of microcirculation and changes in fluorescent microscopy of EG layer. Our results support to further validate presented model of EG damage on a larger number of animals.
List of abbreviations
Chloride Endothelial glycocalyx Enzyme-linked immunosorbent assay Glycosaminoglycan International unit Serum potassium Serum sodium Perfused Boundary Region Proportion of Perfused Vessels Red blood cells Side-stream Dark Field imaging technology Urine Wheat Germ Agglutinin
Introduction
The endothelial glycocalyx (EG) is the fine carbohydrate-rich layer of the intravascular aspect of endothelial cells. EG has been demonstrated to have a vital role in microvascular physiology: microcirculatory flow, filtration into tissues, immunity surveillance, and anti-thrombosis [1]. Under pathological conditions - either infectious, traumatic, or perioperative –EG damage was reported [2]. Several models have been utilized to study EG protection such as in vitro experiments [3], isolated animal organs [4], and small animal experiments [5–7]. Most of the EG damage models are utilizing secondary triggers (sepsis, hemorrhage, cardiac arrest) which are difficult to reproduce and correlate with EG damage. EG damage depends mainly on the systemic inflammatory response which can vary between individuals. A primary EG damage model would be more reliable to study EG protection and treatment for faster EG restoration. By targeted EG derangement, it will be also possible to better understand EG function.
The glycosaminoglycans (GAG) of the EG are degraded by GAG–specific enzymes, e.g., hyaluronidase, heparanase, and neuraminidase. These enzymes are also responsible for EG degradation during the immune response in sepsis. They have been already used in vitro [8], in vivo in small rodents to study microvascular hemodynamics and permeability [9], and even in human medicine to treat myocardial infarction [10].
EG can be studied by ex vivo light or electron microscopy of tissue samples, by in vivo videomicroscopy using Side-stream Dark Field (SDF) imaging technology, and by biochemical analysis of EG degradation products (e.g., syndecan-1, heparan sulfate, hyaluronan) [11]. The biological surrogate of EG damage and endothelial dysfunction that may be used in clinics is albuminuria caused by glomerular EG degradation [12]. This fact has already been experimentally tested [13].
Our study aimed to induce a focused EG damage by specific enzymes degrading GAG –hyaluronidase and heparanase –in pigs and to describe this phenomenon by several independent methods.
Methods
Animal preparation and anesthesia
Four female piglets (Sus scrofa f. domestica) of average weight 34.25 (±1.7) kg were used to conduct the experiment. Animals were housed at the Animal Research Laboratory of the University of Defence, Faculty of Military Health Sciences Hradec Kralove, Czech Republic. The study protocol was approved by the Animal Care Committee of the University of Defence Brno, Faculty of Military Health Sciences Hradec Kralove, Czech Republic, and the Departmental Commission for the Protection of Animals of the Ministry of Defence, Prague, Czech Republic (approval number 72195/2020-684800). All the animals received humane care in compliance with the institutional guidelines and with the International Association of Veterinary Editors’ Consensus Author Guidelines on Animal Ethics and Welfare.
For the premedication, the animals were given ketamine (30 mg/kg; Narkamon, Spofa, Czech Republic), azaperone (40 mg/kg; Stresnil, Janssen Pharmaceutics, Belgium), and atropine (0,05 mg/kg; Atropin Biotics A.U. V, Biotics, Slovakia) intramuscularly. The ear vein was canulated (G18 intravenous cannula, B-Braun, Melsungen, Germany) for general anesthesia with propofol (1 mg/kg; Propofol, Fresenius Kabi, Bad Homburg, Germany) and fluid resuscitation with a balanced crystalloid solution to ensure adequate urine output for biochemical urine analysis (10 ml/kg per hour, Isolyte, Fresenius Kabi, Bad Homburg, Germany). Pigs were then intubated with an endotracheal tube. General anesthesia was maintained with 2% inspiratory concentration of isoflurane (Forane, Baxter S.A., Lessines, Belgium) in a mixture with 40% oxygen and air. A femoral artery was cannulated for invasive blood pressure measurement and blood sampling (Arrow 18G, length 16 cm, Teleflex, Athlon, Co. Westmeath, Ireland). At the end of the experiment, the animals were euthanized using intravenous T61 (Intervet International B.V., Boxmeer, The Netherlands).
Induction of EG damage
In four piglets the EG damage was induced by enzymatic digestion with intravenously administered enzymes. Each animal was given heparanase (25 IU, heparanase I from Flavobacterium heparinum, Sigma Aldrich, Co, St. Louis, MO, USA) and hyaluronidase (hyaluronidase from bovine testes, 1 gram: 400–1000 IU/mg, Sigma Aldrich, Co, St. Louis, MO, USA) in 100 ml aqua for injection over 20 minutes at the beginning of the protocol.
In vivo videomicroscopy
Videos of the sublingual microcirculation were recorded using a handheld MicroScan microscopy camera (image size: 720×480 pixels; field view: 1044×758μm; software: AVA 4.3C; MicroVision Medical, Amsterdam, The Netherlands; see Fig. 1). A detailed description of the utilized SDF technology has been published elsewhere [14]. Recordings were done at baseline and in 20 minutes intervals until 120 minutes. The study was performed according to the second international consensus of the microcirculation assessment in the critically ill [15] from the sublingual area. For each time point, 4 recordings were obtained from different places underneath the animal’s tongue in the shaft like space created by median and later sublingual plicae on each side of the tongue where the tip of the microvision camera could have been adequately positioned. The video acquisition process was guided by the AVA 4.3C software to ensure adequate brightness, contrast, and stability. The recording was finished after the acquisition of 60 frames (30 frames per second) of microcirculation of vessels of diameter from 5 to 25μm. Care was taken to avoid pressure in the tissue under the probe which can decrease blood flow in the capillaries. Recordings were then analyzed offline using the same software AVA 4.3C providing parameters according to the consensus (Fig. 2) [15]:

Sublingual microcirculation (pig) visualized by SDF imaging (MicroScan camera). The image covers a tissue area of 1044×758μm.
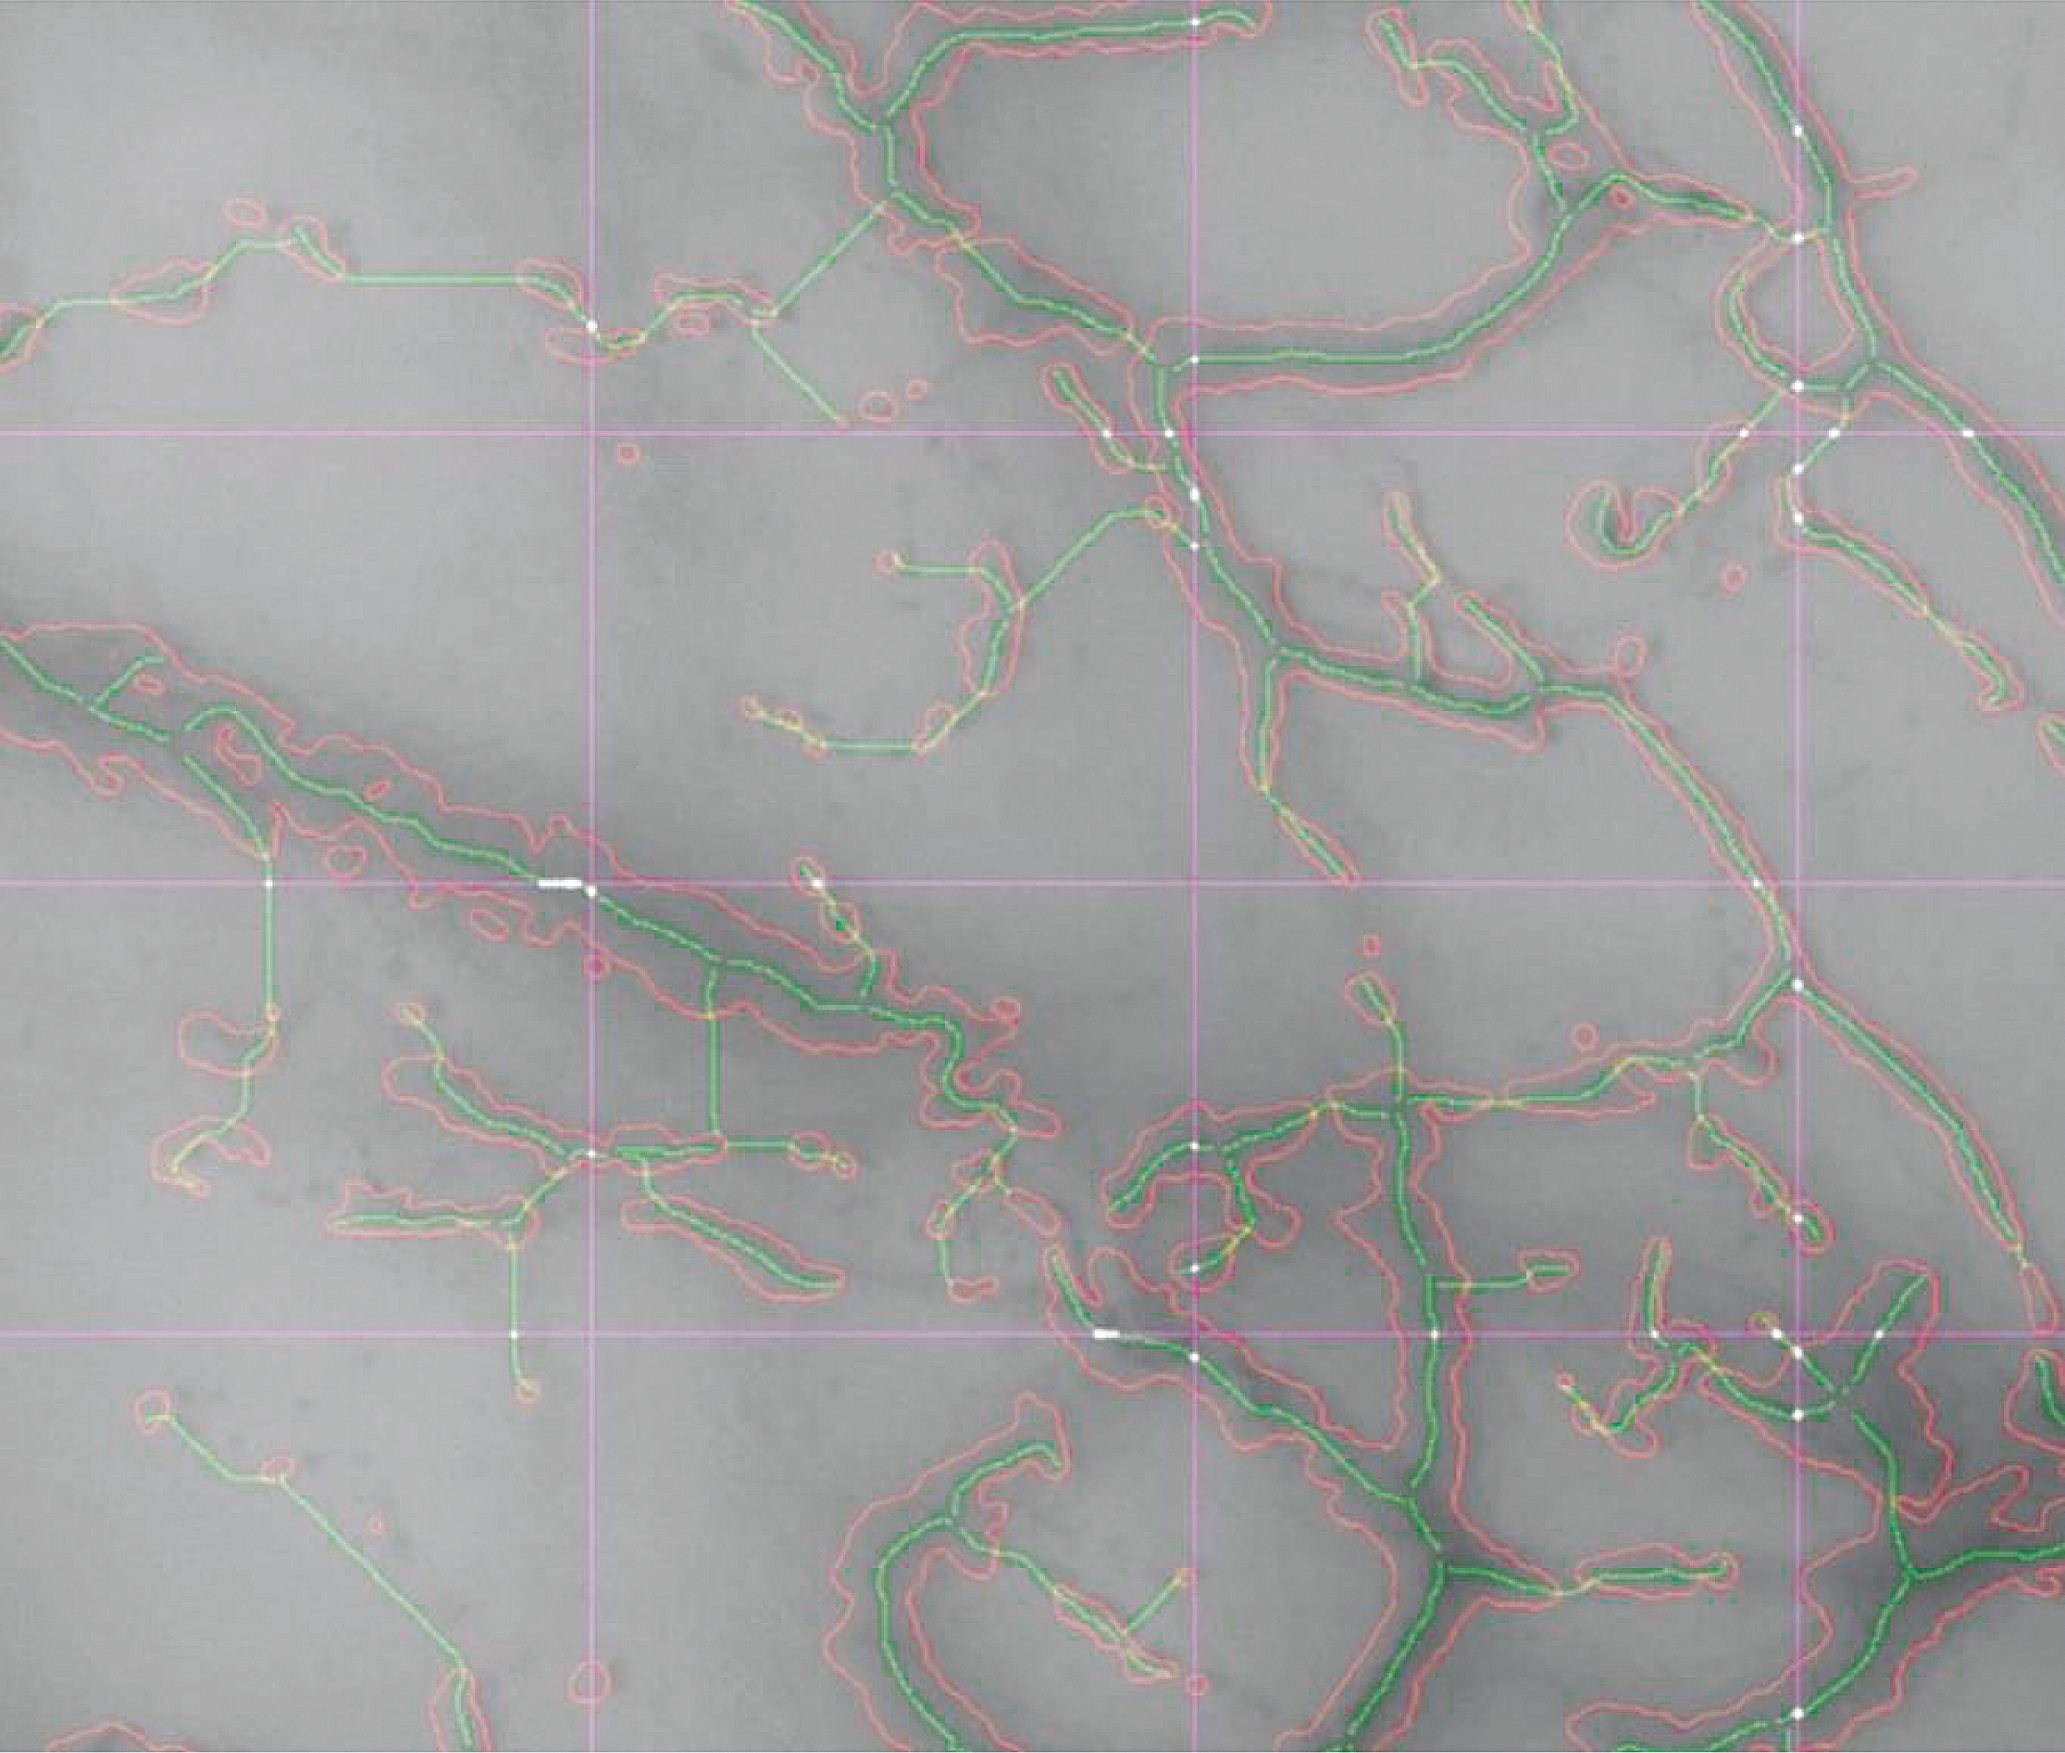
Software processing of microcirculatory recording by AVA 4.3C. Red lines delineate vessels included in the analysis.
Number of crossings –a number of vessels crossing three arbitrary horizontal and three vertical equidistant lines (drawn on the screen, Fig. 2) De Backer score –given in mm-1, calculated as the number of crossings divided by the total length of the lines, Proportion of Perfused Vessels (PPV) –a percentage of perfused vessels out of all visible vessels.
The second set of recordings of the microcirculation at the same time points was made by another camera for measurement of the thickness of the EG layer. The handheld microscopic camera (KK Research Technology Limited, Alliance Court, Honiton, UK; 752×480 pixels, 692×442μm) was placed under the animal’s tongue the same way (Fig. 3). Recordings of the sublingual microcirculation were automated and subsequently analyzed by specialized software (GlycoCheck, Maastricht, The Netherlands) for calculation of the Perfused Boundary Region (PBR). The technique was described in detail elsewhere [16]. Briefly, PBR describes the extent of penetration (in μm) of the flowing red blood cells (RBC) into the EG layer by measuring the radial motion of RBC away from the central flow towards the endothelial cells. The more the EG is injured, the deeper RBC penetrates the glycocalyx, and the higher the PBR is. The software automatically measures PBR in vessels of diameter ranging from 5 to 25μm (capillaries exclusively) and the resulting number stands for an average of PBR that is corrected for the potential changes in the distribution of vessel diameters. The software identifies all available vessels and places 10μm long vascular segments along with them (Fig. 4). The recording is stopped when 3000 segments are acquired in focus and without movement. Then the software selects segments with sufficient contrast with the background and counts the median RBC column width and its distribution from the intensity profile. From this intensity profile, the perfused diameter of the vessel is calculated by linear regression analysis. The PBR stands for the distance between RBC column width and perfused diameter according to the equation: (Perfused diameter –median RBC column width)/2.
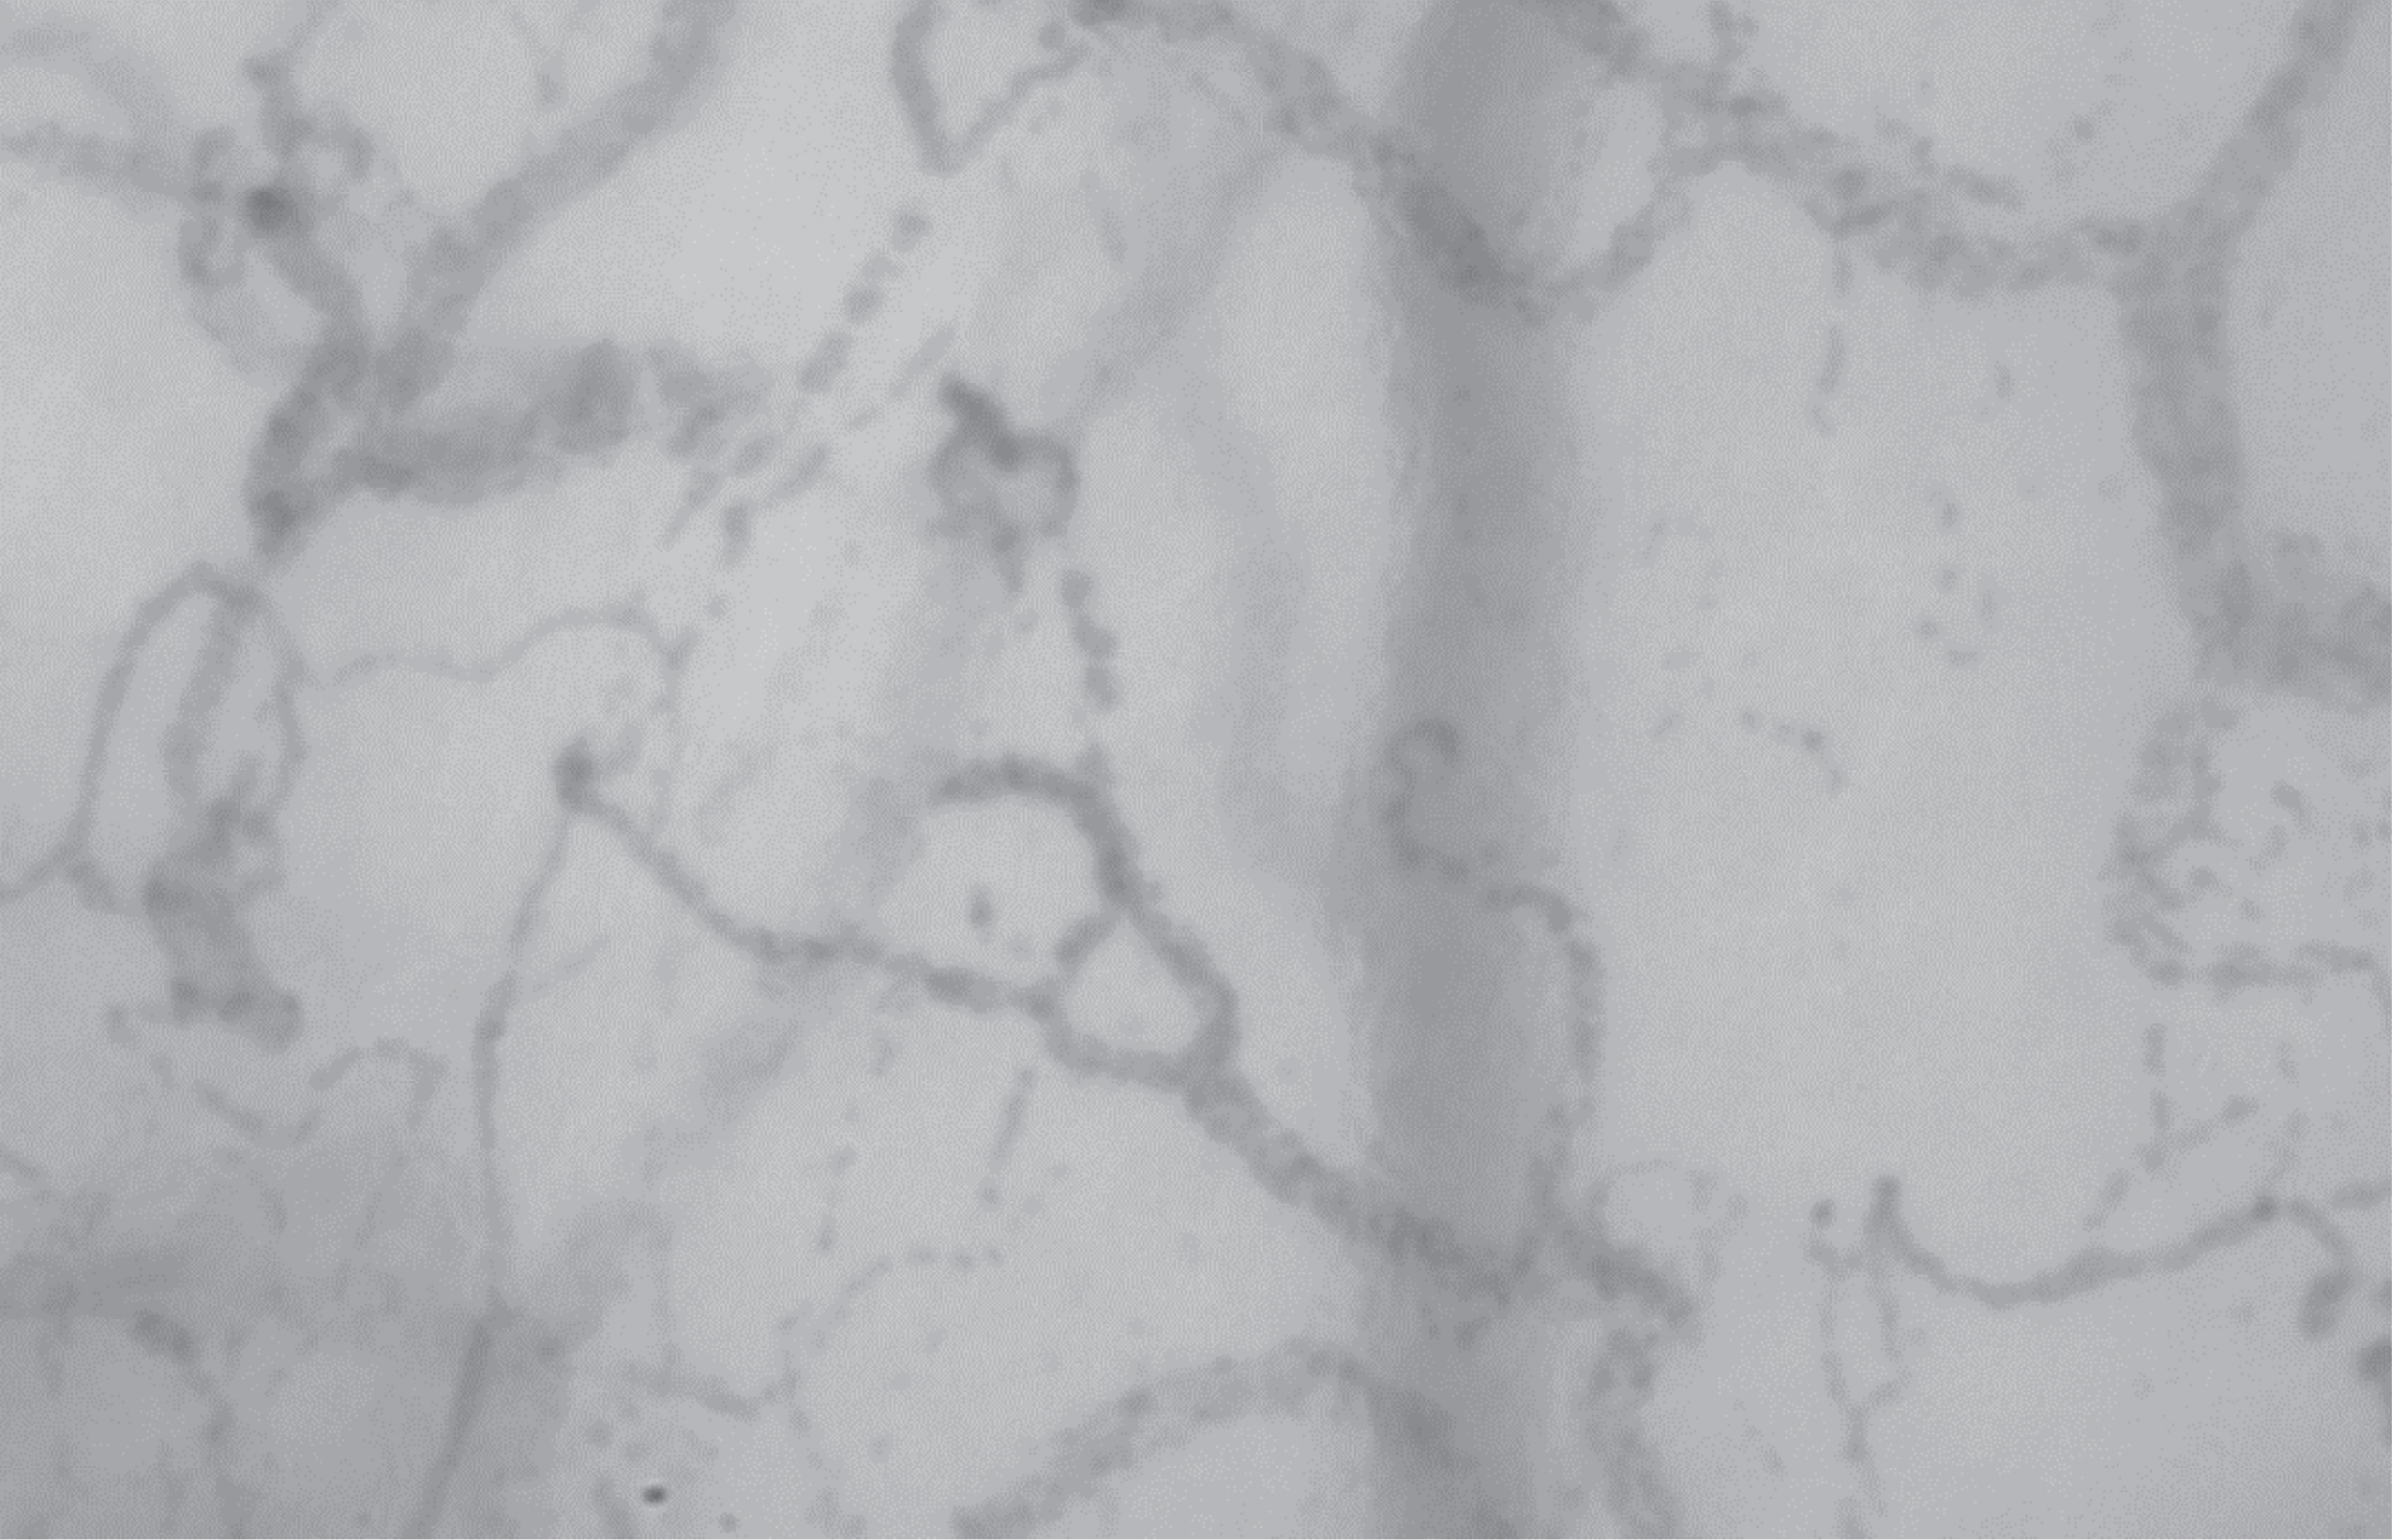
Sublingual microcirculation (pig) visualized by SDF imaging (KK camera). The image covers a tissue area of 692×442μm.
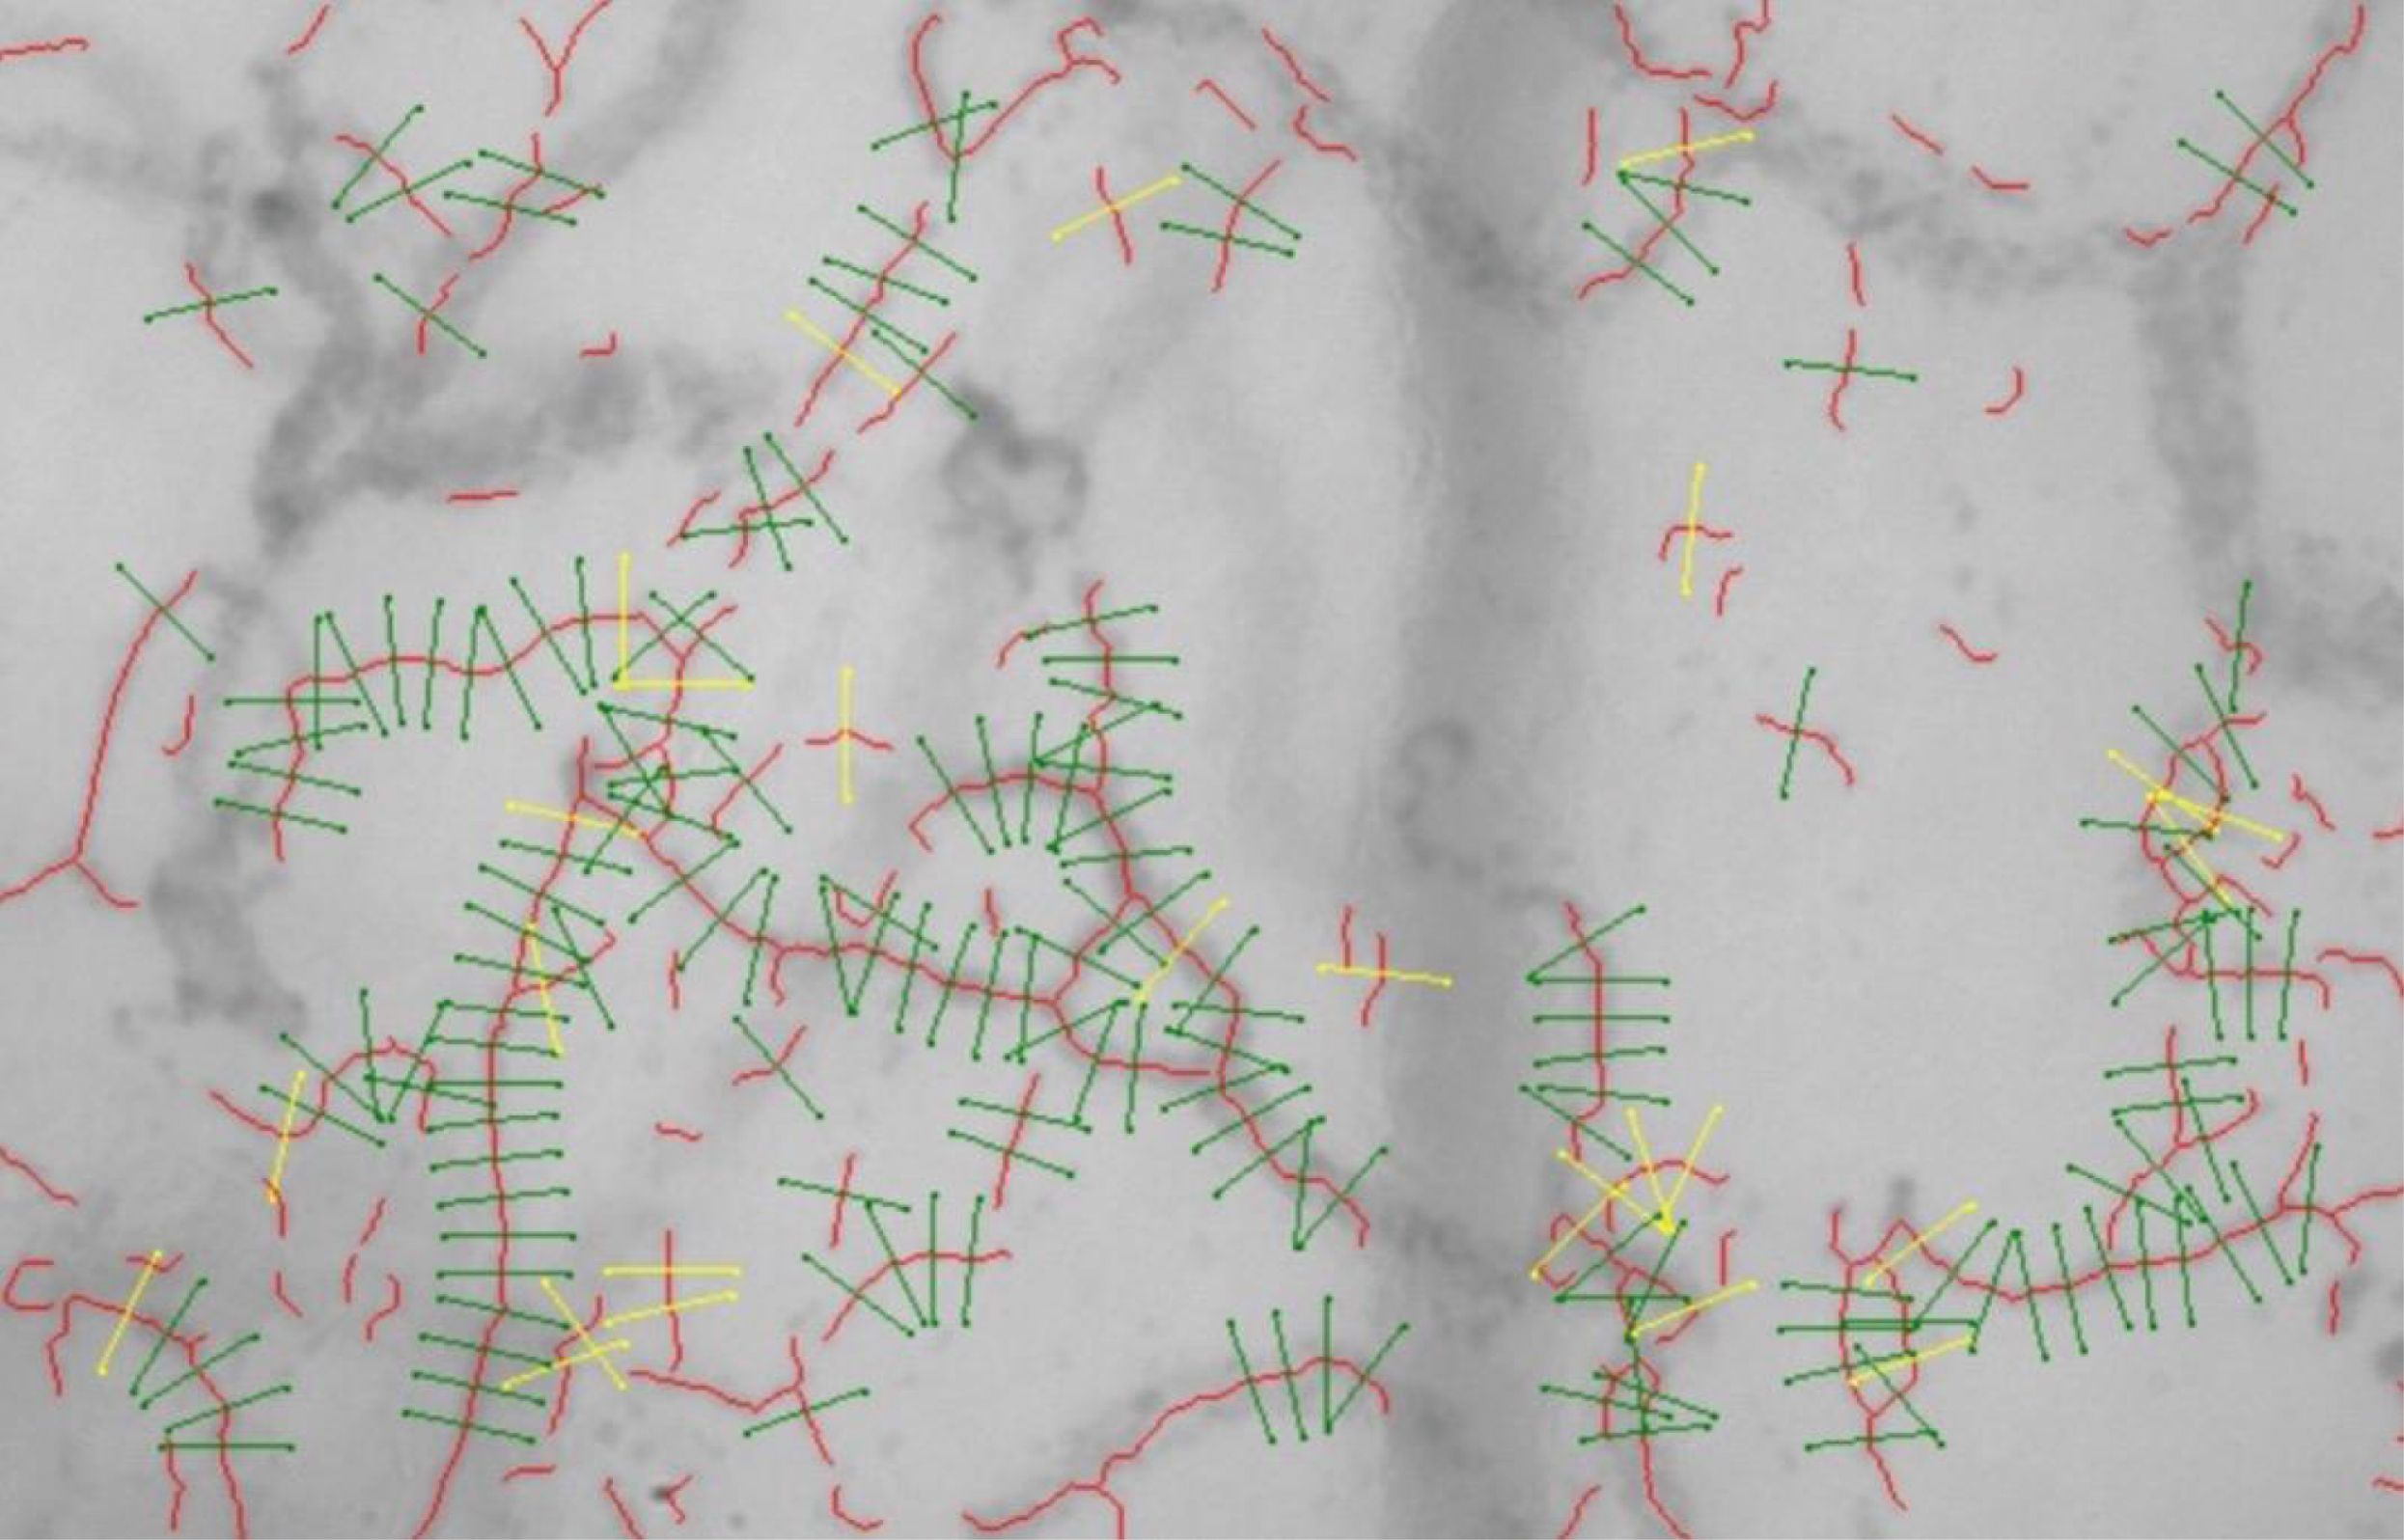
Image processing by GlycoCheck analysis software. Drawn lines trace all available vessels with diameters from 5 to 25μm, demark vascular segments selected for the analysis, and withdraw invalid segments.
At baseline, serum analysis (sodium, potassium, chloride, urea, creatinine, albumin; Cobas 8000 Roche, Basel, Switzerland), urine analysis (albumin, creatinine; Cusabio, Houston, TX, USA) and hematology (blood count; Sysmex XN-10, Cobe, Japan) was performed. Subsequently, serum samples were taken in 20 minutes and then in 20 minutes cycles until 120 minutes (sodium, potassium, chloride, albumin). Urine samples were taken in 20 minutes cycles until 120 minutes for albumin, creatinine, and glycosaminoglycan determination (assessment by dimethyl methylene blue [17, 18], spectrophotometer PharmaSpec UV-1700, Shimadzu, Japan). Blood samples for biomarkers of EG damage (syndecan-1; Porcine Syndecan AB Clone ELISA kit, Woburn, MA, USA), endothelial cell activation (P-selectin; ELISA kit MyBioSource, San Diego, CA, USA), and damage (thrombomodulin; ELISA kit, MyBioSource, San Diego, CA, USA) were taken in the same time points as biochemistry.
Histology and histochemistry
Kidney and mesentery biopsies were excised and immersed in neutral 10 % formalin for 5 hours at room temperature, embedded in OCT (Tissue-Tek®, Sakura Finetek, Alphen aan den Rijn, The Netherlands), and frozen. Serial 10-μm-thick cryosections were cut in a cryostat (Leica Biosystems, Nussloch, Germany). Each tenth slide in the series was stained with hematoxylin-eosin for histological examination of the tissue.
For lectin histochemical detection the thawed sections were incubated in a solution of Wheat Germ Agglutinin (WGA; Triticum vulgaris lectin) conjugated to Alexa Fluor® 488 (10μg/ml; Invitrogen™, Paisley, UK) for 30 min at room temperature. Following thorough washing, the sections were coverslipped using Fluorescence Mounting Medium (Dako, Carpinteria, CA, USA) and examined in an Olympus BX51 microscope equipped with epifluorescence and DP71 camera (Olympus, Tokyo, Japan). To reveal autofluorescence, serial sections processed without incubation in lectin solution were examined.
Statistical analysis
Statistical software Prism 8 for macOS was used (version 8.4.3, GraphPad Software, San Diego, CA, USA). All data were tested for normality by the Shapiro-Wilk test and basic descriptive statistics were done. For single data set comparison paired Student t-test or Wilcoxon test were used. For multiple comparisons, RM one-way ANOVA or Friedman test was used based on the distribution of the data. A p-value of 0.05 was set as statistically significant.
Results
Vital signs
Vital signs remained stable in all the animals throughout the experiment. The median mean arterial pressure ranged from 56 to 73 mmHg. The lowest values were not below 50 mmHg. None of the animals required any vasopressor. The median heart rate ranged from 69 to 133 beats per minute. End-tidal concentration of carbon dioxide ranged from 38 to 57 mmHg.
In vivo videomicroscopy
Assessment of the sublingual microcirculation showed no significant changes in the number of crossings or the DeBacker score, respectively. The PPV dropped from baseline 88 (88–93) % to 74 (±5.5) % within 40 minutes (p = 0.13 for Wilcoxon test) and had a trend back to baseline; ANOVA analysis showed significant differences in the course of the experiment (p = 0.04). The PBR increased from baseline 2.1 (±0.16) μm to 2.4 (±0.18) μm in 80 minutes and then had a trend back to baseline. All data are shown in Table 1.
Results of the automated microscopic assessment of the microcirculation and endothelial glycocalyx
Results of the automated microscopic assessment of the microcirculation and endothelial glycocalyx
PPV: proportion of perfused vessels, PBR: perfused boundary region. The p-value stands for RM one–way ANOVA test or Friedman test based on the data normality. Values are shown as mean (standard deviation) or median (interquartile range).
We observed significant changes in potassium and chloride levels during the study in the experimental animals (Table 2). Baseline hematocrit was 0.3 (±0.03). Syndecan-1 increased gradually from 0.97 (±0.31) ng/ml at baseline to 1.7 (±0.86) ng/ml at 80 minutes and then decreased slightly again. No significant changes were also observed in P-selectin and thrombomodulin levels (Table 3). Serum albumin dropped from baseline 29 (±1,7) g/l to 26 (±3) g/l in the first 20 minutes and then had a trend back to the baseline (Fig. 5). Median urine albumin rose from baseline 4.2 (0.11–11) mg/l to 324 (22–1521) mg/l in 40 minutes and then decreased gradually to 175 (29–415) mg/l in 120 minutes (Fig. 6). Median urine albumin-creatinine ration (ACR) showed the same pattern: rose from baseline 0.39 (0.03–5.2) to 168 (9.4–330) in 40 minutes and decreased gradually to 44 (9.5–101) in 120 minutes (Fig. 7). Median urine glycosaminoglycans rose gradually from baseline 86 (48–220) mg/l to 152 (118–227) mg/l in 120 minutes (Fig. 8). When corrected to urine creatinine the peak median glycosaminoglycan values appeared at 60 minutes (Fig. 9).
Summary of selected biochemical variables
Summary of selected biochemical variables
Na+: serum sodium, K+: serum potassium, Cl-: serum chloride, U: urine. Values are shown as mean (standard deviation) or median (interquartile range).
Summary of microcirculation and EG specific biochemistry results
GAG: glycosaminoglycans. Values are shown as mean (standard deviation) or median (interquartile range).
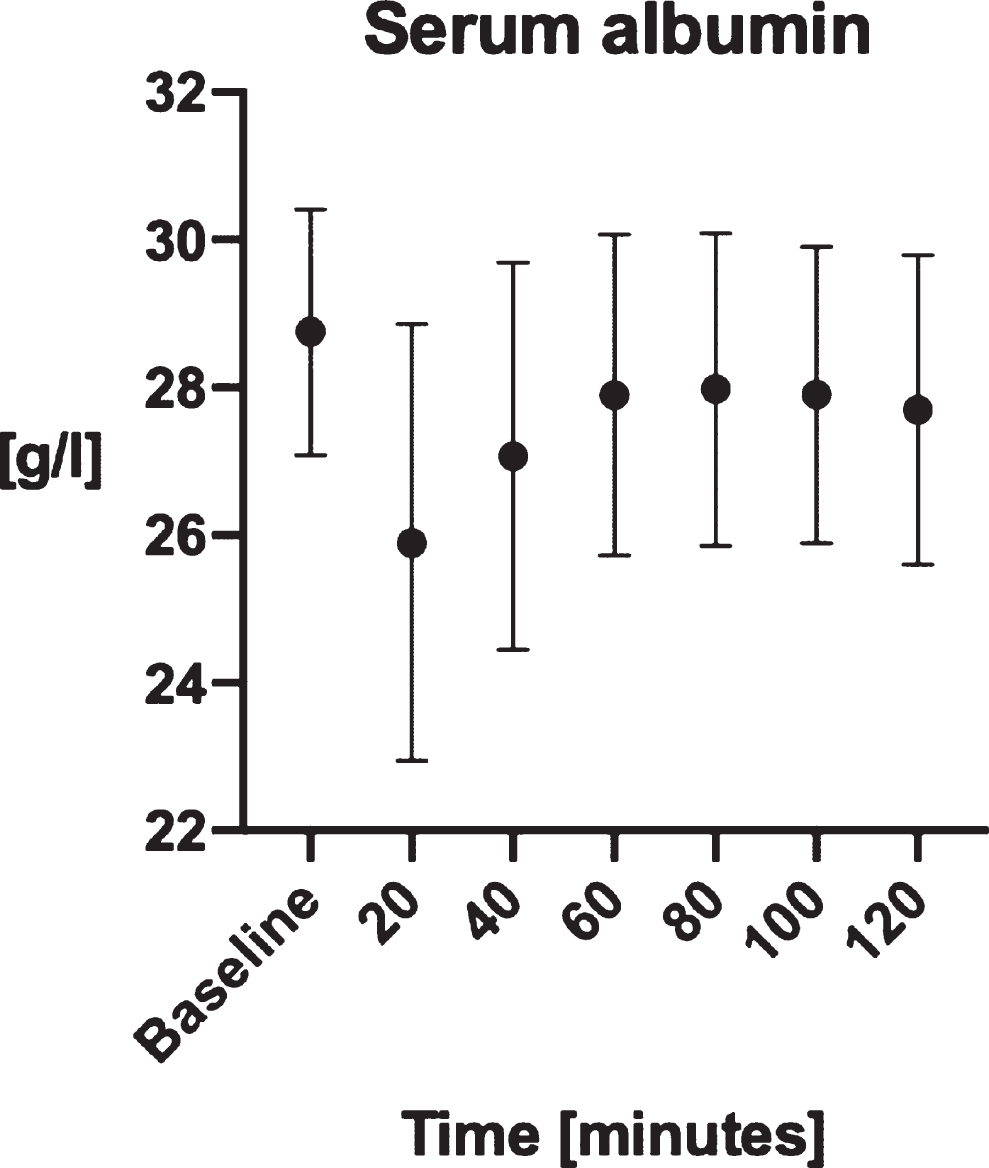
Serum albumin.
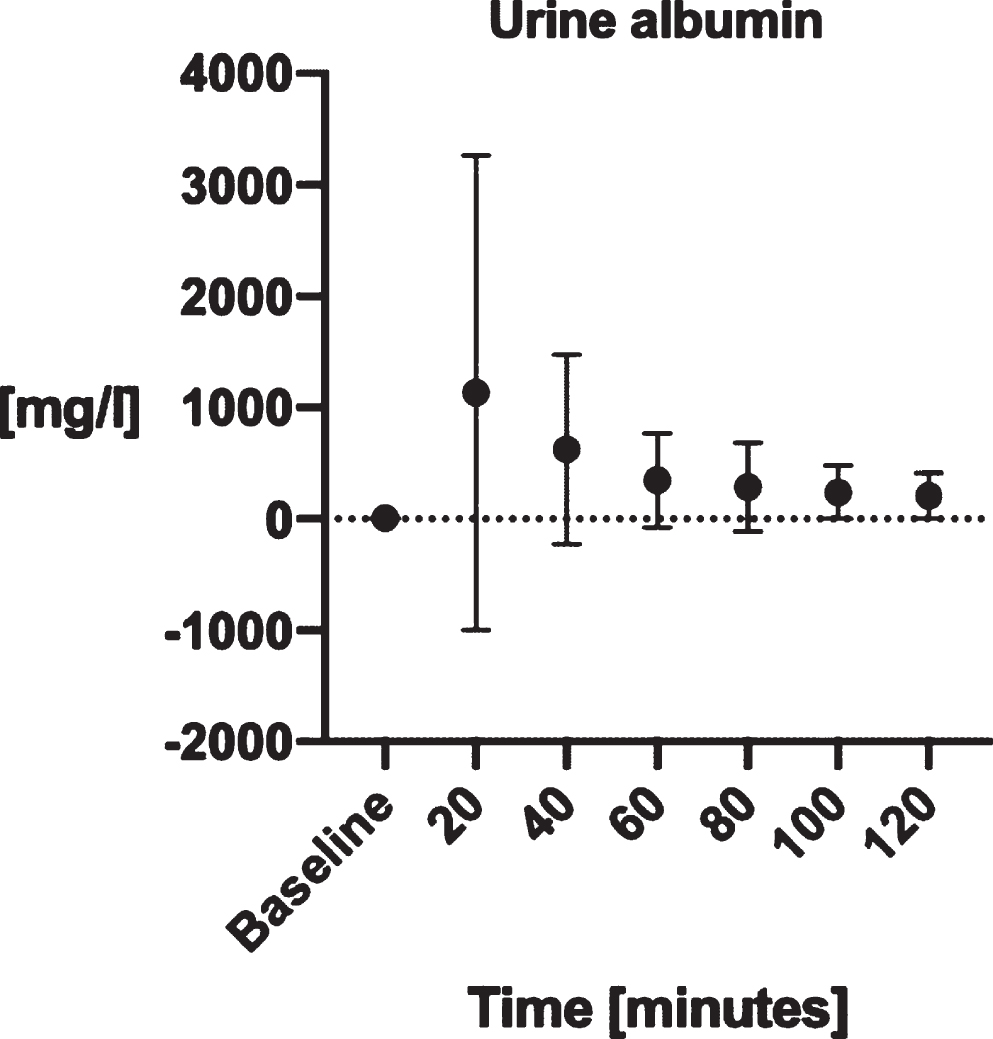
Urine albumin.
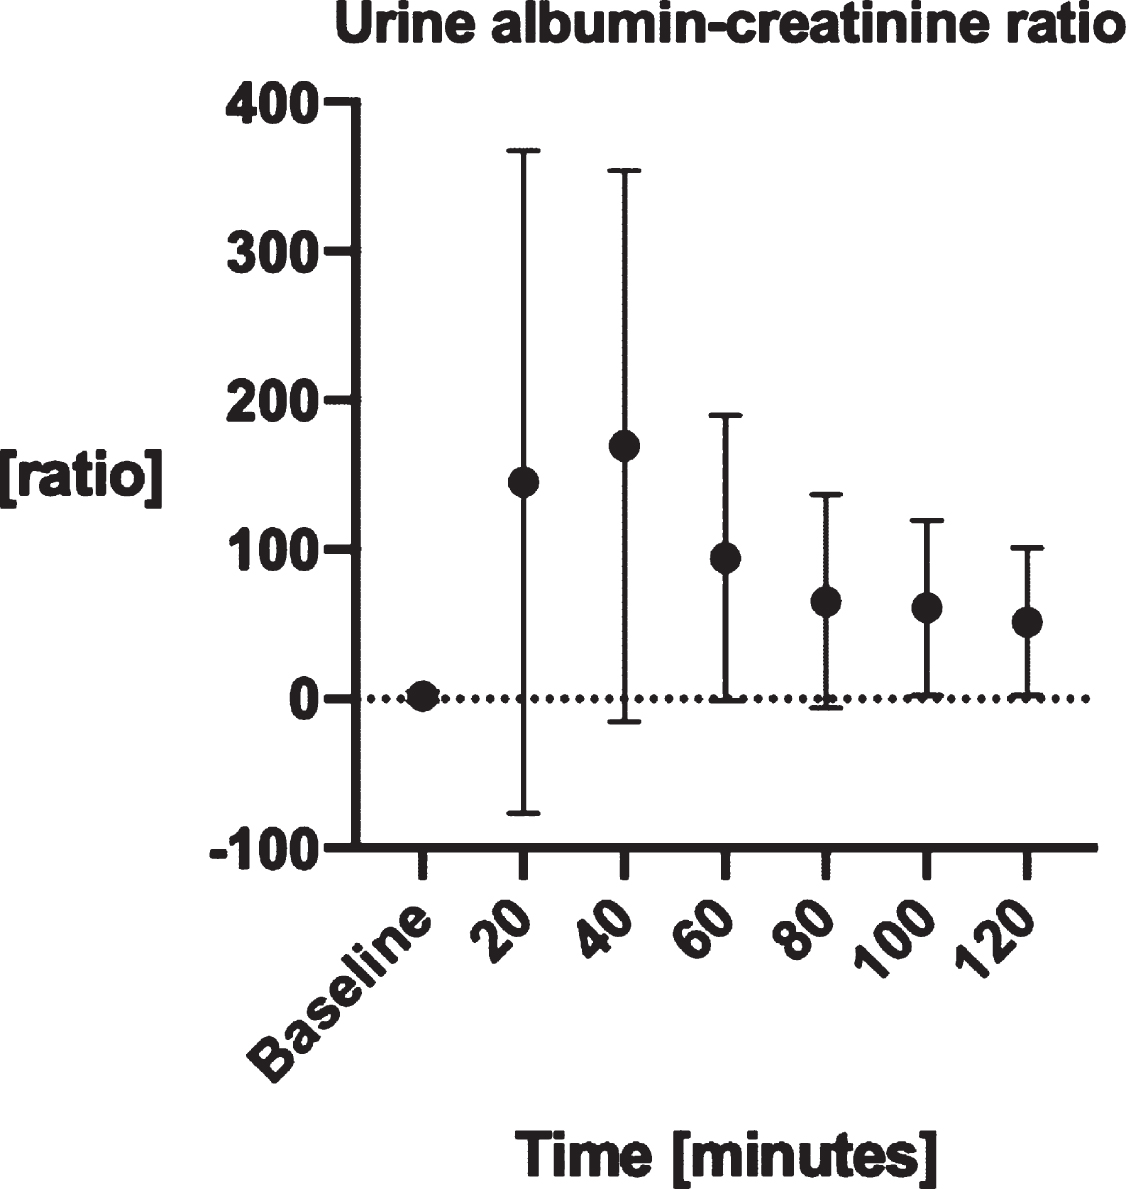
Urine albumin-creatinine ratio.
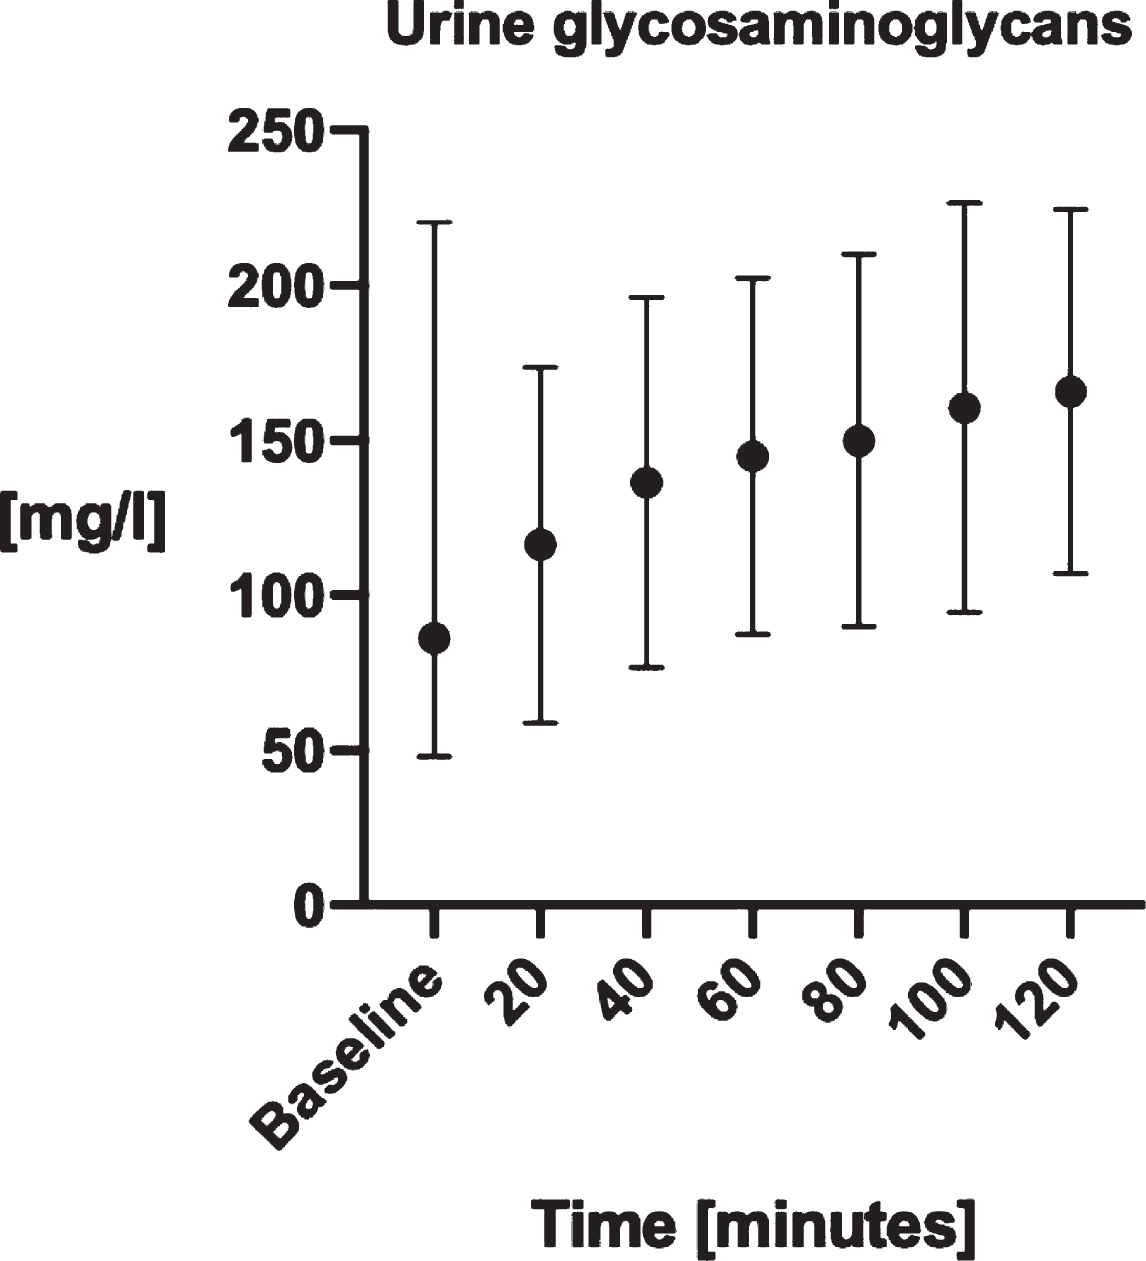
Urine glycosaminoglycans.

Urine glycosaminoglycan-creatinine ratio.
In fluorescence microscopy, we observed diminished signal, irregularities, and decreased thickness in the EG layer in biopsies taken at 120 minutes compared to the baseline in mesenteric vessels (Fig. 10) and renal glomeruli.

Fluorescence microscopy of EG. Visualization of EG in the mesenteric artery by fluorescence microscopy. The green signal is by Alexa Flour 488 bonded to WGA lectin. The figure on the left is a baseline, the figure on the right is in 2 hours after application of digestive enzymes. White arrows show EG. Both figures are 200×magnification.
In our pilot study in piglets, we induced primary EG damage by intravenous administration of the digestive enzymes, hyaluronidase, and heparanase I. To our knowledge, this is the first published study of primary EG damage in bigger animals. EG damage was observed by 3 independent methods of assessment. Firstly, by an increase of serum syndecan-1. The concentration of this marker depends on renal function [19] and gender [20]. Secondly, by real-time microscopic video imaging. The value of PBR showed a positive trend after the injection of the digestive enzymes. Values of PBR were higher compared to the healthy population [20]. All degradation products derived from EG were found in the urine in a positive trend through the whole observation period. Lastly, in fluorescent microscopy of mesenteric artery reduced and irregular EG layer was observed just by visual inspection. As the EG gets damaged the dysfunction of the endothelial barrier appears [21]. It is linked to capillary leakage of fluid and proteins, namely albumin [22]. Kidneys are particularly sensitive to the endothelial barrier integrity [23]. In our model, we detected a transient increase in albuminuria after enzymatic EG damage induction and trend back to baseline as well as a drop in the serum albumin concentration with a trend back to baseline. This finding points toward urine albumin being a sensitive and strong biomarker of EG damage in healthy kidney and also points toward the EG rapid recovery after a focused insult [24]. Observed transient dysfunction in perfusion of the microcirculation as described by significant changes in PPV may also be linked to the EG damage although it can occur independently [25]. Our model is focused only on EG damage. It avoids systemic inflammatory response as seen in hemorrhage [5], sepsis [6], or cardiac arrest [26].
The concept of enzymatic EG damage has been tested already in small animals. Landsverk et al. injected hyaluronidase in hamsters and studied the skin microcirculation. They described microcirculation dysfunction by the drop in Functional Capillary Density (parameter derived from PPV) and increase in hyaluronan degradation product in serum. No capillary leakage has been observed by evaluation of the distribution volume of indocyanine green [9]. Similarly, Yalcin et al. observed microcirculatory changes in the rat cremaster muscle by intravital microscopy after injection of heparanase III, chondroitinase ABC and hyaluronidase. The EG damage has been observed as a decrease in the thickness of the cell free layer and an increase in the blood flow velocity in the microcirculation [27]. Both the studies used hyaluronidase. One study mixed three enzymes. We used hyaluronidase and heparanase as these two glycosaminoglycans are the most abundant ones in the EG composition [28].
Our experimental study has two limitations. Firstly, as it is a pilot study, we had a low number of animals which diminished the power of statistical tests. We aimed to find a trend rather than statistical significance and aimed at the biological signal to the focused EG damage to prove our concept. Also, we intended to find a positive signal in all three modalities of investigation independently. In this respect our experiment was successful. And secondly, we had a relatively short time of the observation period after the enzyme delivery. Some variables trended back to baseline but did not reach it. This allows us to suggest a relatively rapid recovery of the EG function after a short-focused insult. Also, in both the studies mentioned that use enzymatic damage model of EG in small animals, the observation period was similar [9, 27]. We propose our model for future experiments on the larger number of animals based on sample size calculation. The model is particularly suitable for research of medical fluids: saline versus albumin and balanced crystalloids, fluids given in continuous infusion versus in bolus; hypervolemia versus hypovolemia.
Conclusion
In our pilot study, we induced EG damage in pigs by injection of hyaluronidase and heparanase I. The morphological derangement was described by three independent methods of EG assessment: by biochemical markers (increase in syndecan-1 levels in blood and GAG concentration in urine), by microscopic in vivo imaging method (increase in PBR values), and by fluorescent microscopy (reduction of the EG thickness and irregularity in mesentery artery). The biological effect of EG dysfunction was linked to a drop in albuminemia and a rise in albuminuria. Both these derangements of physiology tended to be transient pointing at the rapid recovery of the EG function after short-focused insult. We propose our model for further testing and validating on the larger sample of animals. Having a biologically and clinically relevant model allows us to test current and future possible therapeutic interventions to protect EG.
Footnotes
Acknowledgments
We thank Vera Radochova, D.V.M. for practical help during the experiment.
Availability of data and materials
All data and materials are available upon reasonable request to the first author.
Authors’ contributions
DA–designed the experiment, wrote a grant proposal, conducted the experiment, recorded microcirculation recordings, did a statistical analysis of the results, wrote the majority of the manuscript.
AT –conducted the laboratory investigation.
RH –conducted the laboratory investigation.
ADT –conducted the laboratory investigation.
PN –helped to conduct the experiment, took biopsies.
OM –helped to conduct the experiment, took biopsies.
RCP –helped to conduct the experiment.
DC –processed the biopsies and prepared fluorescent microscopy images.
SCH –analyzed microcirculation recordings.
MM –helped to write the manuscript.
CHL –helped to write the manuscript, did language check.
VC –helped to design the experiment, helped to conduct the experiment, helped to write the manuscript.
Competing interests
Not applicable.
Ethics approval
The study protocol was approved by the Animal Investigation Committee of the University of Defence Brno, Faculty of Military Health Sciences Hradec Kralove, Czech Republic, and the Departmental Commission for the Protection of Animals of the Ministry of Defence, Prague, Czech Republic (approval number 72195/2020-684800).
Consent for publication: Not applicable.
Funding
Supported by MZ ČZ –RVO (UHHK, 00179906), PROGRES Q40/N8514002, and PROGRES Q40/06.