
Abstract
BACKGROUND:
in this study, with a re-evaluation of the hemorheological determinants previously described in MGUS subjects and in MM patients, we have detected the calculated whole blood viscosity, according whether to the hematocrit and total plasma protein concentration (de Simone formula) or to the haematocrit and plasma fibrinogen level (Merrill formula), and a marker of the erythrocyte aggregation (albumin/fibrinogen level).
METHODS:
data were expressed as means±standard deviation. Student’s t test for unpaired data was used to compare MGUS subjects and MM patients. The correlation coefficient between mean erythrocyte aggregation (MEA) and hematocrit (Ht) was evaluated in MGUS, MM and MGUS + MM groups using the Spearman test.
RESULTS:
the comparison between MGUS and MM shows that the measured blood viscosity and calculated blood viscosity based on hematocrit and total plasma protein, but not which estimated in relation to the hematocrit and plasma fibrinogen, differentiate the two groups. A difference between the two groups also regards the measured erythrocyte aggregation and its surrogate marker. In addition, the measured plasma viscosity at low shear rate (0.51 s–1) and, in particular, the ratio between plasma viscosity at low (0.51 s–1) and high (450 s–1) shear rates distinguish MGUS and MM.
CONCLUSIONS:
calculated blood viscosity (de Simone formula and other formulas) and the surrogate marker of erythrocyte aggregation disclose an alike trend with the corresponding hemorheological determinants obtained by using their direct measurement.
Keywords
Introduction
In addition to depending on cardiovascular activity, blood flow is strictly influenced both by the systemic and district characteristics of the blood vessels and by blood characteristics that, as is known, is a tissue with its own viscosity, which is direct expression of its resistance to flow.
The measurement of blood viscosity, which is related to cell mass (expressed by the hematocrit), plasma viscosity as well as erythrocyte aggregability and deformability, is carried out ex vivo using different types of viscometers such as rotational, capillary, and oscillatory ones. The same applies to the ex vivo assessment of both erythrocyte aggregability, determined directly with the use of aggregometers such as the Myrenne MA-1 and the Laser-assisted Optical Rotational Cell Analyzer (LORCA), and the erythrocyte deformability measured above all with filtration, with the use of micropipettes or with diffractometric techniques.
However, blood viscosity can also be estimated or calculated from hematocrit and total plasma proteins or from hematocrit and plasma levels of fibrinogen. Initially, in some papers the assessment of viscosity was simultaneously both measured and calculated and this happened in apparently normal subjects with cardiovascular risk factors [1] and in subjects with insulin resistance [2].
Instead, in the last decades the calculated blood viscosity alone has been increasingly used, also thanks to some well-documented works by Nwose et al. [3, 4] which even proposed the use of a flow chart useful for clinicians to easily calculate the blood viscosity of each patient starting from the hematocrit and total plasma proteins.
Blood viscosity calculated from hematocrit and total plasma protein concentration was evaluated in relation to arterial pressure [5, 6], coronary and carotid atherosclerosis [7], coronary artery disease awaiting coronary artery bypass graft [8], microvascular angina [9] and myocardial infarction, in order to predict the formation of a left ventricular thrombus within twelve months of an acute anterior infarction [10]. Starting from the same parameters, the calculated blood viscosity was examined in normal young men in relation to insulin sensitivity [11], in a group of subjects with prediabetes [12], in type 2 diabetics divided both by sex and diabetic retinopathy [13], in type 2 diabetics with metabolic syndrome [14], in subjects with hypertriglyceridemia undergoing plasmapheresis [15], in subjects with aortic sclerosis [16], in subjects with aortic valve sclerosis [17] and in scleroderma subjects with or without pulmonary hypertension [18].
As hypothesized by Merrill et al. [19], the blood viscosity was expressed as Yield Shear Stress (YSS) and calculated from the hematocrit values and the plasma levels of fibrinogen. The YSS expresses, according to the Merrill’s study, the maximum stress that blood can support without flowing. This parameter was also evaluated in a group of type 1 diabetics divided based on glycometabolic control [20] and in type 2 diabetics with or without associated arterial hypertension [21]
The indirect determination of blood viscosity, which as is known is a simple parameter with implicit complex implications, seems particularly useful when population studies are carried out, taking into account how it was estimated in de Simone’s study [1], that the hematocrit and total plasma proteins alone seem to predict more than 80% of the variability of the same blood viscosity, within a range of shear rates between 0.1 and 208 s-1.
However, it must be emphasized that the same authors believe that the reliability of the calculated blood viscosity is higher for a hematocrit range between 32% and 53% and for a total plasma protein concentration range between 5.4 and 9.5 g /100 ml.
Similarly, the blood viscosity calculated from the plasma values of fibrinogen and the hematocrit is based on a range of fibrinogen between 0.14 g / 100 ml and 0.42 g / 100 ml and on a range of total plasma proteins between 4.5 g / 100 ml and 6.7 g /100 ml.
Another consideration related to the calculated blood viscosity concerns the fact that all the formulas used so far do not consider neither the deformability nor the aggregability of red blood cells. The latter data is therefore an obstacle for the indirect assessment of blood viscosity in all clinical conditions characterized by primitive sclerocytemic hyperviscosity, which is generally observed in hereditary spherocytosis, beta-thalassemia, sickle cell anemia [22] but also in hereditary elliptocytosis, chorea-acanthocytosis, ovalocytosis and hereditary stomatocytosis.
On the other hand, the approach aimed at evaluating erythrocyte aggregability seems different, because this hemorheological determinant is functionally relevant to the low sliding gradients found in the venous district, considering that the albumin/fibrinogen ratio, as well as its inverse, are related to the values of erythrocyte aggregability [23, 24].
The doctrinal assumption underlying this last data is perhaps to be found in the fact that, although the plasma concentration of albumin represents almost 60% of the total proteins, its influence on the viscosity of the plasma is around 36% on average, while in physiological conditions the plasma concentration of fibrinogen on average affects 22% of the plasma viscosity with a concentration equal to 4% of the total proteins [25]. As is well documented by the hemorheological scientific literature [26, 27], the aggregability of red blood cells largely depends on the electrical and mechanical properties of the erythrocytes, the dielectric coefficient of the plasma and the concentration of high plasma proteins, molecular weight such as fibrinogen, α2-macroglobulin and immunoglobulins.
In recent years, we have measured blood viscosity and its main determinants in two different plasma cell disorders: the monoclonal gammopathy of undetermined significance (MGUS) and multiple myeloma (MM), characterized by the presence of a monoclonal paraprotein in the serum and/or urine and of a plasma cell clone in bone marrow and/or although rarely in other tissues [28]. From this research [29–31] it emerged that, while in subjects with MGUS an increase in blood and plasma viscosity is evident, associated with a reduction in erythrocyte deformability, in patients with multiple myeloma the increase in plasma viscosity and the reduction of erythrocyte deformability are not associated with an increase in blood viscosity as patients with MM are anemic.
In this paper our aim is to evaluate the calculate blood viscosity in the same subjects of the two different groups (MGUS and MM) using both methods, one based on hematocrit values and the concentration of total plasma proteins, using the formula WBV at 208 seconds–1: (0.12 x Ht) +0.17 (total protein –2.07), according to several authors [3–10, 13–18]; and the other one based on hematocrit and plasma fibrinogen concentration and the albumin/fibrinogen ratio (indirect marker of erythrocyte aggregation), to compare them with the directly measured hemorheologic determinants. In all used formulas the units of measures were for total proteins and albumin gr/dl, and for fibrinogen mg/dl.
Subjects
In this paper, we have measured and calculated some determinants of the hemorheological profile in a group of subjects with monoclonal gammopathy of undetermined significance (MGUS) and in a group of Multiple Myeloma (MM) patients.
MGUS
A subject group of 21 patients (11 women and 13 men; mean age 66.7±10.9 years) with MGUS were examined. The monoclonal Ig was IgG in 18 subjects and IgM in 2; in a subject both monoclonal IgG and IgA were observed. The time interval from the first detection of the monoclonal plasma proteins was 41.3 + /–50.2 months.
Multiple myeloma
We enrolled 29 patients (11 women and 18 men; mean age 67.9±10.6 years) with MM. The group included 9 IgA, 16 IgG, 1 IgM and 3 non-secretory MM. Sixteen patients were recently diagnosed and at the initial stage of therapy, 8 were on consolidation/conservation therapy, whereas 5 patients had achieved a complete remission.
Methods
Venous blood samples were collected in the morning by venous puncture from the antecubital vein of fasting subjects and immediately transferred to anticoagulated glass tubes for the evaluation of the following parameters: Whole-blood viscosity (WBV) at the shear rates of 450 and 225 s-1, by using the cone-on-plate viscometer Well-Brookfield 1/2 LVT (Middleboro, MA, USA); Plasma viscosity (PV) at the shear rate of 450 s-1, by using the cone-on-plate viscosimeter Wells-Brookfield 1/2 LVT (Middleboro, MA, USA); PV at the shear rate of 0.51 s-1 employing a viscometer Contraves LS30 (proRheo GmbH, Althengstett, Germany); PV at 0.51/ PV at 450: this value expresses the ratio between plasma viscosity measured al low shear rate and plasma viscosity measured al high shear rate. Mean erythrocyte aggregation (MEA) by using the Myrenne aggregometer MA-1(Myrenne GmbH Roetgen Germany) Haematocrit (Ht), obtained by using an automated hematology analyser Total plasma proteins expressed in g/L and evaluated using the colorimetric method WBV at 208 s–1 calculated according to the formula: (0.12xHt) +0.17(TP-2.07) Fibrinogen expressed in g/100ml and evaluated employing the Clauss method YSS calculated according to the Merrill’s formula, revised by Mishra and Dhas [19–21]: 13.5 x 10⁻⁶ x Fib2 x (Ht-6)3
Albumin (gr/dl)/Fibrinogen (mg/dl) ratio
Statistical analysis
Data were expressed as means±standard deviation. Student’s t test for unpaired data was used to compare MGUS subjects and MM patients. The correlation coefficient between mean erythrocyte aggregation (MEA) and hematocrit (Ht) was evaluated in MGUS, MM and MGUS+MM groups using the Spearman test.
Results
The principal laboratory findings of MGUS subjects were: Hb (g/dl) 11.17±1.69 (range 8.3–15.0), Ht (%) 35.17±4.61 (range 26–47), RDW (%) 15.59±2.19 (range 13.2–20.7), creatinine (mg/dl) 1.19±0.64 (range 0.53–2.95), beta2-microglobulin (μg/ml) 4.406±2.869 (range 1.50–13.50), calcium (mg/dl) 9.174±0.793 (range 8.01–11.90), albumin (g/L) 36.03±5.35 range 26.50–45.10).
The principal laboratory findings in MM patients group were: Hb (g/dl) 10.97±1.75 (range 7.6–15.0), RDW (%) 15.86±2.40 (range 13.2–22.4), creatinine (mg/dl) 1.14±0.61 (range 0.53–2.95), beta2-microglobulin (μg/ml) 4.098±2.698 (range 1.50–13.50), calcium (mg/dl) 9.153±0.741 (range 8.01–11.90), albumin (g/L) 36.41±5.16 (range 26.50–45.10), fibrinogen (mg/dl) 354.4±120.2 (range 207–817), IgG (mg/dl) 1343±1450 (range 161–5101), IgA (mg/dl) 517±1004 (range 6–3890), IgM (mg/dl) 35.1±30.3 (range 5–101), M-protein (g/dl) 1.226±1.207 (range 0–3.800).
Comparing the hemorheological determinants measured (Table 1) in the clinical conditions taken into consideration (MGUS and MM) it is observed that the blood viscosity at the shear rates of 450 s-1 and 225 s-1, as well as at the shear rate of 0.51 sec- 1 (data not shown), is higher in subjects with MGUS; while the plasma viscosity at low shear rate (0.51 s-1) and, particularly, the ratio between plasma viscosity at low (0.51 s-1) and high (450 s-1) shear rate are markedly higher in patients with MM. Between the two groups, relative to the measured erythrocyte aggregability (MEA) values, it is quite clear that the MEA is significantly reduced in patients with MM. From this evaluation, it appears evident that the reduction in hematocrit present in patients with MM affects both blood viscosity and erythrocyte aggregation (Fig. 1).
Means±S.D. of the measured hemorheological determinants in patients with MM and MGUS
Means±S.D. of the measured hemorheological determinants in patients with MM and MGUS
** p < 0.01 *** p < 0.001 vs MM (Student’s t-test). WBV = Whole-Blood Viscosity; PV = Plasma Viscosity; MEA = Mean Erythrocyte Aggregation; MM = Multiple Myeloma; MGUS = Monoclonal Gammopathy of Undetermined Significance.
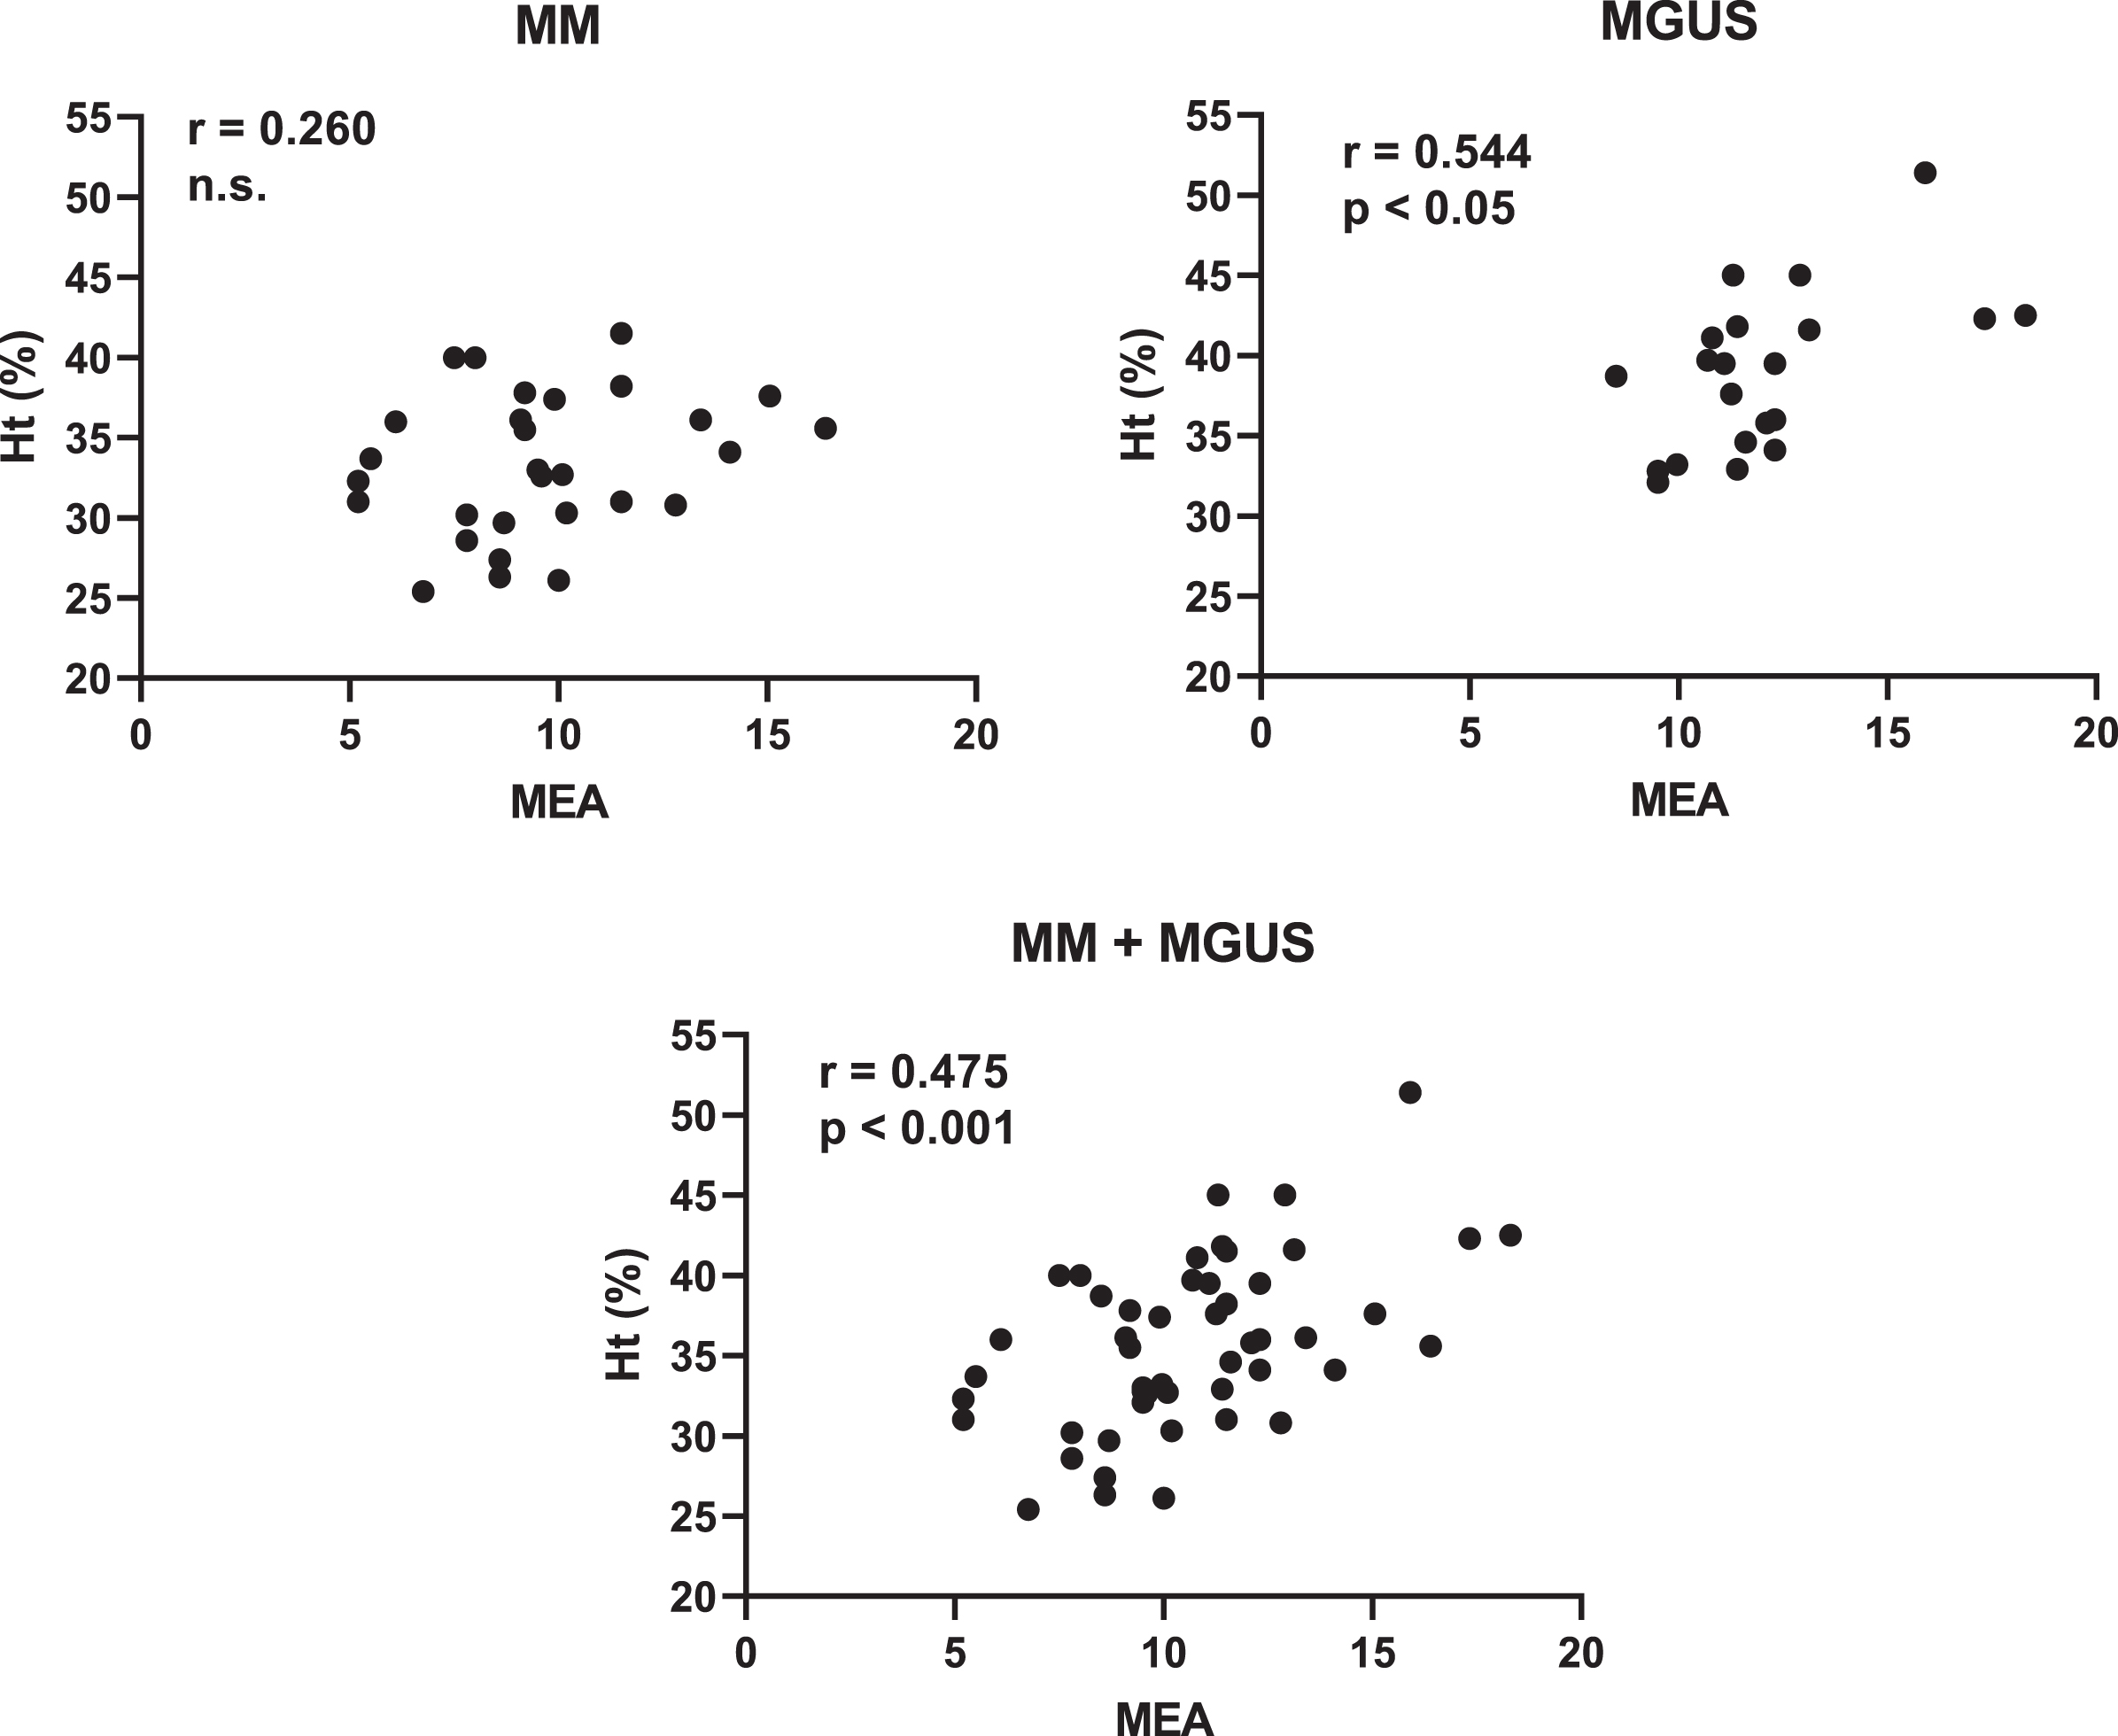
Correlations between Ht and MEA in patients with MM and MGUS. Ht = Haematocrit; MEA = Mean Erythrocyte Aggregation; MM = Multiple Myeloma; MGUS = Monoclonal Gammopathy of Undetermined Significance.
Furthermore, is interesting what emerges by calculating the blood viscosity with the use of the two different formulas (Table 2). In fact, similarly to what happens with the measured blood viscosity that calculated viscosity at the shear rate of 208 s-1 is reduced in patients with MM, while the blood viscosity calculated from the hematocrit and fibrinogen (YSS) does not distinguish the two groups. The calculated albumin/fibrinogen ratio, as a surrogate for erythrocyte aggregability, also differentiates subjects with MGUS from patients with MM, in which it is reduced.
Means±S.D. of Ht, plasma proteins and the calculated hemorheological determinants in patients with MM and MGUS
**p < 0.01. ***p < 0.001 vs MM (Student’s t-test). Ht = Haematocrit; cWBV = calculated Whole-Blood Viscosity; YSS = Yield Shear Stress calculated with Merrill’s formula; MM = Multiple Myeloma; MGUS = Monoclonal Gammopathy of Undetermined Significance.
In this re-evaluation of previously published data [29, 31] we have therefore considered at the same time some hemorheological determinants both, by measuring them and by calculating them in two clinical conditions which, despite having in common the presence of a monoclonal paraprotein and a plasma clone cellular, appear to be completely different in onset, clinical course, complications, therapeutic approach and prognosis.
In fact, MGUS is a clinically asymptomatic clonal plasm cell disorder identified in 1% to 2% of general population. The diagnostic criteria for MGUS are monoclonal immunoglobulin level < 3.0 g/dl, bone marrow plasma cells < 10%, no bone lesions, no symptoms due to plasma cell dyscrasia, no related organ or tissue impairment, preserved levels of uninvolved immunoglobulins. Immunoglobulin G (IgG) MGUS is the most common type (70% of the cases), followed by IgM (15%) and IgA (12%). MGUS population includes 2% of 50 and 3% over 70-year-old.
An ongoing follow-up ranging 25 years, has shown a development in the lymphoproliferative disease in about 40% of MGUS subjects (about 1.5% of cases/year) while a progression to myeloma multiple was observed after that the monoclonal component has been stable for 20 years.
Multiple Myeloma (MM) is a neoplasm of plasma cells that accumulate in bone marrow leading to bone destruction and marrow failure; the disease spans a clinical spectrum from asymptomatic to aggressive forms referable to deposition of abnormal immunoglobulins in different tissues. The average age of MM patients is 62 years for men (75% >70-year-old) and 61 years for women (79% > 70-year-old). In several patients there is a cluster of clinical, laboratory, radiological and pathological findings. A M-protein is found in the serum or urine in about 97% of patients (IgG 50%, IgA 20%, light chain 20%, IgD, IgE, IgM and biclonal < 10%); 3% of cases are non-secretory and in 90% of MM patients there is a decrease in polyclonal Ig (< 50 of normal). The M-component is detected and evaluated by serum and urine electrophoresis and immunofixation; furthermore, serum free light chain assay has a high sensitivity.
The measured and calculated blood viscosity is reduced in patients with MM as in the latter both the hematocrit and total protein levels are reduced by 14% and 12% respectively compared to those of subjects with MGUS. The blood viscosity calculated according to the Merrill formula [19] and used by other authors [20, 21] for the evaluation of blood viscosity in type 1 and 2 diabetics, in this study does not differentiate subjects with MGUS from patients with MM because although the mean value of the hematocrit in patients with MM is reduced, in the latter, however, the values of fibrinogen exceed on average by 30% those observed in subjects with MGUS.
From the comparison of the data concerning the erythrocyte aggregability both that measured and that calculated with the use of its surrogate, clear differences emerge between MGUS and MM. In fact, while that measured with the Myrenne MA-1 aggregometer is evidently affected by the hematocrit levels [26] observed in the group of patients with MM, the surrogate is strictly dependent on the significant increase in fibrinogen.
The plasma viscosity and in particular the ratio between that measured at low (0.51 s-1) and high (450 s-1) shear rate discriminates the two groups, although the same ratio in the two groups is not related to the plasma values of fibrinogen (data not shown). This ratio, which in subjects with MGUS has an average value of 3.71 + /–0.55, in patients with MM has an average value of 4.92 + /–1.56, while in our control group it has an average value of 2.20 + /–0.53 (data not shown). This data is in an undisputed rheological marker of the clinical disorders object of this review as plasma viscosity has an evident influence in the microcirculatory district where, with high shear rates, another important role is played by both erythrocyte deformability and platelet aggregation.
Up to now, the increase in plasma viscosity in MM patients has almost always been called into question for the microvascular complications that are those affecting the retina, kidney, skin, central and peripheral nerves and lung, which characterize the course of these patients. As it is known, plasma viscosity has remarkable intra-individual stability [32], even if it changes in several clinical conditions; plasma is considered a Newtonian fluid but when plasma viscosity is measured employing rotational viscometers at various shear rates, an apparent non-Newtonian behaviour emerges [33].
In this study, MM patients show a different trend in low shear rate plasma viscosity in comparison with MGUS subjects, but this finding must be put in the context of the technical condition in which they were acquired. In the two groups (MGUS and MM) none showed the clinical symptoms of a hyperviscosity syndrome although the PV increase seems to be an independent hemorheological risk factor for several cardiovascular diseases [34].
In conclusion, from this re-evaluation of the hemorheological data observed in these two plasma cell disorders seems reasonable point out that the calculated whole blood viscosity and the surrogate of erythrocyte aggregation (albumin/fibrinogen level) show a parallel trend with the same hemorheological determinants obtained employing their direct measurement.
Footnotes
Acknowledgments
This research did not receive any specific grant from funding agencies in the public, commercial, or not-for-profit sectors.
Conflict of interest
None.