
Abstract
In vivo endothelialization of polymer-based cardiovascular implant materials is a promising strategy to reduce the risk of platelet adherence and the subsequent thrombus formation and implant failure. However, endothelial cells from elderly patients are likely to exhibit a senescent phenotype that may counteract endothelialization. The senescence status of cells should therefore be investigated prior to implantation of devices designed to be integrated in the blood vessel wall. Here, human umbilical vein endothelial cells (HUVEC) were cultivated up to passage (P) 4, 10 and 26/27 to determine the population doubling time and the senescence status by four different methods. Determination of the senescence-associated β-galactosidase activity (SA-β-Gal) was carried out by colorimetric staining and microscopy (i), as well as by photometric quantification (ii), and the expression of senescence-associated nuclear proteins p16 and p21 as well as the proliferation marker Ki67 was assessed by immunostaining (iii), and by flow cytometry (iv). The population doubling time of P27-cells was remarkably greater (103±65 h) compared to P4-cells (24±3 h) and P10-cell (37±15 h). Among the four different methods tested, the photometric SA-β-Gal activity assay and the flow cytometric determination of p16 and Ki67 were most effective in discriminating P27-cells from P4- and P10-cells. These methods combined with functional endothelial cell analyses might aid predictions on the performance of implant endothelialization in vivo.
Keywords
Introduction
Endothelialization of polymer-based cardiovascular implants is a promising strategy to improve long term function of cardiovascular implants by reducing the risk of thromboembolic complications [1–4]. This can be achieved either in vivo by using implant materials that attract endothelial cells (EC) [5–7] or the patient’s own EC / endothelial precursor cells are isolated and seeded onto implants ex vivo prior to implantation [8–11]. Though ex vivo endothelialized implants led to promising results in dogs [12], first studies in humans showed contradictory findings and demonstrated that results gained from animal studies cannot be directly related to humans [13, 14]. In contrast to animals used for pre-clinical studies, patients requiring cardiovascular grafts are typically of advanced age (> 70 years, [15]). Thus, it is likely, that endothelial cells (EC) from these patients exhibit signs of senescence, which could impair both in vivo and ex vivo endothelialization strategies of implants.
The term senescence, particularly replicative senescence, was first introduced in the early 1960s by Hayflick and Moorhead, who found that human diploid cell strains stop dividing after a certain number of serial passaging in culture [16]. In 1981, Rosen et al. described senescent endothelial cells as cells of increased cell area, cell volume and protein content [17]. Today, senescent cells are characterized by a large size and a flat morphology as well as reduced proliferation potential, enlarged vacuoles, multiple cell nuclei, upregulated tumor suppressor genes, a pro-inflammatory phenotype, and the release of von Willebrand factor [18–20] (Fig. 1). For a long time, senescence was considered as an in vitro phenomenon due to serial cell passaging. Nowadays, several studies indicate that cellular senescence also exists in vivo where it might be a likely contributor to ageing and diseases including atherosclerosis and cancer [21–25]. In vitro studies confirmed that senescence, apart from serial passaging, can be induced within a few days in low passage cells by stimuli that accompany ageing and the development of diseases in vivo. These stimuli, leading to so-called pre-mature senescent cells, comprise ionizing radiation, reactive oxygen species and pro-inflammatory molecules among others [26]. With regard to autologous endothelialization approaches of cardiovascular grafts, which requires proliferative and functional cells, it is essential to exclude that patient-derived ECs are senescent. Otherwise, rapid implant stenosis or occlusion might be the consequence.
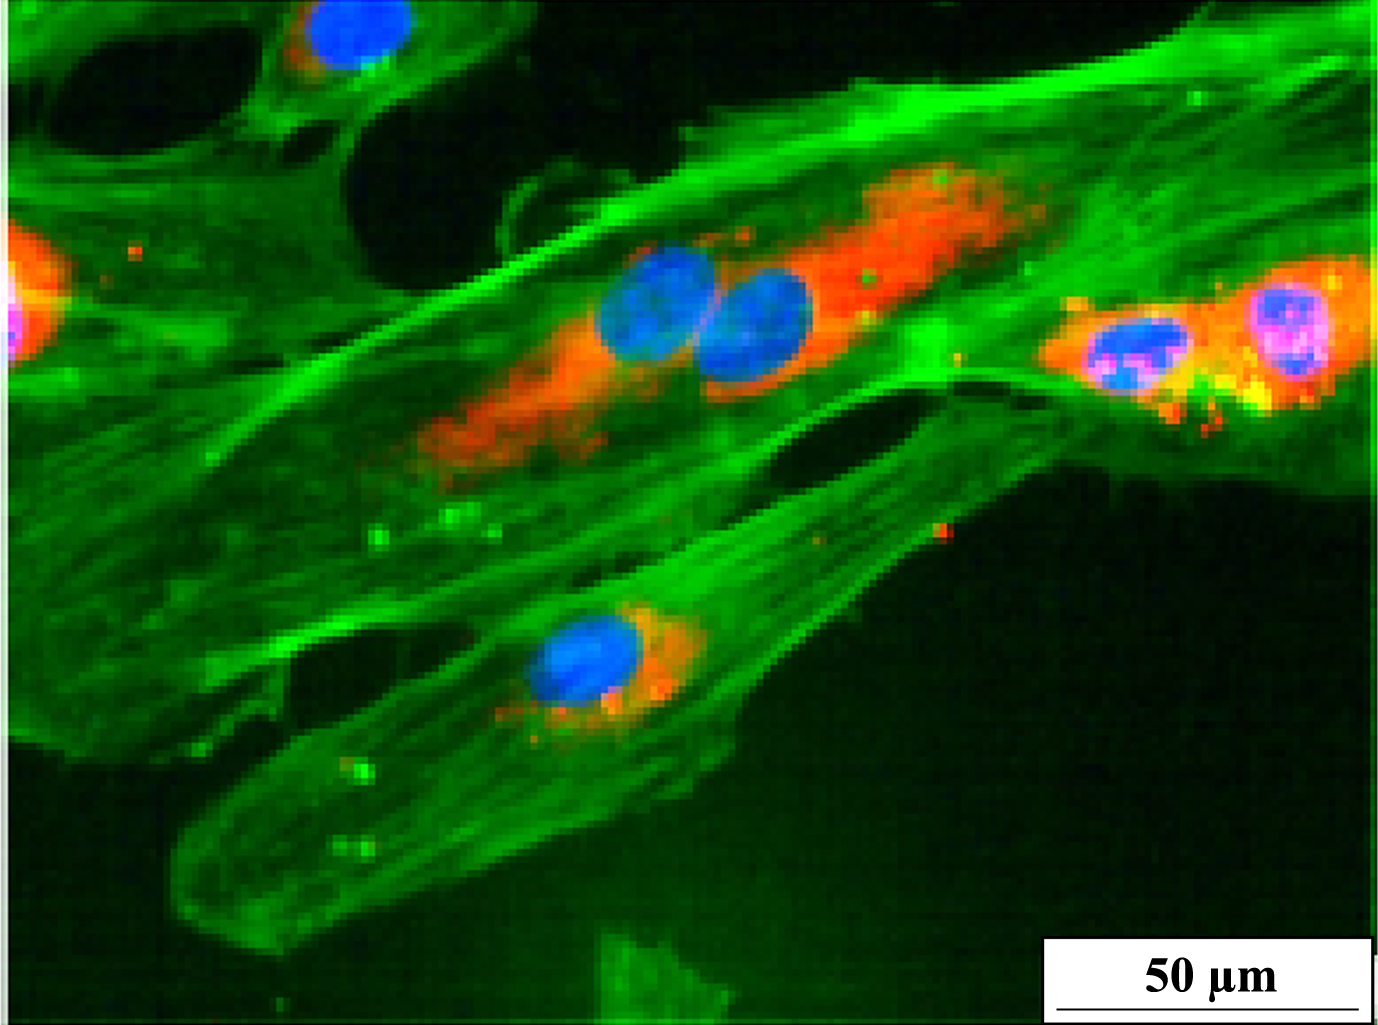
Typical example of senescent endothelial cells. HUVEC are with more than 100μm very large and flat; some have already partly released von Willebrand factor (in red) and show signs of stress (actin stress fibers in central parts of the HUVEC in green) and frustran replication (cell with two nuclei). Scale bar represents 50μm.
Different commercially available assays are used to address the status of senescence. However, none of these is an accepted stand-alone assay leading to unambiguous results. One of the most frequently used assays is based on the senescence-associated β-Galactosidase (SA-β-Gal) activity - a lysosomal enzyme that is ubiquitously present in all cells at pH 4.0. In 1995, Dimri et al. first detected SA-β-Gal in senescent cells at pH 6.0 but not in quiescent or terminally differentiated cells suggesting SA-β-Gal to be a unique marker for senescence [27]. Today, it is known that SA-β-Gal at pH 6.0 also exists in some terminally differentiated cells such as melanocytes and confluent cells are likewise able to express this enzyme. The assay is based on the enzymatic conversion of 5-bromo-4-chloro-3-indoyl β-D-galactopyranoside (X-gal) into an insoluble blue dye staining cells in situ. This assay is quick and easy to perform, however, the blue staining intensity varies from cell to cell making the analysis user-dependent and thus subjective and prone to errors [28]. Moreover, the percentage of positively stained cells is semi-quantitative and may be a reflection of the choice of microscopic fields [29]. To circumvent this issue, another assay quantifies the SA-β-Gal activity in cell lysates. In addition, the amount of SA-β-Gal is normalized to the amount of intracellular proteins to compensate for differences in cell numbers that naturally occur during the seeding procedure [28]. This method is quicker than the staining method but also dependent on the cell density and, from a practical point of view, on the complete cell lysis in all samples. Apart from the SA-β-Gal activity, there are also other markers for senescence such as the presence of cell cycle inhibitors p16 and p21, which arrest the cell cycle by preventing G1/S progression (reviewed in [30]). Moreover, the proliferation marker Ki67 is often used as an indirect senescence marker [31]. However, the specificity of these markers, especially p21 and Ki67, has been called in question [22, 32]. With regard to endothelialization strategies, the present study aimed at comparing the markers SA-β-Gal, p16, p21 and Ki67 to investigate their potential to reliably identify senescent endothelial cells in vitro.
Cell culture
Human umbilical vein endothelial cells (HUVEC, Lonza, Cologne, Germany) were cultivated under standard conditions at 37 °C and 5% (v/v) CO2 until passage (P) 4, P10 and P26 or 27, which was the maximal number of passages reached under the conditions described below.
Cell proliferation assay
HUVEC were seeded with a cell density of 10,000 cells per well in 6-well plates (TPP, Techno Plastic Products AG, Trasadingen, Switzerland) and cultivated for 4 days with daily counting of the cell number. The endothelial cell culture medium supplemented with 5% (v/v) fetal bovine serum (Upcyte technologies GmbH, Hamburg, Germany) was not changed over the test duration. The population doubling time (td) was calculated based on the following equations whereas μ represents the growth rate, N represents the number of vital cells at harvest, N0 represents the number of seeded cells, t represents the time at harvest, and t0 represents the time at cell seeding:
Semi-quantitative determination of the β-Galactosidase activity
In order to semi-quantitatively assess the senescence-associated β-Gal activity, the Senescence β-Galactosidase Staining Kit (Cell Signaling Technology, Frankfurt am Main, Germany) was used according to the manufacturer’s instructions. Briefly, HUVEC were seeded on glass coverslips (Th. Geyer GmbH, Hamburg, Germany) placed in 24-well plates with a cell density of 15,000 cells per well. After 3 days of cultivation with endothelial cell culture medium supplemented with 5% (v/v) fetal bovine serum (Upcyte technologies GmbH), cells were fixed with fixative solution and incubated overnight at 37 °C in staining solution containing a substrate for SA-β-Gal. Cell nuclei were stained using 4′,6-diamidino-2-phenylindole (DAPI, Roth, Karlsruhe, Germany, 1:50) to detect all cells for a semi-quantitative evaluation. Five images were taken per well in 10-fold primary magnification (Axio Imager.Z2m, Zeiss, Oberkochen, Germany) for analysis and the fraction of SA-β-Gal-positive cells was expressed as percent of the total cell number [sample size n = 45 (three independent experiments with three wells per passage and five images per well)].
Quantification of the β-Galactosidase activity
The senescence-associated β-Gal activity was quantified using the Cellular Senescence Activity Assay (Enzo Life Sciences, Lörrach, Germany) according to the manufacturer’s instructions. Briefly, HUVEC were seeded in 24-well plates (TPP) with a cell density of 15,000 cells per well. After 3 days of cultivation with endothelial cell culture medium supplemented with 5% (v/v) fetal bovine serum (Upcyte technologies GmbH), cells were lysed and the cell lysate was incubated with a fluorometric substrate for SA-β-Gal. After 1 h incubation at 37 °C, the activity of SA-β-Gal was measured at 360 nm (Excitation) and 465 nm (Emission) using a microplate reader (Tecan infinite M200 pro, Crailsheim, Germany). To compensate for differences in cell numbers between wells, the amount of SA-β-Gal was normalized to the amount of protein per well. For this, the Pierce™ BCA Protein Assay Kit (Thermo Fisher Scientific, Berlin, Germany) was used according to the manufacturer’s instructions. Briefly, 10μL of bovine serum albumin standard or sample was added per well to a 96-well plate (Greiner Bio One, Leipzig, Germany). BCA Reagents A and B were mixed in a ratio of 50:1 and 200μL of this mixture was added per well. After 30 min incubation at 37 °C the absorbance was measured at 562 nm using a microplate reader (Tecan infinite M200 pro, Crailsheim, Germany). Protein concentrations per well were calculated based on a standard curve and used for normalization of the SA-β-Gal activity [sample size n = 27 (three independent experiments with three wells per passage measured in triplicates)].
Fluorescence staining of p16INK4A, p21 and Ki67
To visualize senescence markers p16INK4A (hereinafter called p16) and p21 as well as the proliferation marker Ki67, immunocytological stainings were performed. Briefly, HUVEC were seeded on glass coverslips (Th. Geyer GmbH, Hamburg, Germany) placed in 24-well plates with a cell density of 15,000 cells per well. After 3 days of cultivation with endothelial cell culture medium supplemented with 5% (v/v) fetal bovine serum (Upcyte technologies GmbH) HUVEC were fixed with 4% (w/v) paraformaldehyde (Sigma-Aldrich, Taufkirchen, Germany) for 30 min prior to heat-induced epitope retrieval. For this, cells were cooked in 10 mM tri-sodium citrate buffer (pH 6, Sigma-Aldrich) containing 0.05% (v/v) Tween-20 (Sigma-Aldrich) for 15–20 min. After that, cells were rinsed with PBS for 5 min, permeabilized using 0.5% (v/v) Triton-X-100 for 10 min (Sigma-Aldrich, Taufkirchen, Germany) and unspecific binding sites were blocked with 5% (w/v) bovine serum albumin (Roth, Karlsruhe, Germany) for 20 min at room temperature. As primary antibodies mouse anti-human p16 (Abcam, Cambridge, United Kingdom, ab54210, 1:500), rabbit anti-human p21 (Abcam, Cambridge, United Kingdom, ab109520, 1:1000) and rat anti-human Ki67 (Thermo Fisher Scientific, Berlin, Germany, 14-5698-82, 1:200) were incubated for 1 h at room temperature. After three washing steps with phosphate buffered saline (Thermo Fisher Scientific, Berlin, Germany) cells were incubated with the secondary antibodies (goat anti-mouse IgG conjugated to Alexa Fluor 647, Abcam, Cambridge, United Kingdom, 1:200, for p16; donkey anti-rabbit IgG conjugated to DyLight 550, Thermo Fisher Scientific, Berlin, Germany, SA5-10039, 1:500, for p21; goat anti-rat IgG conjugated to Alexa Fluor 488, Thermo Fisher Scientific, Berlin, Germany, 1:200, for Ki67) for 1 h at room temperature in the dark. Finally, cells were washed and covered with ROTI®Mount FluorCare as mounting medium containing DAPI to counterstain cell nuclei. For qualitative visualization of the cellular localization of the proteins, images were taken in a 63-fold primary magnification (confocal laser scanning microscope DMi8, Leica, Wetzlar, Germany).
Flow cytometric quantification of p16 INK4A, p21 and Ki67
To quantify the expression of the senescent markers p16 and p21 as well as the proliferation marker Ki67, flow cytometric analyses were performed in a separate set of experiments. For this, cells were cultivated up to P4, P10 and P26 with endothelial cell growth medium (EGM-2 Bullet Kit including all supplements, Lonza) prior to the detachment from cell culture flasks using 0.25% (v/v) trypsin/0.02% (v/v) EDTA (PAN Biotech, Aidenbach, Germany) and filtering through 70μm cell strainers (Miltenyi Biotech) to prevent needle clogging. Cells were fixed and permeabilized using the Cell Signaling Buffer Set A (Miltenyi Biotech, Bergisch Gladbach, Germany) according to the manufacturer’s instructions and suspended in PBS containing 0.5% (v/v) bovine serum albumin (Roth) and 2 mM EDTA (Biozol, Eching, Germany). Cells were stained with antibodies detecting p16 (Miltenyi Biotech, APC-conjugated, 130-116-138, 1:50), p21 (R&D, Abingdon, UK, Alexa Fluor 405-conjugated, IC1047V, 1:100) and Ki67 (Miltenyi Biotech, FITC-conjugated, 130-117-691, 1:50) for 30 min in the dark at room temperature. After washing with PBS, DAPI was added (Roth, 0.1μg/mL) to allow dead cell exclusion prior to flow cytometric analysis using a MACS Quant Analyzer 10 (Miltenyi Biotech).
Statistics
Statistical analyses were performed using Graphpad Prism 6 (Graphpad Software, San Diego, California). Gaussian distribution of the data was tested using the d’Agostino & Pearson omnibus normality test. Data are reported as arithmetic mean±standard deviation. Comparisons between multiple groups were performed by one-way or two-way ANOVA and Tukey’s multiple comparisons test for parametric data or by Kruskal-Wallis test and Dunn’s posttest for non-parametric data. Differences were considered significant at p≤0.05. *: p≤0.05; **: p≤0.01; ***: p≤0.001; #: p≤0.0001.
Results
HUVEC of P4 rapidly developed the typical cobblestone-like morphology of mature EC and reached confluence at 2 to 3 days after seeding (Fig. 2a-d). Cells of P10 exhibited a similar morphology. However, the formation of a confluent monolayer took up to 4 days (Fig. 2e-h). In contrast, cells at P27 differed in morphology and displayed either a spindle-like shape or the typical enlarged and flattened “fried-egg” structure of senescent cells (Fig. 2i-m, indicated by black and white arrows). These cells did not reach confluence after 4 days.
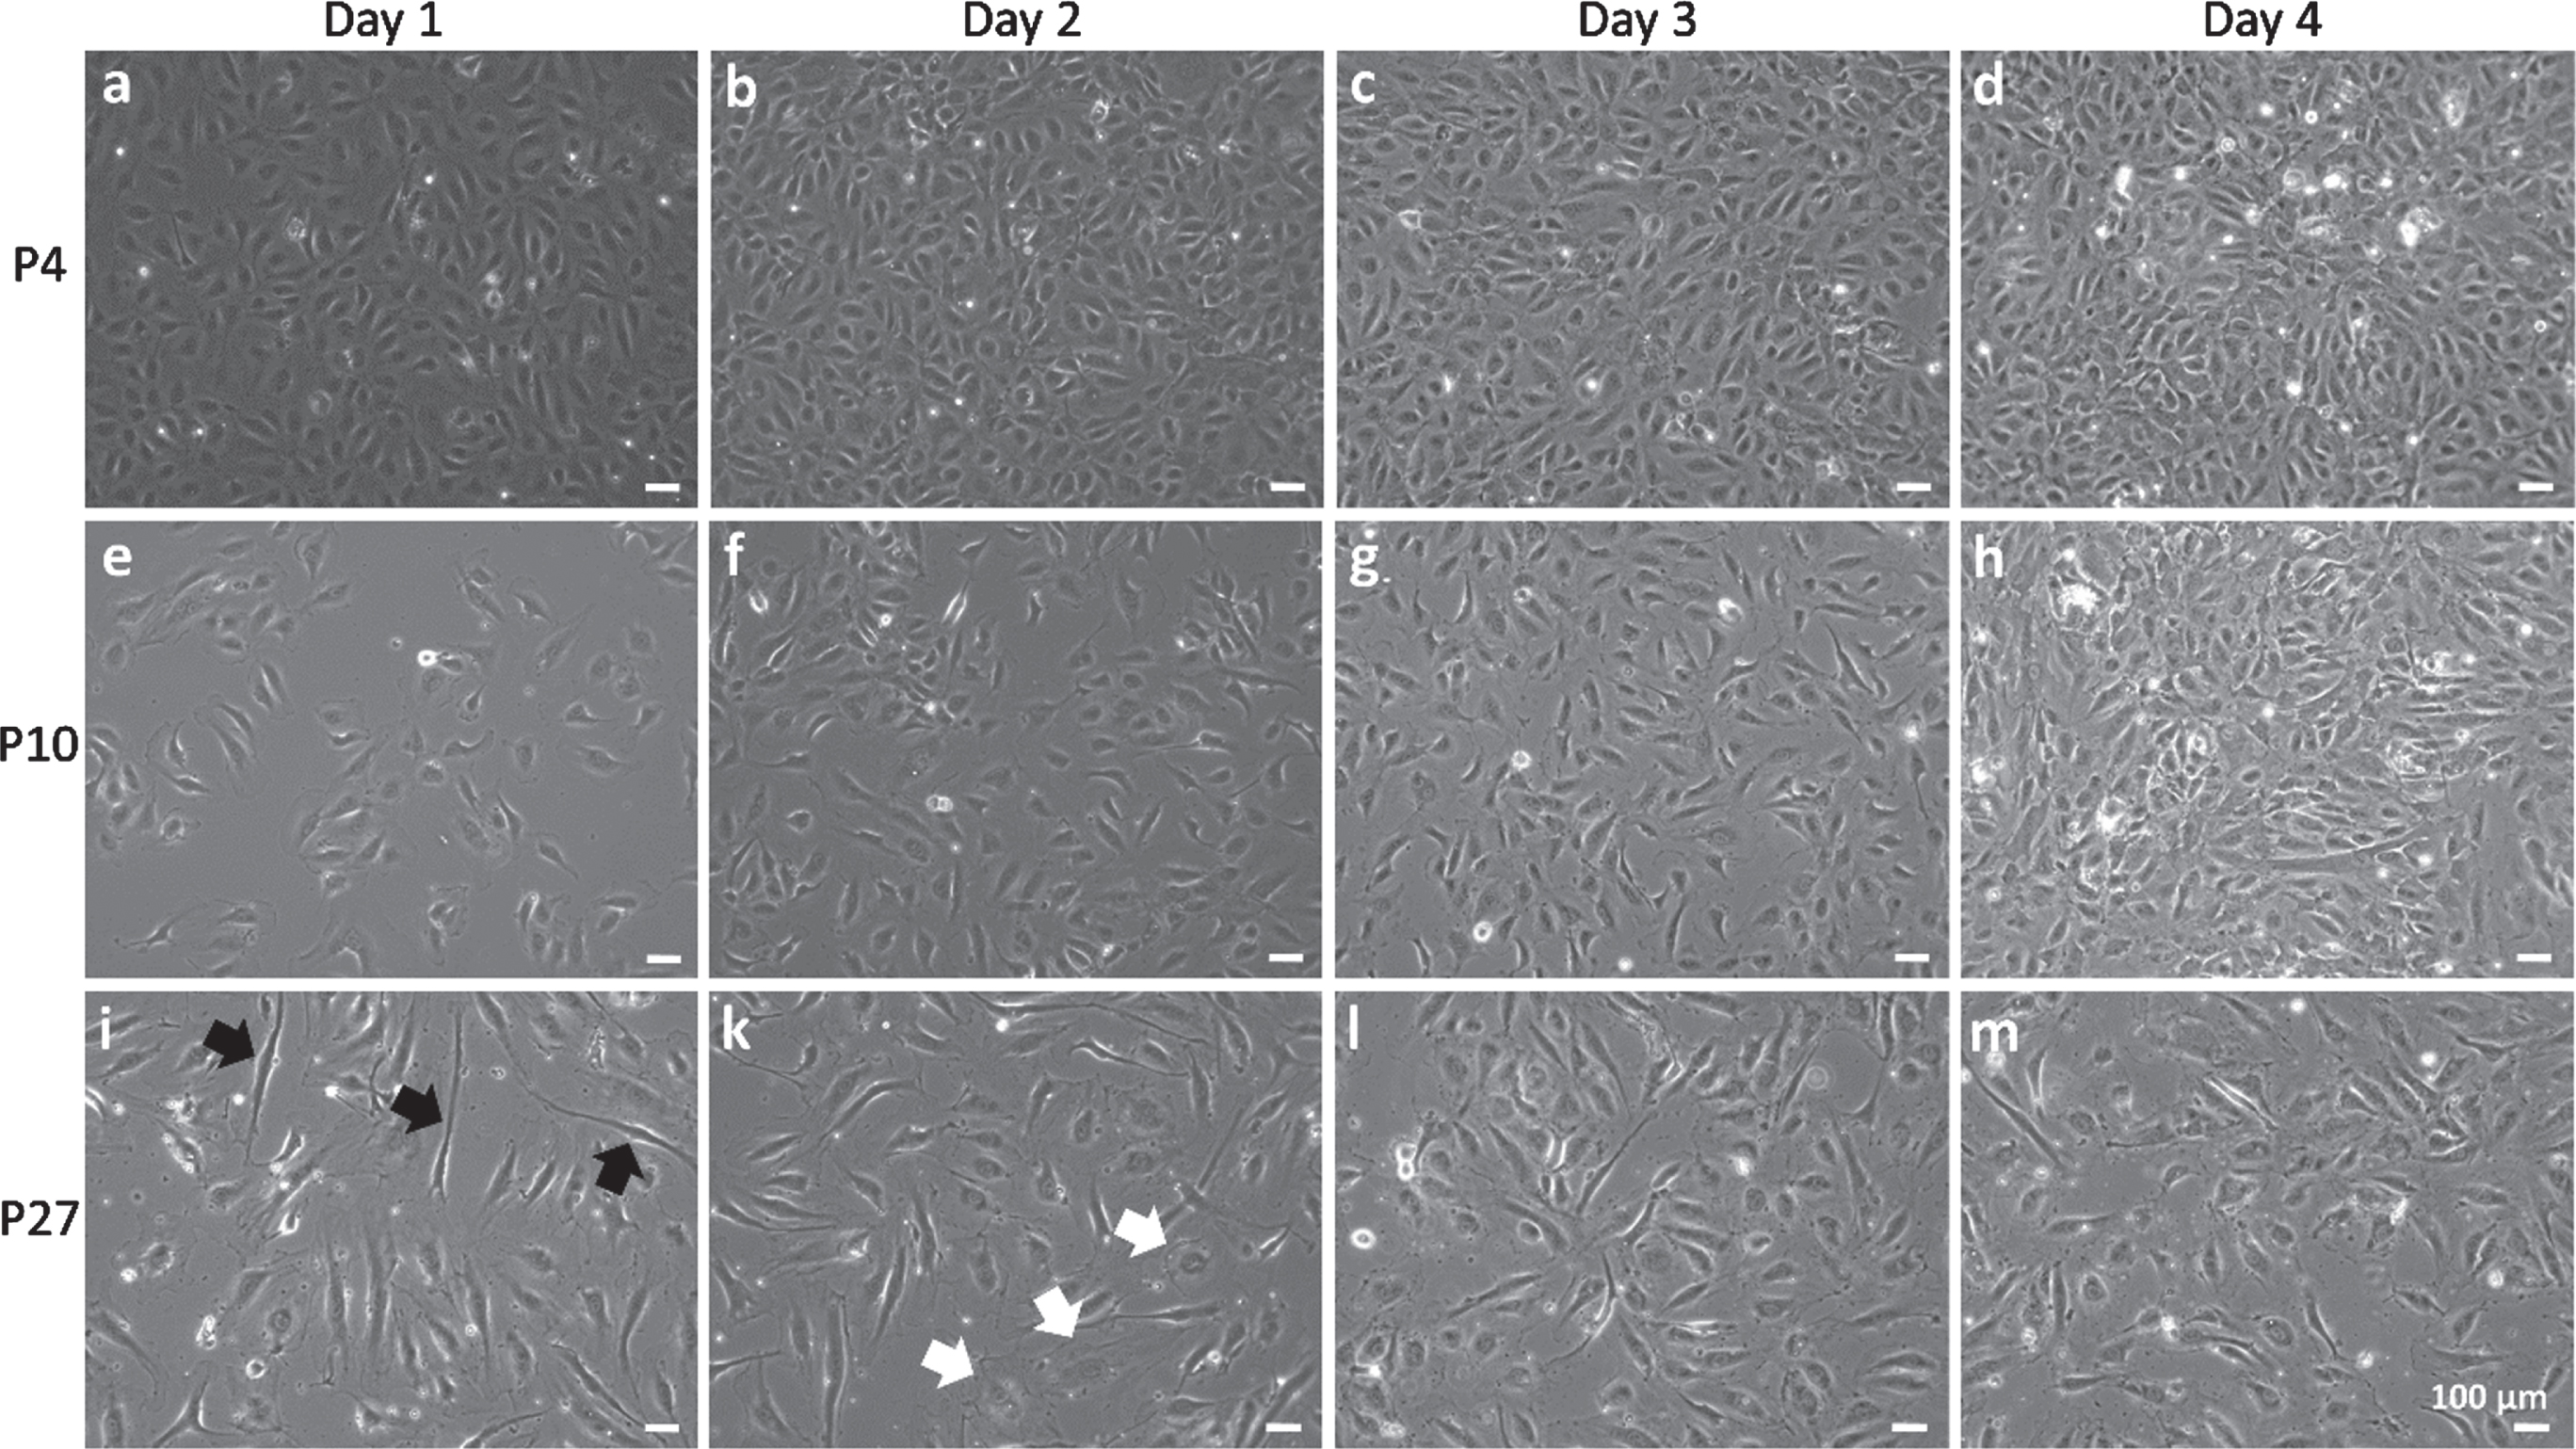
Proliferation and morphology of human umbilical vein endothelial cells (HUVEC). HUVEC of passage (P) 4 (a-d), P10 (e-h) and P27 (i-m) were monitored over four days of cultivation by phase contrast microscopy in three independent experiments with three replicates per experiment. Examples of senescent cells are indicated by black arrows (splindle-like shape) or white arrows (“fried egg” morphology). Scale bars represent 100μm.
In addition to the number of passage as a descriptor for the in vitro cell age, the population doubling time can be considered. For this, proliferation of cells of passage 4, 10 and 27 was observed over 4 days in order to create a growth curve (Fig. 3). The velocity of cell proliferation clearly decreased with increasing passage number. Differences between cells of different passages became apparent at day 2 (P10 vs. P27: p = 0.0058) and increased at day 3 and 4 (P4 and P10 vs. P27: p < 0.0001). Consequently, the population doubling times increased with higher cell passages. In particular, cells of P27 exhibited a 4.1-fold higher population doubling time than cells in P4 and a 2.6-fold higher population doubling time compared to cells in P10 (Table 1).
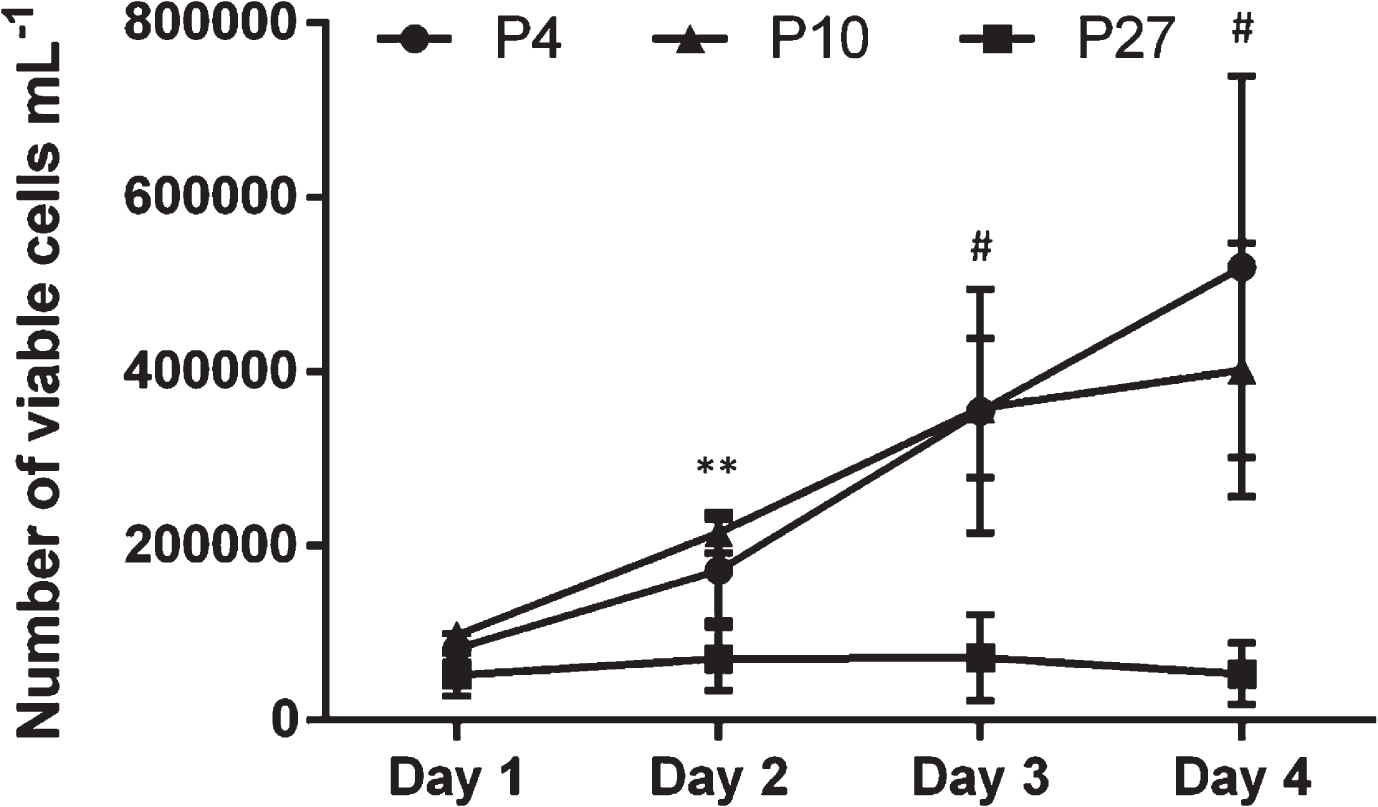
Growth curve of human umbilical vein endothelial cells (HUVEC). HUVEC of passage (P) 4, P10 and P27 were cultivated for 4 days whereas the number of viable cells was counted daily. Data represent the arithmetic mean±standard deviation of three independent experiments with three replicates per experiment. ** indicates a statistically significant difference between cells of P10 and P27 (p = 0.0058), # indicates a statistically significant difference between cells of P4 and P27 as well as between cells of P10 and P27 (p < 0.0001).
Population doubling time of human umbilical vein endothelial cells (HUVEC)
HUVEC of passage (P) 4, P10 and P27 were cultivated for 4 days while counting the number of viable cells daily to determine the population doubling time. Data represent the arithmetic mean±standard deviation of three independent experiments with three replicates per experiment.
One of the most widely used assays for the determination of the senescence status relies on the visualization of the SA-β-Gal activity through conversion of a substrate into a blue product and the subsequent microscopy and counting of blue cells. Here, this type of assay detected a small but significantly higher SA-β-Gal activity in cells of P27 compared to cells of P4 (1.3-fold; p = 0.0317). No difference was detected between all other passages (Fig. 4A). Representative images of SA-β-Gal-expressing cells are shown in the supplementary Figure S1. In contrast, the photometric quantification of the SA-β-Gal activity identified a higher SA-β-Gal activity not only in cells of P27 compared to cells of P4 (1.5-fold; p = 0.0004) but also a slightly higher activity in cells of P27 compared to cells of P10 (1.1-fold; p = 0.0068). Though these differences were relatively small, this indicates that the photometric is more sensitive than the microscopic method. Moreover, the scattering of data points was considerably smaller with the photometric method than with the microscopic method indicating that results obtained by the photometric method are more reliable (Fig. 4B).
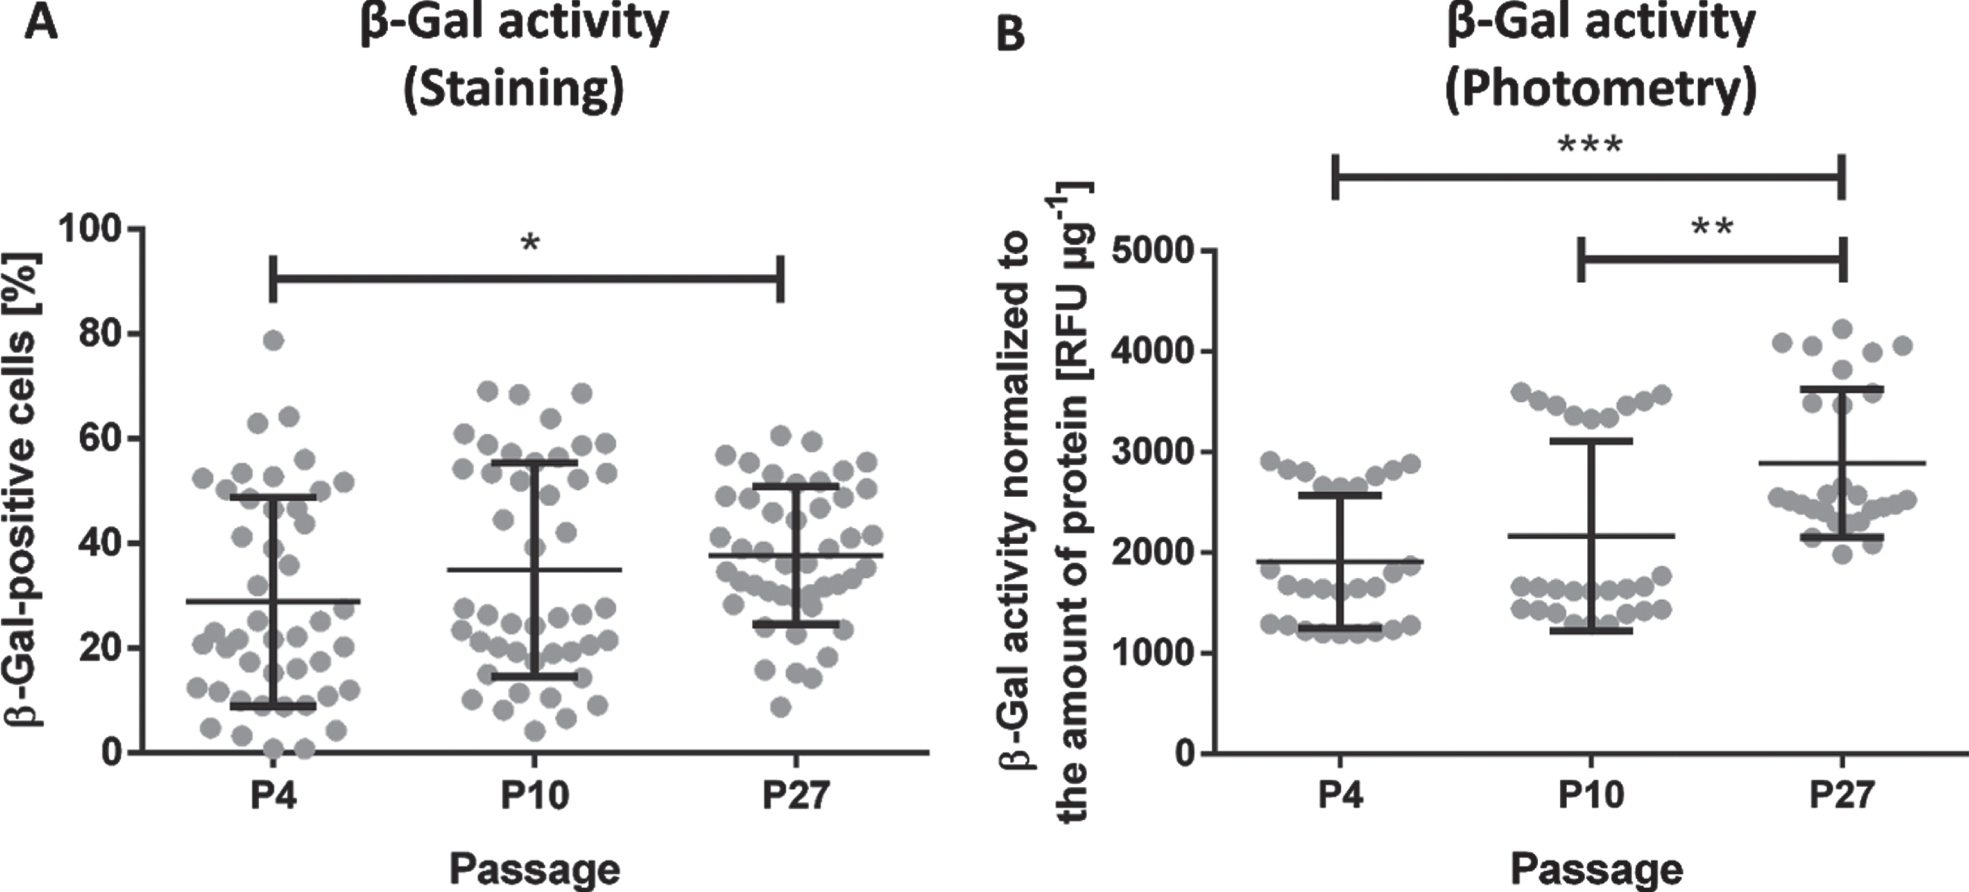
Quantification of the SA-β-Galactosidase (SA-β-Gal) activity in human umbilical vein endothelial cells (HUVEC). HUVEC of passage (P) 4, P10 and P27 were cultivated for 3 days prior to the analysis of the SA-β-Gal activity assessed via staining (A) or photometric measurement (B). Data represent the arithmetic mean±standard deviation of three independent experiments with 3 wells per passage whereas 5 images per well were taken to analyze the SA-β-Gal activity via staining and triplicates were measured for the photometric analysis. Black lines with * indicate significant differences with p≤0.0317.
Apart from the SA-β-Gal activity, cell cycle inhibitors such as p16 and p21 as well as proliferation markers like Ki67 are widely used senescence markers. Here, immunofluorescence staining followed by confocal laser scan microscopy was used to reveal the cellular localization of each protein. All three markers are expressed in the cell nucleus. Interestingly, p16 was expressed in the majority of cell nuclei in cells of P4, and also to some extent in the cytoplasm, in the form of numerous small dots. These dots seemed to condensate with increasing cell passage until fewer, but thicker dots appeared in cells of P27 (Fig. 5b, 5f, 5k). P21 was equally detected in cells of all passages showing a uniform distribution, unlike p16, across the whole cell nucleus (Fig. 5c, 5g, 5l). The proliferation marker Ki67 was expressed in most of the cell nuclei of cells in passage 4 as indicated by small dots that are characteristic for this marker. Cells of P10 and P27 exhibited less Ki67-positive cells (Fig. 5d, 5h, 5m). It is noticeable that Ki67 seemed to be localized at the same positions like p16, which is particularly visible in cells of P27. Merged images showing p16 and Ki67 can be found in the supplementary Figure S2.
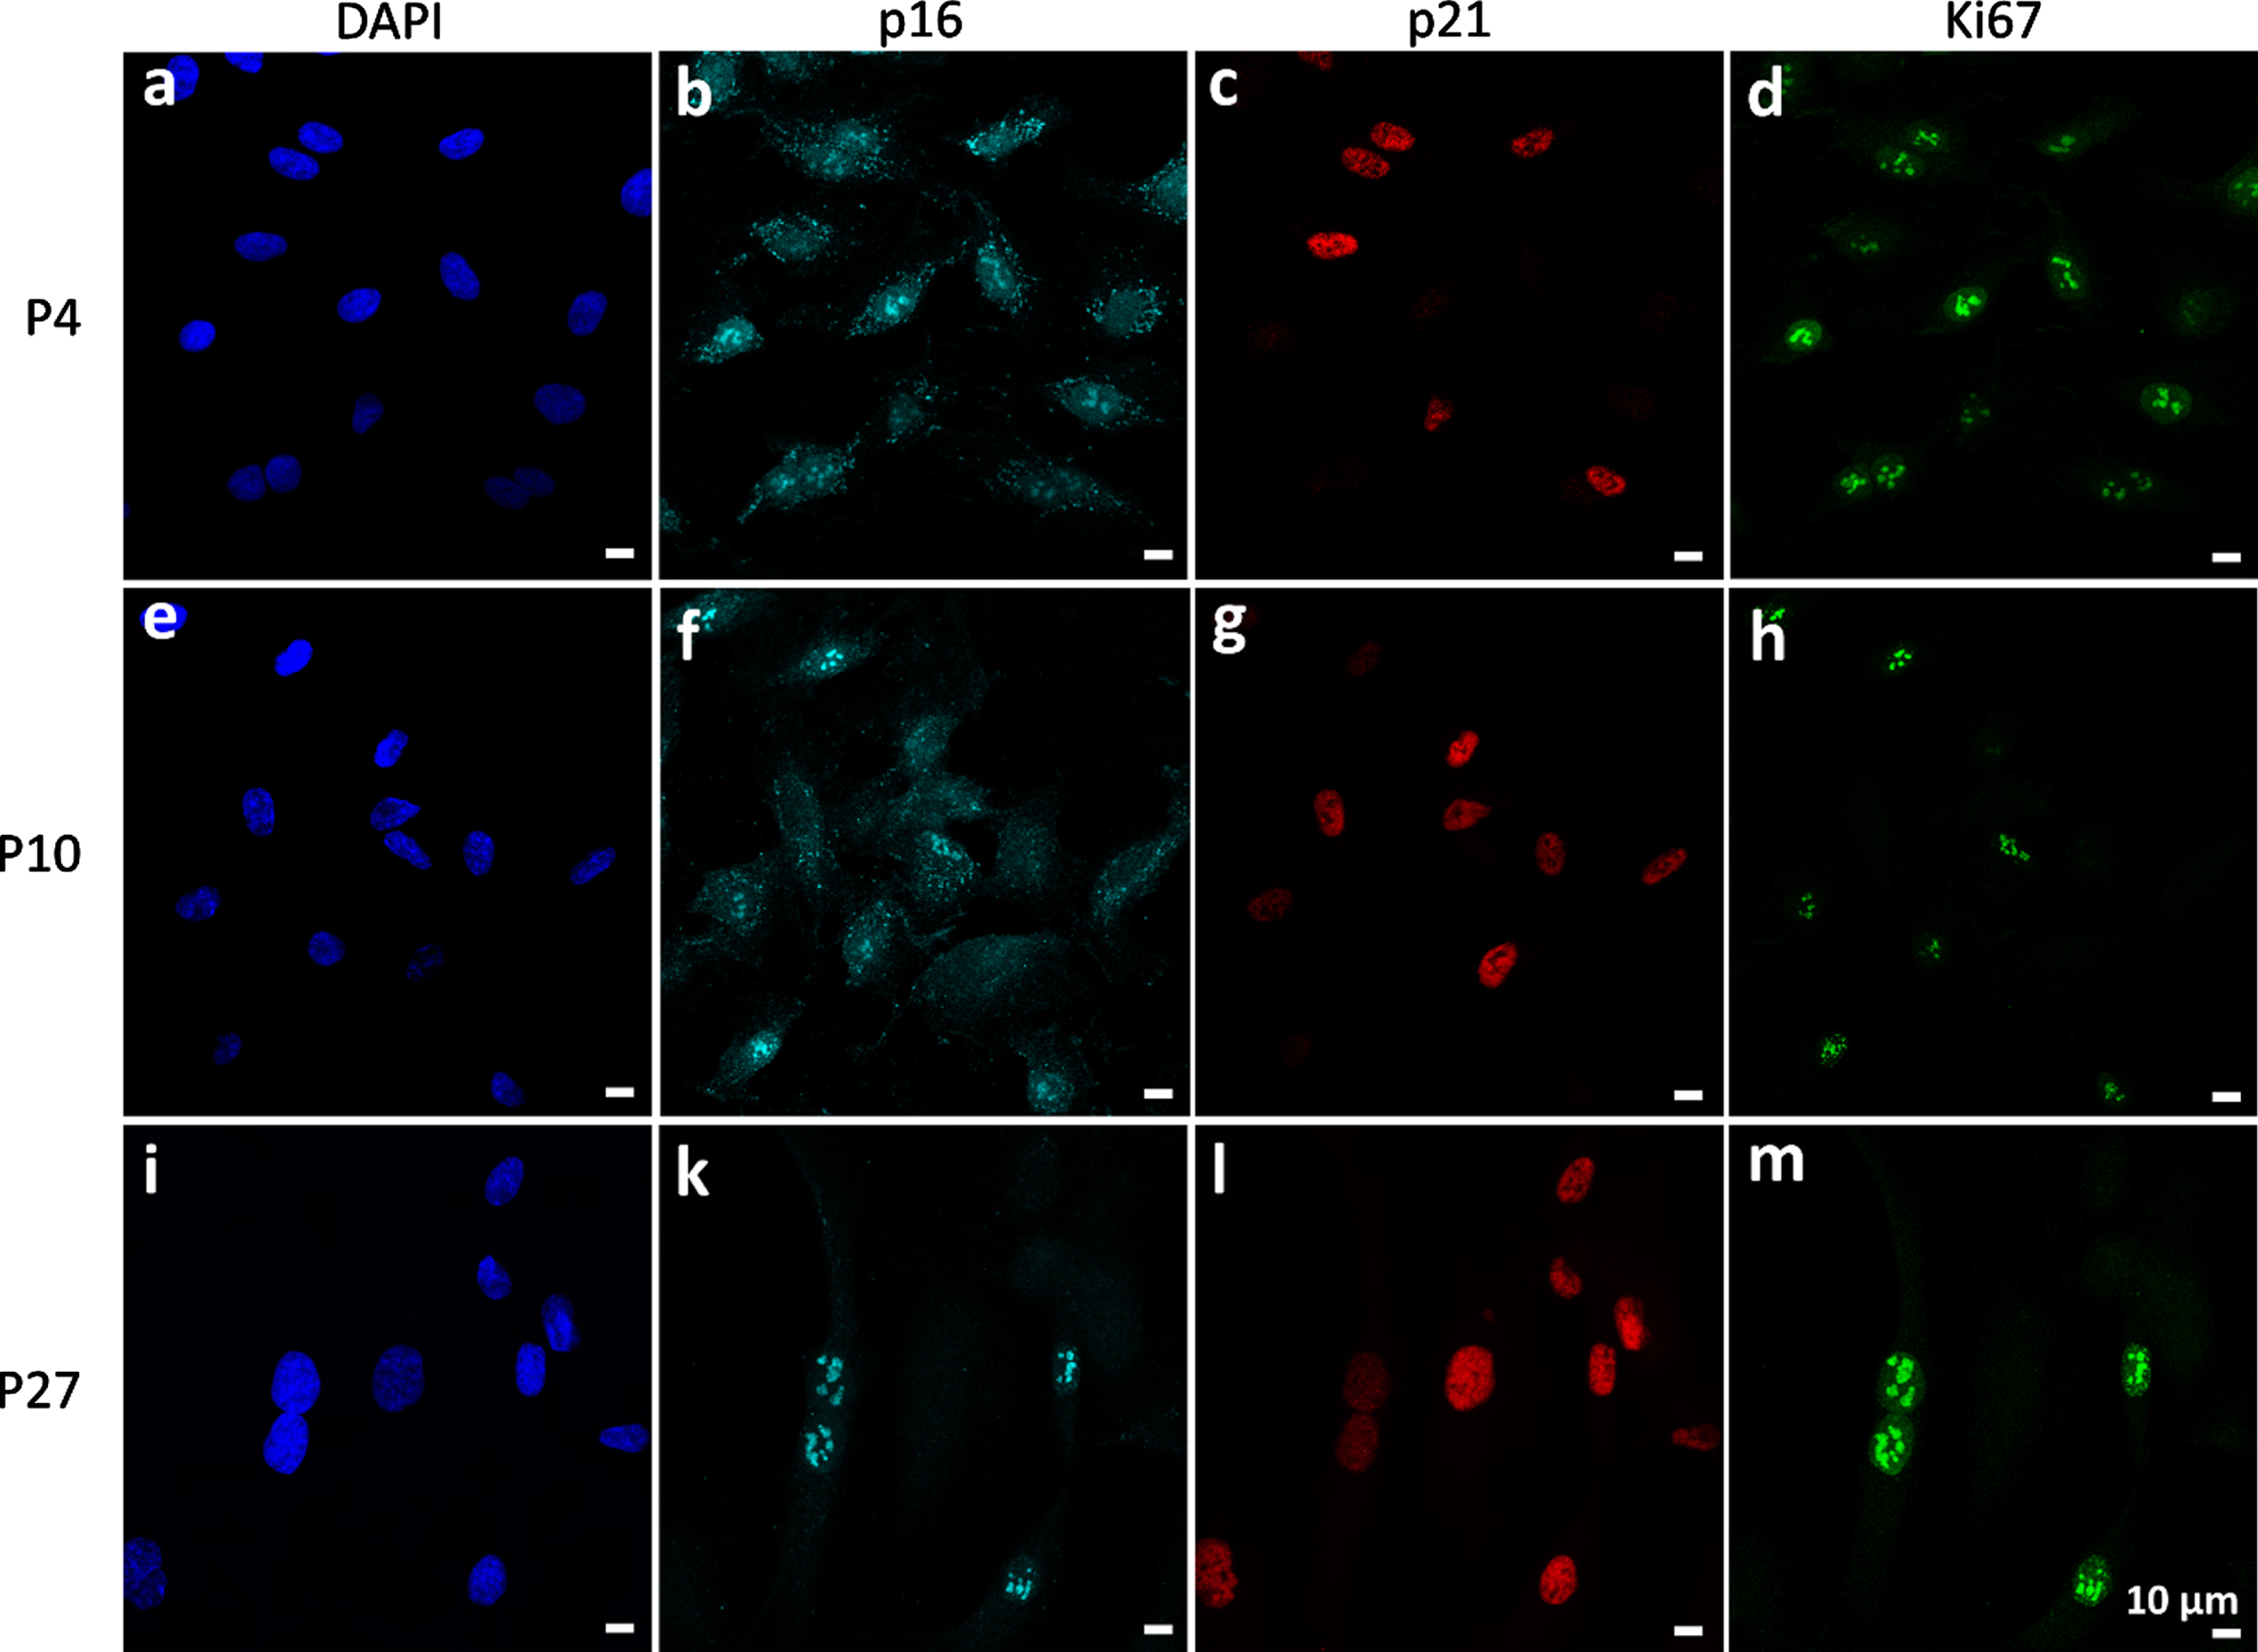
Localization of p16, p21 and Ki67 in human umbilical vein endothelial cells (HUVEC). HUVEC of passage (P) 4, P10 and P27 were cultivated for 3 days prior to the immunostaining of the senescence markers p16 and p21 as well as the proliferation marker Ki67 followed by confocal laser scan microscopy. Representative images from three independent experiments with three replicates per experiment are shown. Scale bars represent 10μm.
To quantify the expression of p16, p21 and Ki67 in HUVEC of different passages, flow cytometry was performed in a separate set of experiments. The antibodies used were different from those for the immunostainings, as the latter were not recommended for flow cytometry by the supplier. In contrast to the immunostaining data, flow cytometry revealed that p16 is absent in P4-cells, marginally present in P10-cells (2±1%) and clearly present in most of P26-cells (83±2%; Fig. 6A and D). In accordance with the immunostaining, p21 was equally expressed in the majority of cells of all passages (P4:100±0%; P10:99±0%; P27:83±6%; Fig. 6B and D). Ki67 was expressed in most cells of passage 4 (67±20%) and 10 (70±15%) but only in few cells of P26 (2±2%; Fig. 6C and D), which is similar to the findings obtained by the immunostaining. Thus, flow cytometric quantification of senescence markers revealed that HUVEC of P4 and P26 as well as of P10 and P26 can be distinguished by the fraction of cells expressing p16 and Ki67 while the expression of p21 remained constant in cells of all passages and thus did not aid to the discrimination of cells of different passages.
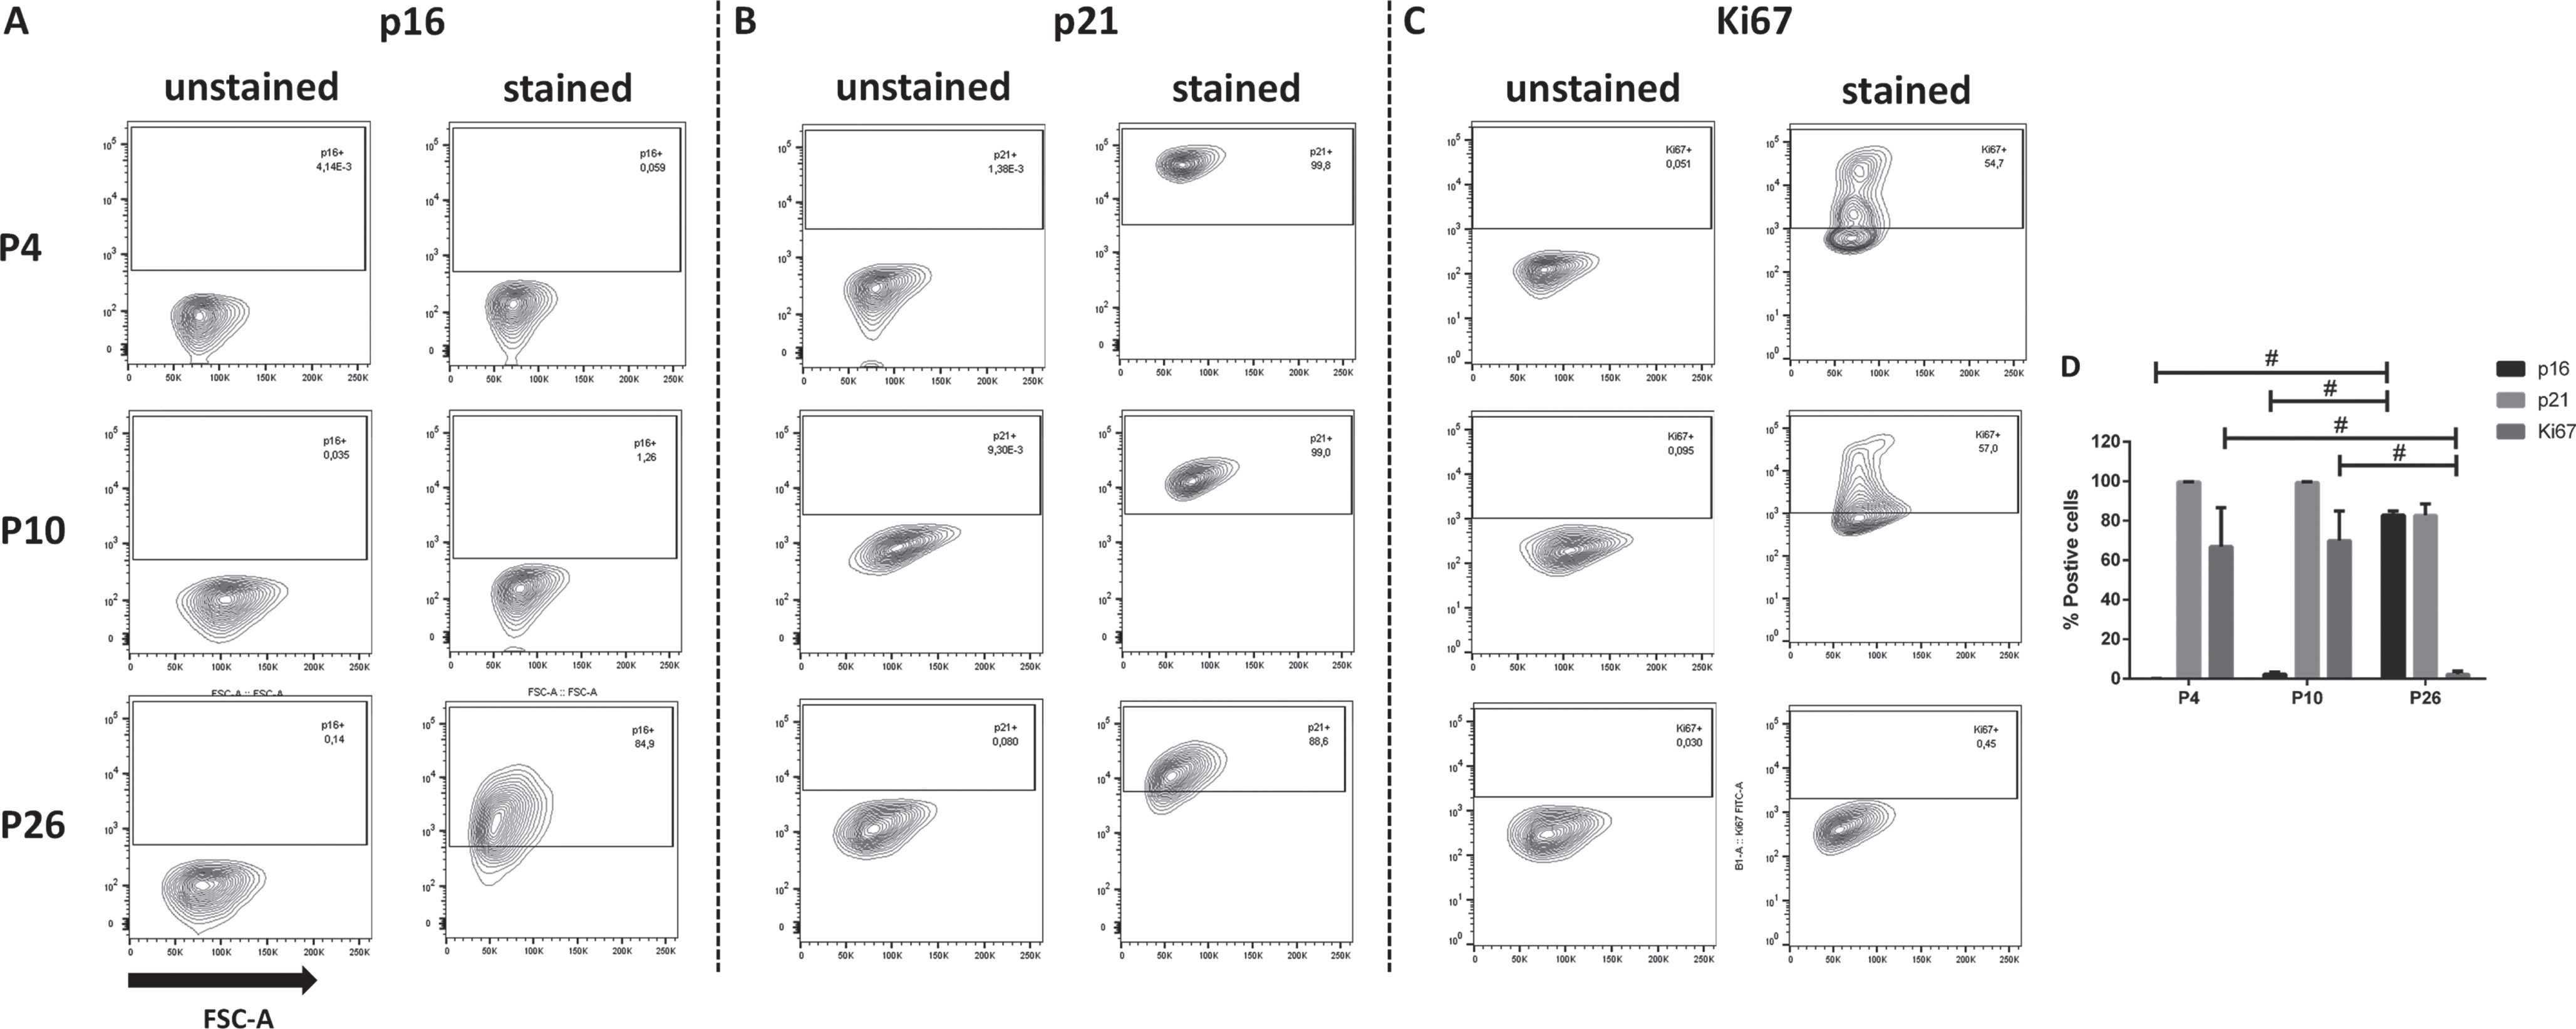
Quantification of p16-, p21- and Ki67-expressing human umbilical vein endothelial cells (HUVEC). HUVEC of passage (P) 4, P10 and P26 were analyzed for the expression of the senescence markers p16 and p21 as well as the proliferation marker Ki67 by flow cytometry. Representative contour plots (A-C) as well as the percentage of marker-expressing cells (D) are shown. Quantitative data represent the arithmetic mean±standard deviation of three independent experiments with at least 10,000 events per sample. Black lines with # indicate significant differences with p≤0.0001.
As cell ageing contributes to cardiovascular diseases, the senescence status of endothelial cells could be a valuable biomarker for autologous endothelialization strategies for implants [33]. Numerous assays have been established to determine the senescence status of cells [27, 34]. In order to select an assay for endothelial cell senescence, we compared four different commonly used markers, namely SA-β-Gal, p16, p21 and Ki67, using endothelial cells of three different passages.
Primary endothelial cells are usually cultivated up to P3-5 prior to experiments. Older passages are associated with the risk of dedifferentiation leading to a loss of EC function depending on the adhesive cell culture substrate [35, 36]. Thus, for the present study, cells of P4 were regarded as young cells. In contrast, cells of P26-27, which was the highest passage that could be achieved in our hands, were regarded as old cells. To have a middle-aged population, cells of P10 were chosen. While the growth curve of P4-cells showed a steadily increasing growth over time indicating that a stationary phase was not reached after 4 days of cultivation, growth of P10-cells slowed down at day 4. While the difference in cell proliferation between P4 and P10 was not significant, P27-cells proliferated significantly slower than P4- and P10-cells at day 3 and 4. The differential growth was also reflected by the population doubling time, which substantially increased from cells of passage 4 (24±3 h) and passage 10 (37±15 h) to passage 27 (103±65 h). For primary cells such as EC, population times of 19–24 h in low passages are typical [37, 38]. Overall, these results supported our initial assumptive classification of young vs. middle-aged vs. old cells. However, a direct comparison with other studies is complicated by the fact that different EC types, cell culture media and substrates are routinely used, which strongly influence the proliferation behavior.
With regard to the SA-β-Gal activity, one of the most commonly used senescence markers, the photometric quantification was more reliable and also more sensitive than the microscopic method. While the microscopic method only detected a difference between cells of P4 and P27, the photometric assay additionally detected differences between cells of P10 and P27. Moreover, the scattering of data points was smaller with the photometric method indicating that less biological replicates are required to detect differences. However, none of the two methods detected a difference between cells of P4 and P10. Thus, three other markers such as the cell cycle inhibitors p16 and p21 as well as the proliferation marker Ki67 were tested. Immunocytological staining revealed the localization of these proteins in the cell nuclei. While the localization of p21, which was distributed over the whole nucleus, was comparable to the findings by others [39], the localization of p16 differed from most patterns shown in other studies [40]. Here, p16 showed a dot-like pattern with numerous, small dots in the cell nuclei but also in the cytoplasma in cells of P4 and few, large dots in cell nuclei of P27. Sawicka et al. examined the specificity of four commercial antibodies for p16 and found the protein to be localized either in the nucleus or in the nucleus and the cytoplasm, depending on the antibody. However, the nuclear staining rather resembled the p21 staining in the present study [40]. Interestingly, the dot-like pattern seemed to be congruent with the expression of Ki67. In contrast to p16, such a dot-like pattern in cell nuclei is widely known for Ki67 [41, 42]. To exclude technical errors, cells were not only triple-stained but also single-stained with p16 antibodies resulting in the same dot-like pattern (data not shown). Moreover, images were taken in a sequential mode by a confocal laser scan microscope at wavelengths that lie far away from each other (p16:647 nm and Ki67:488 nm). Thus, a spectral overlap leading to false positive results can be excluded. This raises the question as to whether p16 and Ki67 are located at nearly identical positions in the nucleus. Co-localization of these proteins was indeed described for epithelial cells of cervical biopsies [43]. In recent years, dual staining of p16/Ki67 has been increasingly recognized as a potential diagnostic marker for cervical cancers [44, 45]. However, a dot-like pattern as found here was not reported. Only recently, a study on senescence induction in cancer cells showed a similar dot-like pattern for p16 in mouse pancreatic cancer cells, through this was not further discussed [46].
To quantify the expression of p16, p21 and Ki67, flow cytometry was performed. This required the use of different antibodies, which thus also served as an additional check as to the specificity of the p16 antibody used for immunostaining. In contrast to the findings obtained from the immunostaining showing a p16 expression in cells of all passages, flow cytometry revealed a negligible expression in cells of P4 and P10 but a clear expression in cells of P26. While the p16 antibody used for immunostaining is a mouse-derived monoclonal antibody of the subclass IgG2b, the p16 antibody used for flow cytometry is a recombinant antibody of the subclass IgG1 according to the manufacturer’s information. Though the given Entrez Gene ID is the same for both antibodies, it cannot be excluded that the antibodies recognize different parts of the p16 protein leading to a differential detection pattern. The high percentage of p16-expressing cells of P26 is in line with the theory that this marker is increasingly present in aged cells [47]. The same is known for p21 [47], however, the data of the present study show that p21 was uniformly expressed in the majority of cells of all passages regardless of the antibody used. Aside from generally cautioning against the uncritical acceptance of specificity claims provided by the manufacturers of antibodies [48] this supports the current attitude of the scientific community of using a panel of different markers rather than single markers to assess the status of cellular senescence [49]. Though the decrease of Ki67 expression of with increasing cellular age makes sense, there were also doubts as to the specificity of this marker in other studies [32]. Here, p16 and Ki67 were useful markers to discriminate cells of P4 and P26/27 and of P10 and P26/27, comparable to the data of the photometric SA-β-Gal activity assay and the growth curve. From a practical point of view, the performance of flow cytometric analyses is quicker, associated with less effort compared to the SA-β-Gal activity assay and allows the analysis of more cells per experiment. However, none of the methods tested was able to detect differences between cells of P4 and P10. It remains questionable whether other markers such as cell surface markers, secretory markers or chromatin-associated markers among others would be able to detect such differences (reviewed in [49]). Moreover, it is unclear whether potential differences between cells of P4 and P10 would affect the seeding procedure and the performance of endothelialized cardiovascular implants at all.
Conclusion
Among the four different methods tested, the photometric SA-β-Gal activity assay and the flow cytometric determination of p16 and Ki67 are most sensitive and reliable in differentiating EC of different passages whereas flow cytometry requires less replicates to detect differences in cellular age. With regard to the endothelialization of implant materials, the assessment of the senescence status alone is certainly insufficient to predict the performance of a cardiovascular device. Instead, such assays should be combined with functional analyses to obtain information about endothelial cell proliferation and migration as well as their potential to secrete anti-thrombotic molecules like prostacyclin or nitric oxide necessary for the optimal performance of cardiovascular implants.
Footnotes
Acknowledgments
Angelika Ritschel and Luisa Grünberg are acknowledged for technical assistance in the performance of all experiments. This work was financially supported by the Helmholtz Association through program-oriented funding.