
Abstract
BACKGROUND:
Almost 95% of the venous valves are micron scale found in veins smaller than 300μm diameter. The fluid dynamics of blood flow and transport through these micro venous valves and their contribution to thrombosis is not yet well understood or characterized due to difficulty in making direct measurements in murine models.
OBJECTIVE:
The unique flow patterns that may arise in physiological and pathological non-actuating micro venous valves are predicted.
METHODS:
Computational fluid and transport simulations are used to model blood flow and oxygen gradients in a microfluidic vein.
RESULTS:
The model successfully recreates the typical non-Newtonian vortical flow within the valve cusps seen in preclinical experimental models and in clinic. The analysis further reveals variation in the vortex strengths due to temporal changes in blood flow. The cusp oxygen is typically low from the main lumen, and it is regulated by systemic venous flow.
CONCLUSIONS:
The analysis leads to a clinically-relevant hypothesis that micro venous valves may not create a hypoxic environment needed for endothelial inflammation, which is one of the main causes of thrombosis. However, incompetent micro venous valves are still locations for complex fluid dynamics of blood leading to low shear regions that may contribute to thrombosis through other pathways.
Introduction
Venous valves are essential mechanical components of blood vessels and responsible for maintaining the efficient circulation of blood in the human body [1, 2]. Unique shape of the venous valves maintains the unidirectional flow of blood from tissues and distant body parts towards the heart. Such valves are observed in the deep veins, superficial veins, and micro veins as small as 40μm diameter [3]. Flow through venous valves in the deep veins have been rigorously studied [4–12], as they are the prime locations to develop unwanted clots, a fatal condition known as deep vein thrombosis (DVT), which can lead to serious cardiovascular complications such as pulmonary thromboembolism [13–15]. However, the fluid dynamics of blood in the micro venous valves, which constitute about ∼94% of the total venous valves in the body (found in vessels with diameter less than 300μm), have not yet been extensively characterized [16]. Venous valves in the deep veins have been suggested to develop DVT mainly through two mechanisms i.e., the hypoxic inflammation of the valve endothelium or the deposition of procoagulant factors such as tissue factor laden microparticles that are shed by various cells [17]. However, it is not known whether these mechanisms are also responsible for thrombus formation in micro venous valves. Limitations in studying in thrombus formation in micro venous valves are because of the lack of relevant in vitro models and difficulty in conducting in vivo studies due to the location of these micro venous valves in the human body [18]. Since fluid mechanical analysis of small veins is extremely difficult in murine models, in silico and more advanced in vitro models of the micro venous valves may help us understand if these valves are also locations of thrombus formation similar to the venous valves in deep veins, which have a larger diameter. Use of computational modelling to study the flow of whole blood through micro venous valves can help us understand the unique and complex fluid flow dynamics of blood in these valves. The results of such analysis can also be the basis for future development of in vitro models of micro venous valves.
In the present study, we use computational fluid dynamic simulations to show the effects of non-Newtonian blood flow in a 2D model of a pathological micro venous valve. We then analyze the effects of transient flow and resulting fluid profiles within these pathological venous valves. We also validate the fluid mechanics predicted in a 2D system with a significantly more computationally expensive 3D model of the micro venous valve to suggest strategies for future modeling of such phenomena. Finally, we superimpose an oxygen transport model over fluid mechanics to analyze hypoxia in a micro venous valve, a determinant of endothelial dysfunction and thrombosis.
Methods
Fluid mechanics of blood
In order to conduct the computational fluid dynamic simulation of blood flow through the micro venous valves, we solved the conservation of mass, conservation of momentum, and conservation of energy equations (Equation 1, 2) for an incompressible fluid flow, using the commercially available CFD software package Fluent (Ansys v20R1) based on a finite volume scheme.
Where,
Blood in the fluid domain was modelled as a non-Newtonian fluid with constant density of 1060 kg m–3 and viscosity following the three different viscosity models given below [19–21].
Newtonian model:
Casson Model (non-Newtonian model):
Where,
τ = 0.1 (0.625H) 3, is the yield stress under shear, which is 1.24 mPa
and H = 0.37, which is the blood hematocrit
Where η0 = 0.0012 Pa · s, is a constant
Generalised power law Model (non-Newtonian model):
where
where μ is the viscosity,
The engineering drawing is developed in Solidworks and imported to Ansys Fluent for the in-silico experiments. The geometric similarity of the micro venous valves with the large venous valves were achieved by following the procedure illustrated in our previous work [22] in which the ratios of a) micro vein diameter to the maximum valve cusp depth (0.8–1.2); b) micro vein diameter to the maximum width of the valve bulb (1.0–1.5); and c) micro vein diameter to the distance between the venous valve leaf tip and valve bulb reemergence (1.4) are matched. The exact dimensions used for the designing the micro-venous valves are deduced from the 2D micro-vein width, which was set as 200μm. The boundary conditions are then set to solve the equations of the fluid flow problem. We set the walls of the domain to have a no-slip boundary condition. The inlet boundary condition for the simulation is a “velocity” corresponding to the desired wall shear stress and the outlet boundary condition is a “pressure” outlet condition set to gauge pressure zero. Since the blood flow near a venous valve is governed by the actuation of surrounding muscles and opening and closing of upstream venous valves, we assumed a similar sinusoidal inlet velocity profile whose magnitude varied with time [4, 23]. We chose a time period of four seconds for our inlet velocity profile similar to a full opening and closing cycle of in vivo venous valves [24]. We applied the magnitude of the inlet velocity profile such that total volume discharge over two seconds corresponded to the steady volume discharge for Reynold’s number (Re) 0.04, which is typically observed [25] in in vivo micro veins. We run the analysis for about 1000 cardiac cycles to achieve a converged solution. The computational mesh of 2D micro vein consisting of three valves that were equally spaced from each other (each valve was 5 mm apart) in a 2 cm long micro vein was built. We use a workstation with intel core i9-9900, 3.10 GHz and 32 Gb RAM to run the simulations. The CFD simulations resulted in vortices at the micro venous valves, which were characterized by the vorticity and the swirling strength the vortex. The direction of rotation of the vortex was given by the sign of the vorticity (a positive valve is a counterclockwise rotating vortex, and a negative value is a clockwise rotating vortex), which was calculated from the non-diagonal terms of the velocity gradient tensor. The swirling strength of the vortices were also calculated from the velocity gradient tensor, where the swirling strength was the imaginary part of the complex eigen value of the velocity gradient tensor [26].
In 2D velocity gradient tensor is given by
In 3D, velocity gradient tensor is given by
Which will reduce to
For the mass transport problem, we solved the combined effects of diffusion and convection of the dissolved chemical species, in this case oxygen. We first solved the conservation of mass, conservation of momentum, and conservation of energy equations (Equation 1, 2, 3) in the fluid domain using the commercially available solver Comsol Multiphysics (v5.2), based on a finite element scheme. We obtained the convective flow of whole blood in the micro venous valves when the fluid flow problem was solved. We then, solved the combined effects of convective mass transport with diffusive mass transport to obtain the mass transport of oxygen [27].
Where,
Computational model development
We were inspired to mimic the design of a typical microscopic vein consisting of a venous valve of 200μm diameter [3]. Since small veins are not imaged in vivo with clarity, we analyzed the Doppler-ultrasound images of venous valves in the large superficial and deep veins available in literature and scaled down their geometry to design the micro venous valves [28, 29]. The designed valve was a bi-cuspid valve in which the valve leaflets emanated from the walls of the micro vein (Fig. 1B), with physiologically-relevant boundary conditions (Fig. 1C). We conducted the mesh convergence study to arrive at an optimal mesh density that would give accurate converged solution at an optimal computational cost (Fig. 1D). We show that the results become mesh independent after making the mesh finer (Fig. 1E). The mesh used for the results reported in this paper have 44,984 elements and 46,221 nodes. When mass transport problem was solved, we impose the mass transport boundary conditions on top of the fluid flow boundary conditions (Fig. 1F; see METHODS for details).
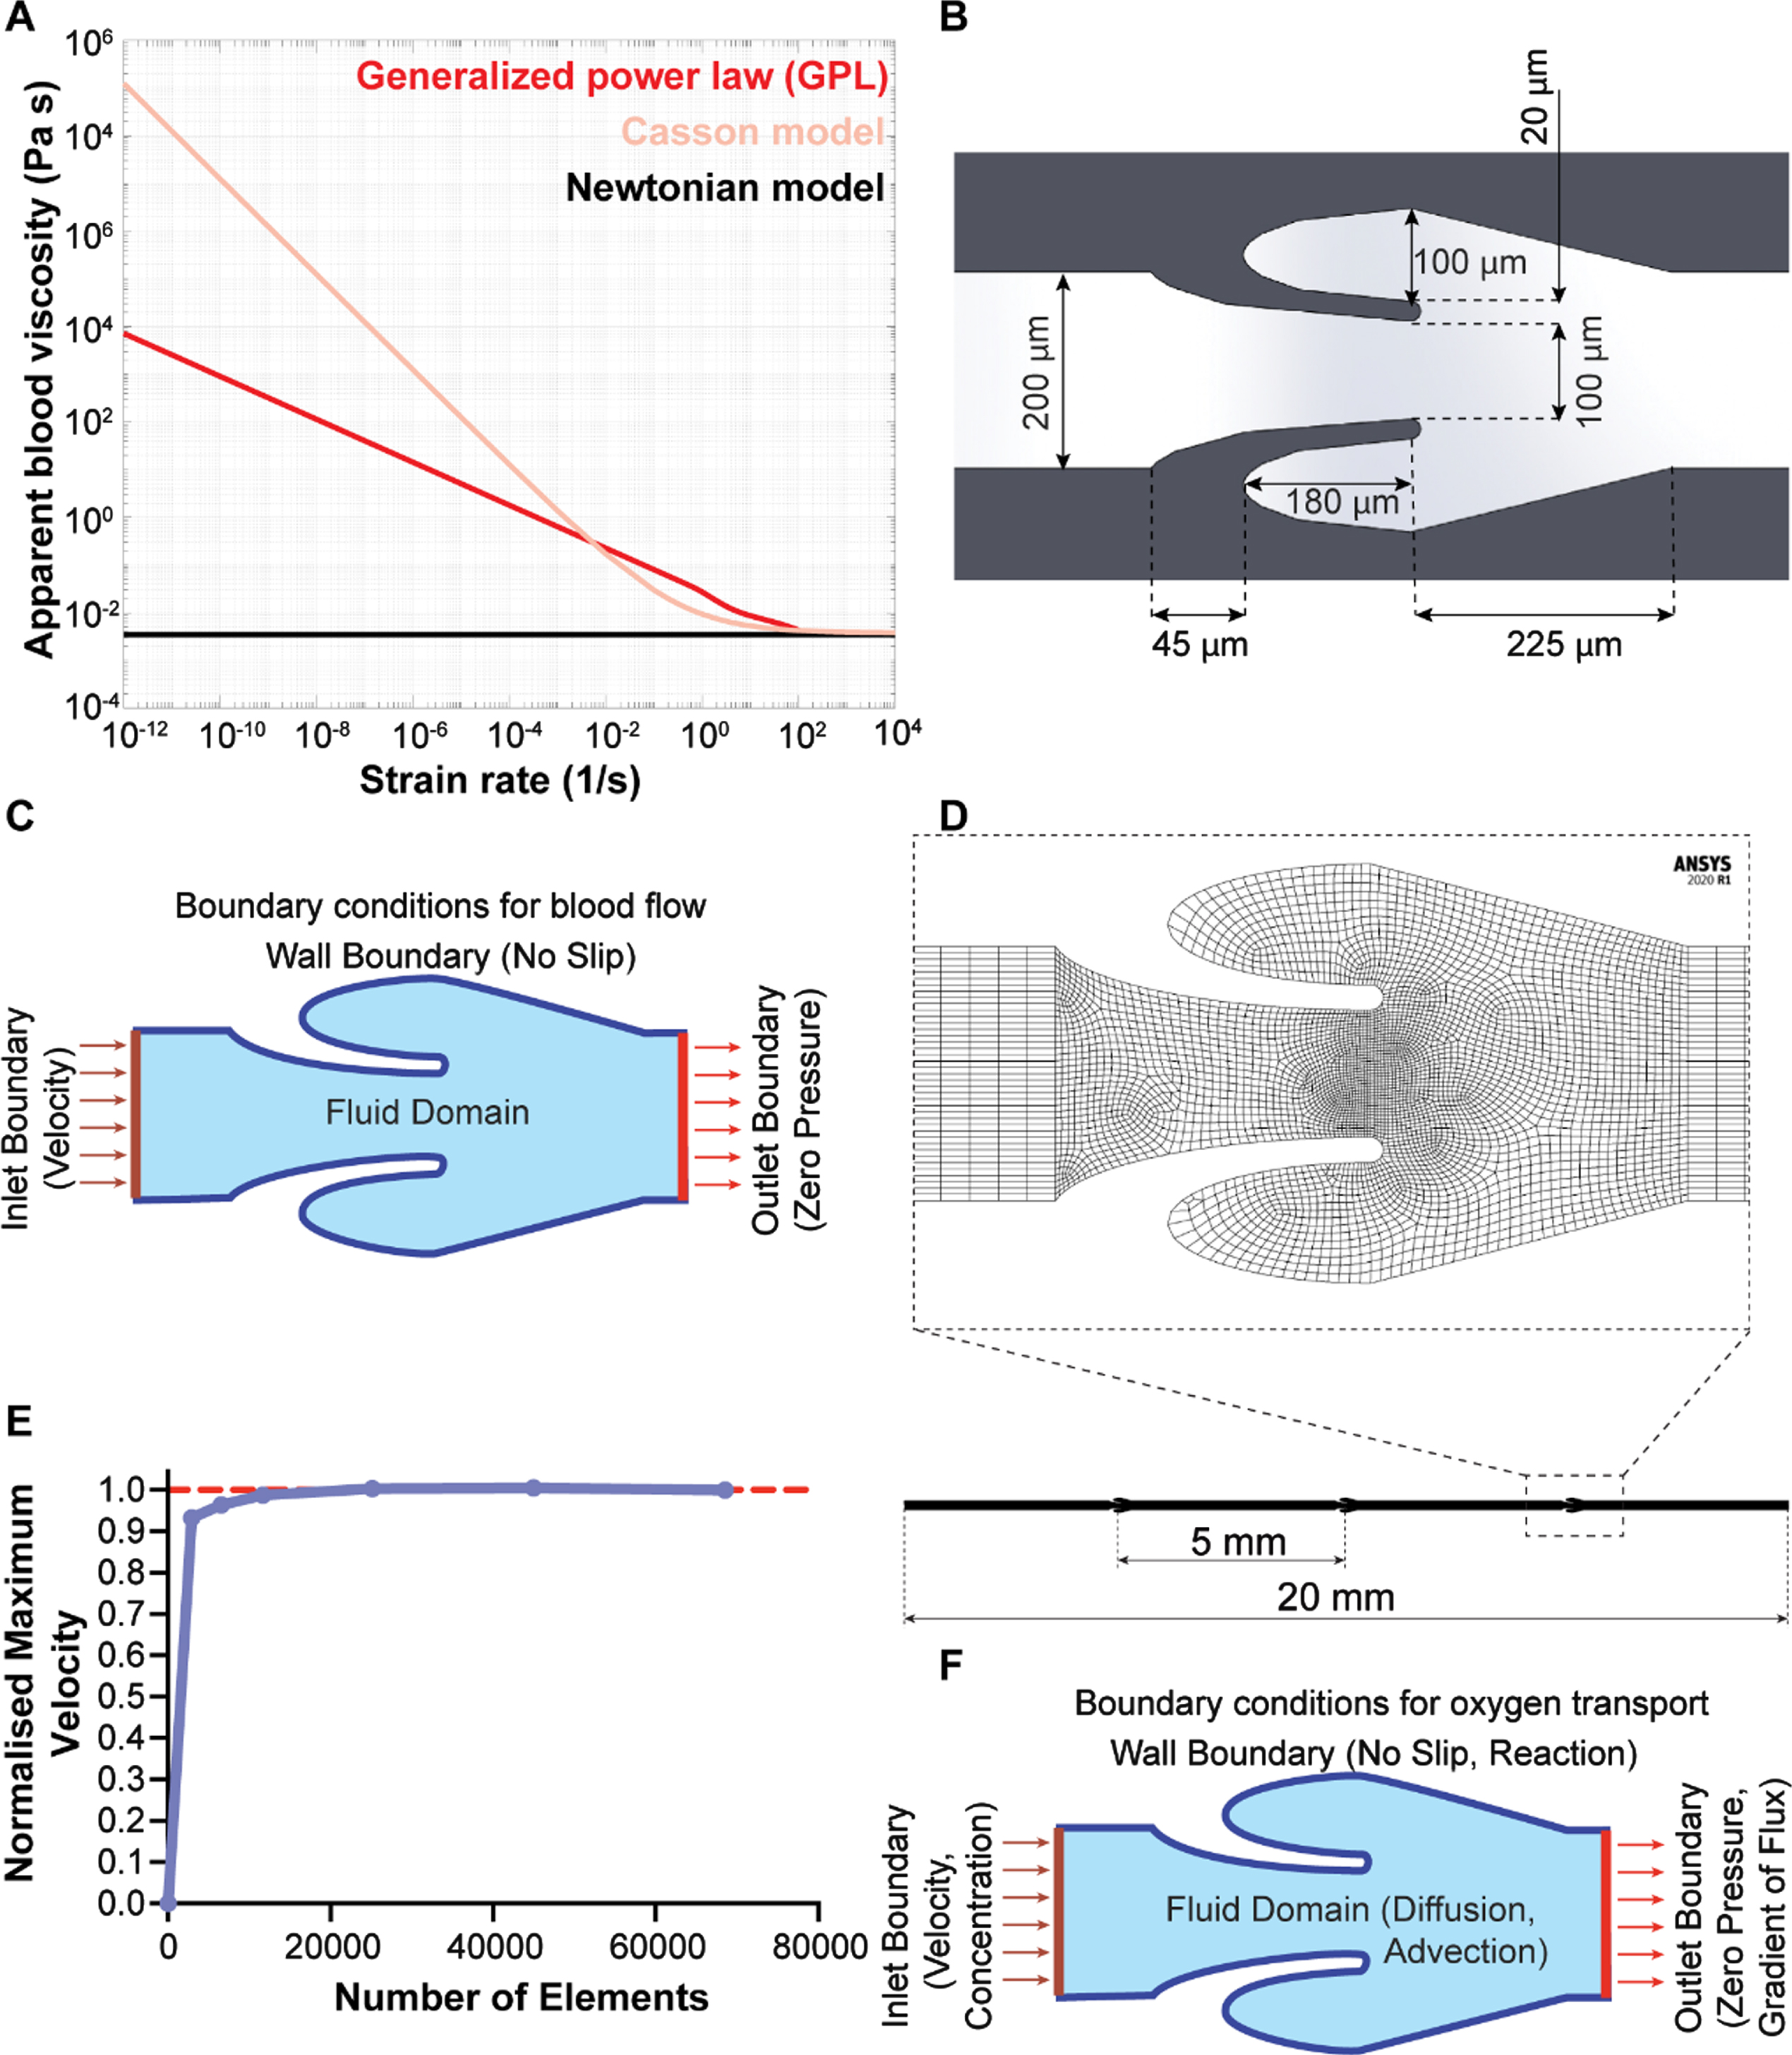
Modelling blood flow in venous valves. (A) Variation of viscosity of blood with wall shear rate sweep for different blood viscosity models – Newtonian model (black), Casson model (pink), and generalized power law (red). (B) Image showing the dimensions used for the design of a micro-venous valve (C) Image showing the boundary conditions and inlet conditions used to solve the blood flow problem in micro-venous valve (D) A straight micro vein of 20 mm length with three micro venous valves (5 mm apart) was designed and discretized. (E) Plot showing the convergence of maximum velocity in a micro-venous valve with increased number of elements. (F) Image showing the boundary conditions and inlet conditions used to solve the oxygen transport problem in a micro-venous valve.
Blood is a highly complex fluid and several constitutive equations of viscosity have been proposed in literature to model its non-Newtonian behavior [19]. Therefore, we began by comparing three commonly applied models of blood viscosity – Newtonian model, Casson model, and generalized power law (GPL, equation 4–6) [20, 30], and determined relative differences of the predicted velocity profiles, dynamic viscosity distribution and wall shear stress distribution in the venous valves. So, we simulated blood flow through the designed micro valves by selecting an inlet volume flowrate of 1μl/min, which corresponds to a typical venous shear stress of 1.1 dynes/cm2 for our micro veins [12, 22]. Velocity streamlines of the blood flow simulation showed maximum velocity at the gap widths that were the regions with smallest cross sections (Fig. 2A). Interestingly, while the Newtonian model and non-Newtonian GPL model predicted the formation of a contra rotating twin vortex system in the valve cusp, the Casson model only predicted the formation of a single vortex in the valve cusp. To understand the variation in the prediction of the formation of a twin vortex system using different viscosity models, we also plotted the heat maps of dynamic viscosity in the venous valves for different models. The dynamic viscosity of whole blood in the venous valves and its cusps showed a relatively sharp increase at the venous valve cusps for the non-Newtonian models (Fig. 2B). The increased viscosity of blood at the venous valve cusps might be leading to the differences in the formation of the vortices in the venous valve cusps. In order to confirm the increase in viscosity of the blood at the venous valves may be due to the low shear, we plotted the wall shear stress in the walls of the venous valves, which showed that the cusps of the venous valves were locations of low shear (Fig. 2C). These results reveal that while the Casson model doesn’t result in a twin vortex system observed clinically and in micro-physiological systems [22, 31], all the models still exhibit that the shear thinning blood becomes highly viscous at the venous valves due to low wall shear stress present at the valve cusps. The difference in prediction of the secondary vortex formation between the Casson model and the generalized power law model is possibly due to the Casson model’s prediction of much higher viscosity of blood at lower shear strain relative to the other (Fig. 1A). Overall, these in silico experiments suggest that the non-Newtonian generalized power law (GPL) predictions are more suited to model blood blow in veins relative to Newtonian or Casson constitutive equations.
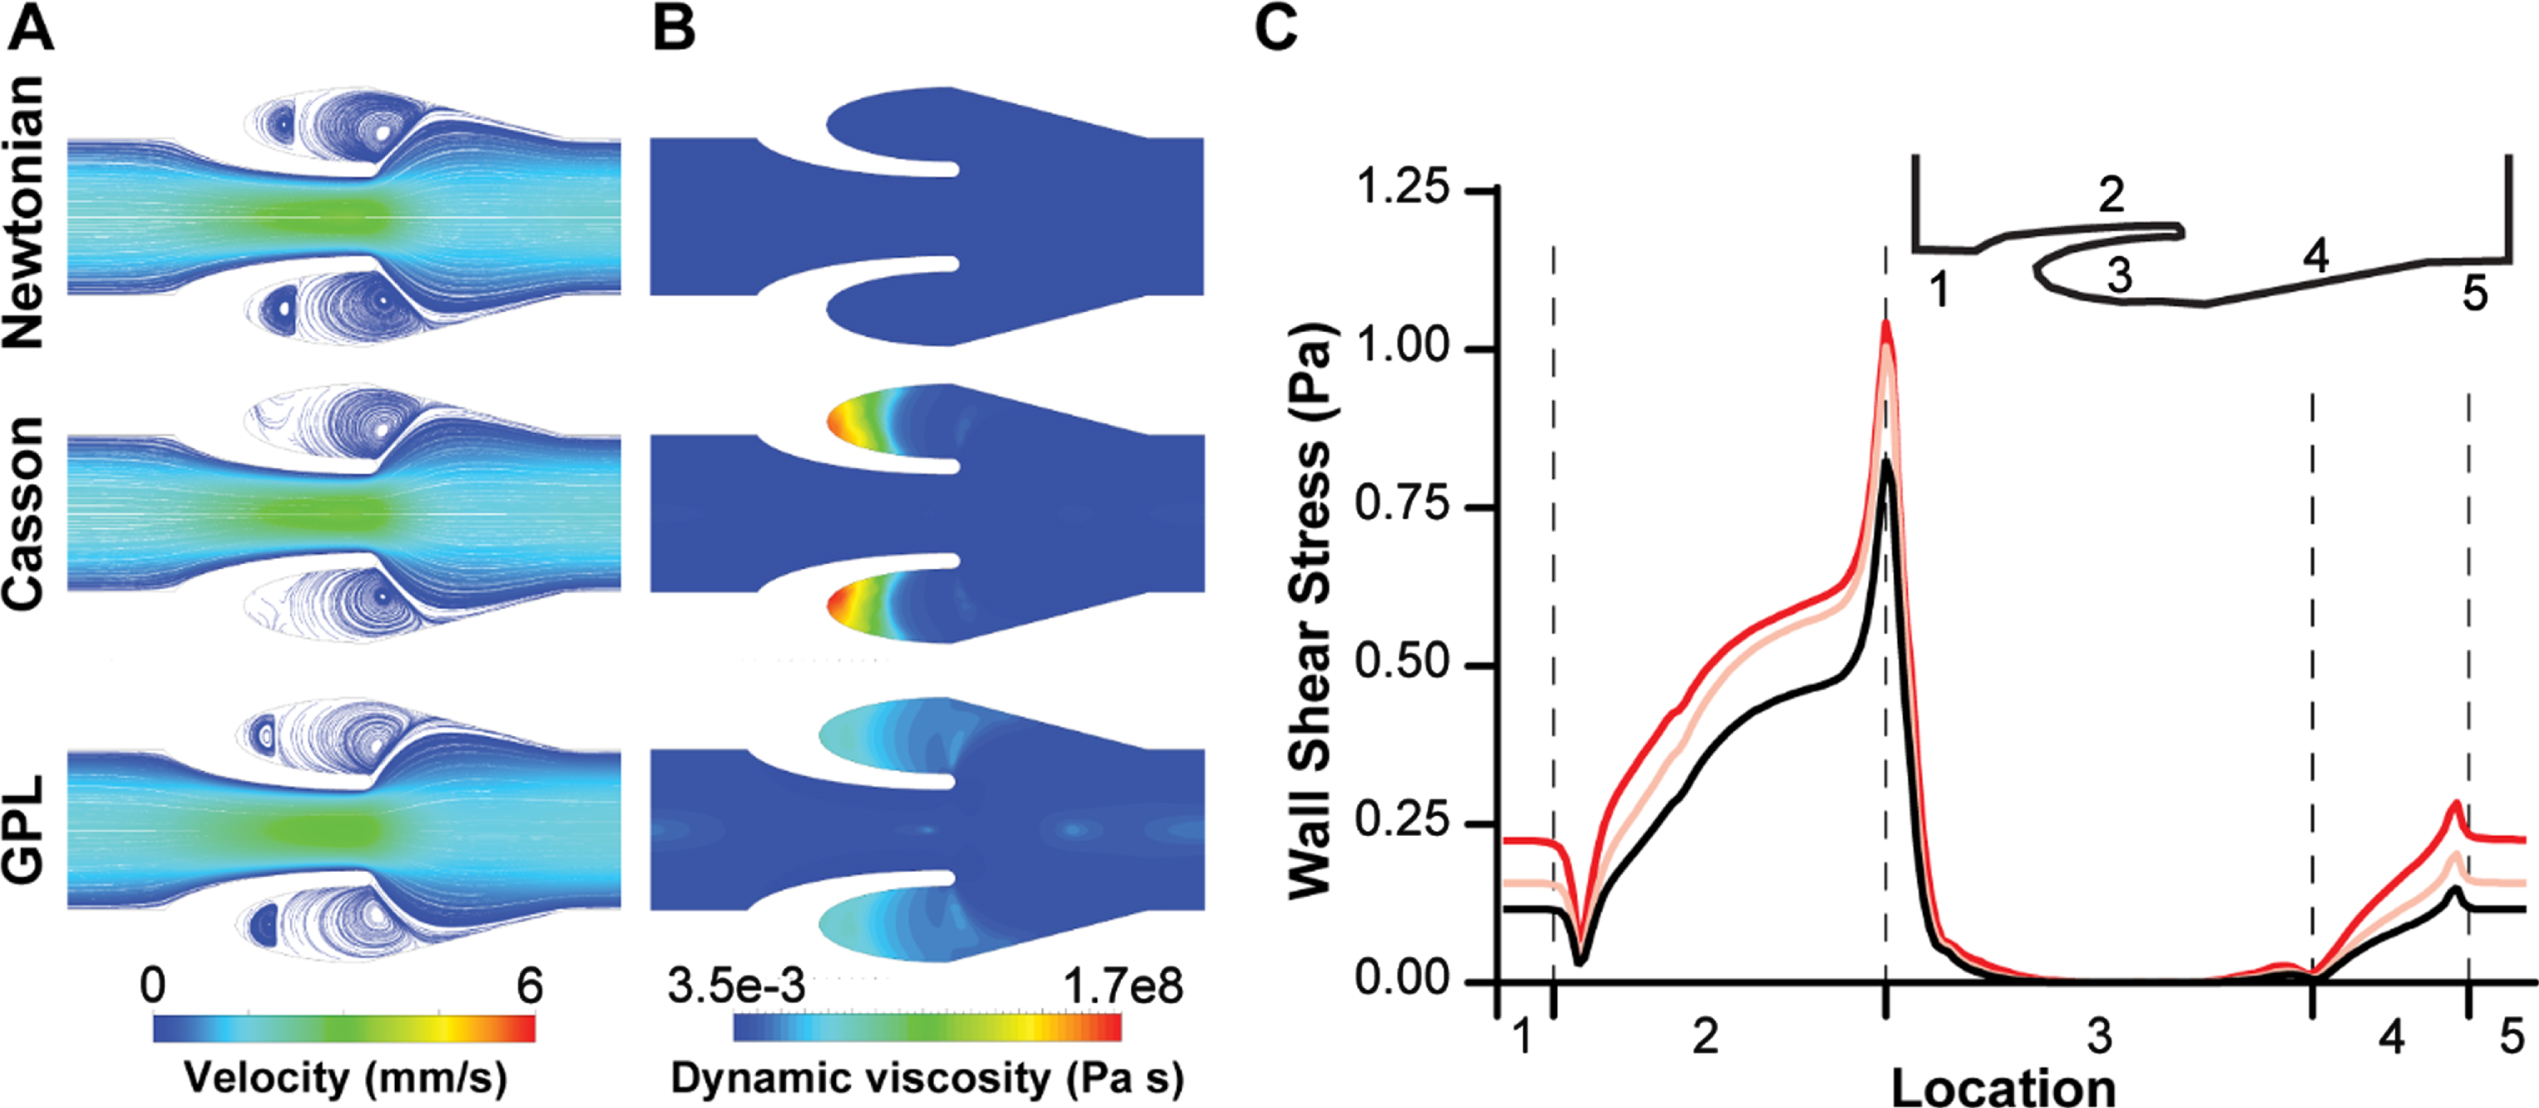
Blood flow in venous valves. (A) Contour plot showing velocity streamlines of whole blood flow in venous valve using different viscosity models. (B) Contour plot showing the distribution of dynamic viscosity of whole blood in venous valve when using different viscosity models. (C) Graph comparing the wall shear stress distribution in the venous valve walls when different blood viscosity models are used - Newtonian model (black), Casson model (pink), and generalized power law (red).
We next set out to apply our computations to explore the effects of transient flow on the formation and strength of the vortices at the venous valve cusps, since it is typically observed in vivo [2]. Non-Newtonian blood (generalized power law) flow through the micro venous valves were simulated under different transient inlet velocity conditions to observe the changes in the flow pattern near the venous valves. We applied an inlet velocity profile that corresponded to the typically observed [25] inlet velocity profile in in vivo micro veins (Fig. 3A). The primary vortex formed at the venous valve cusps was characterized by calculating its swirling strength and vorticity over time (see METHODS). We found that the primary vortex formed at the venous valve cusps has a transient variation in its power as measured through the swirling strength (Fig. 3B). Magnitude of the vortex swirling strength was comparable in forward and backward flow indicating that the vortex sizes remained the same even when the flow direction was reversed. By assessing vorticity, which is a metric for rotation and its direction, we found that the vortex direction was only reversed when the systemic flow direction changed from forward flow to backward flow (Fig. 3C). Velocity streamlines at maximum forward flow and backward flow (at time points one second and three second respectively) showed a well-defined formation of a primary and secondary vortex in the venous valve cusps (Fig. 3D). Further, the reversal of the direction of rotation of the vortices as we move from forward flow to the backward flow was seen (Fig. 3E), which was observed experimentally in our prior work [22]. Further, the wall shear stress in the walls of the venous valves showed that the cusps of the venous valves remained a low shear region during the transient flow (Fig. 3F-G). These results show that the vortex size/strength does not change significantly even when the systemic flow direction is changed under low Reynold’s number. So, we next explored how a larger transient volume discharge (Re 10.00) of blood would affect the characteristics of the vortex system at the venous valve cusps (Fig. 4A). Interestingly, swirling strength of the primary vortex with Re 10.00 does not have the same magnitude under forward and backward flow as we saw in low Reynolds number flow previously (Fig. 4B). However, this difference in the magnitude of swirling strength does not particularly result in a change of direction of the fluid rotation (Fig. 4C). This is possibly because a change in direction of the systemic flow in the vein changes the direction of rotation, but the size of the vortex is constrained by the valve geometry in the backward flow, which we were able to visualize by the streamline and vector plots of the forward and backward flow (Fig. 4D-E). Plotting the wall shear stress in the walls of the venous valves showed that the cusps of the venous valves remained a low shear region even at high Reynold’s number flow (Fig. 4F-G). These results show that the vortex size/strength changes significantly when the systemic flow direction is changed under high Reynold’s number. Also, velocity under a steady state will only increase strength and size of the secondary vortex and does not help in removing the stagnation at the venous valve cusps (Fig. 4B). This happens as the wall shear stress at the cusps remain lower than the yield stress (1.24 mPa) at steady flow (Fig. 4F). The wall shear stress at the abyss of the venous valve cusps become higher than the yield stress of blood only during high Re (Re = 10) with oscillatory flow which includes flow reversal (Fig. 4B, H). When the flow is reversed, the minimum wall shear stress at the abyss of the venous valves is 2.25 mPa, that is more than the yield stress. This also leads to a very interesting observation of why we need oscillatory flow in in vivo venous valves to avoid stagnation and replacement of blood at the venous valve cusps. Overall, this study suggests that changes in the systemic flow positively affects the vortex formation at the venous valve cusps and since venous valves are regions of shear gradients and low shear, these regions may serve as a conduit for accumulation of thrombotic factors, which may contribute to thrombosis.
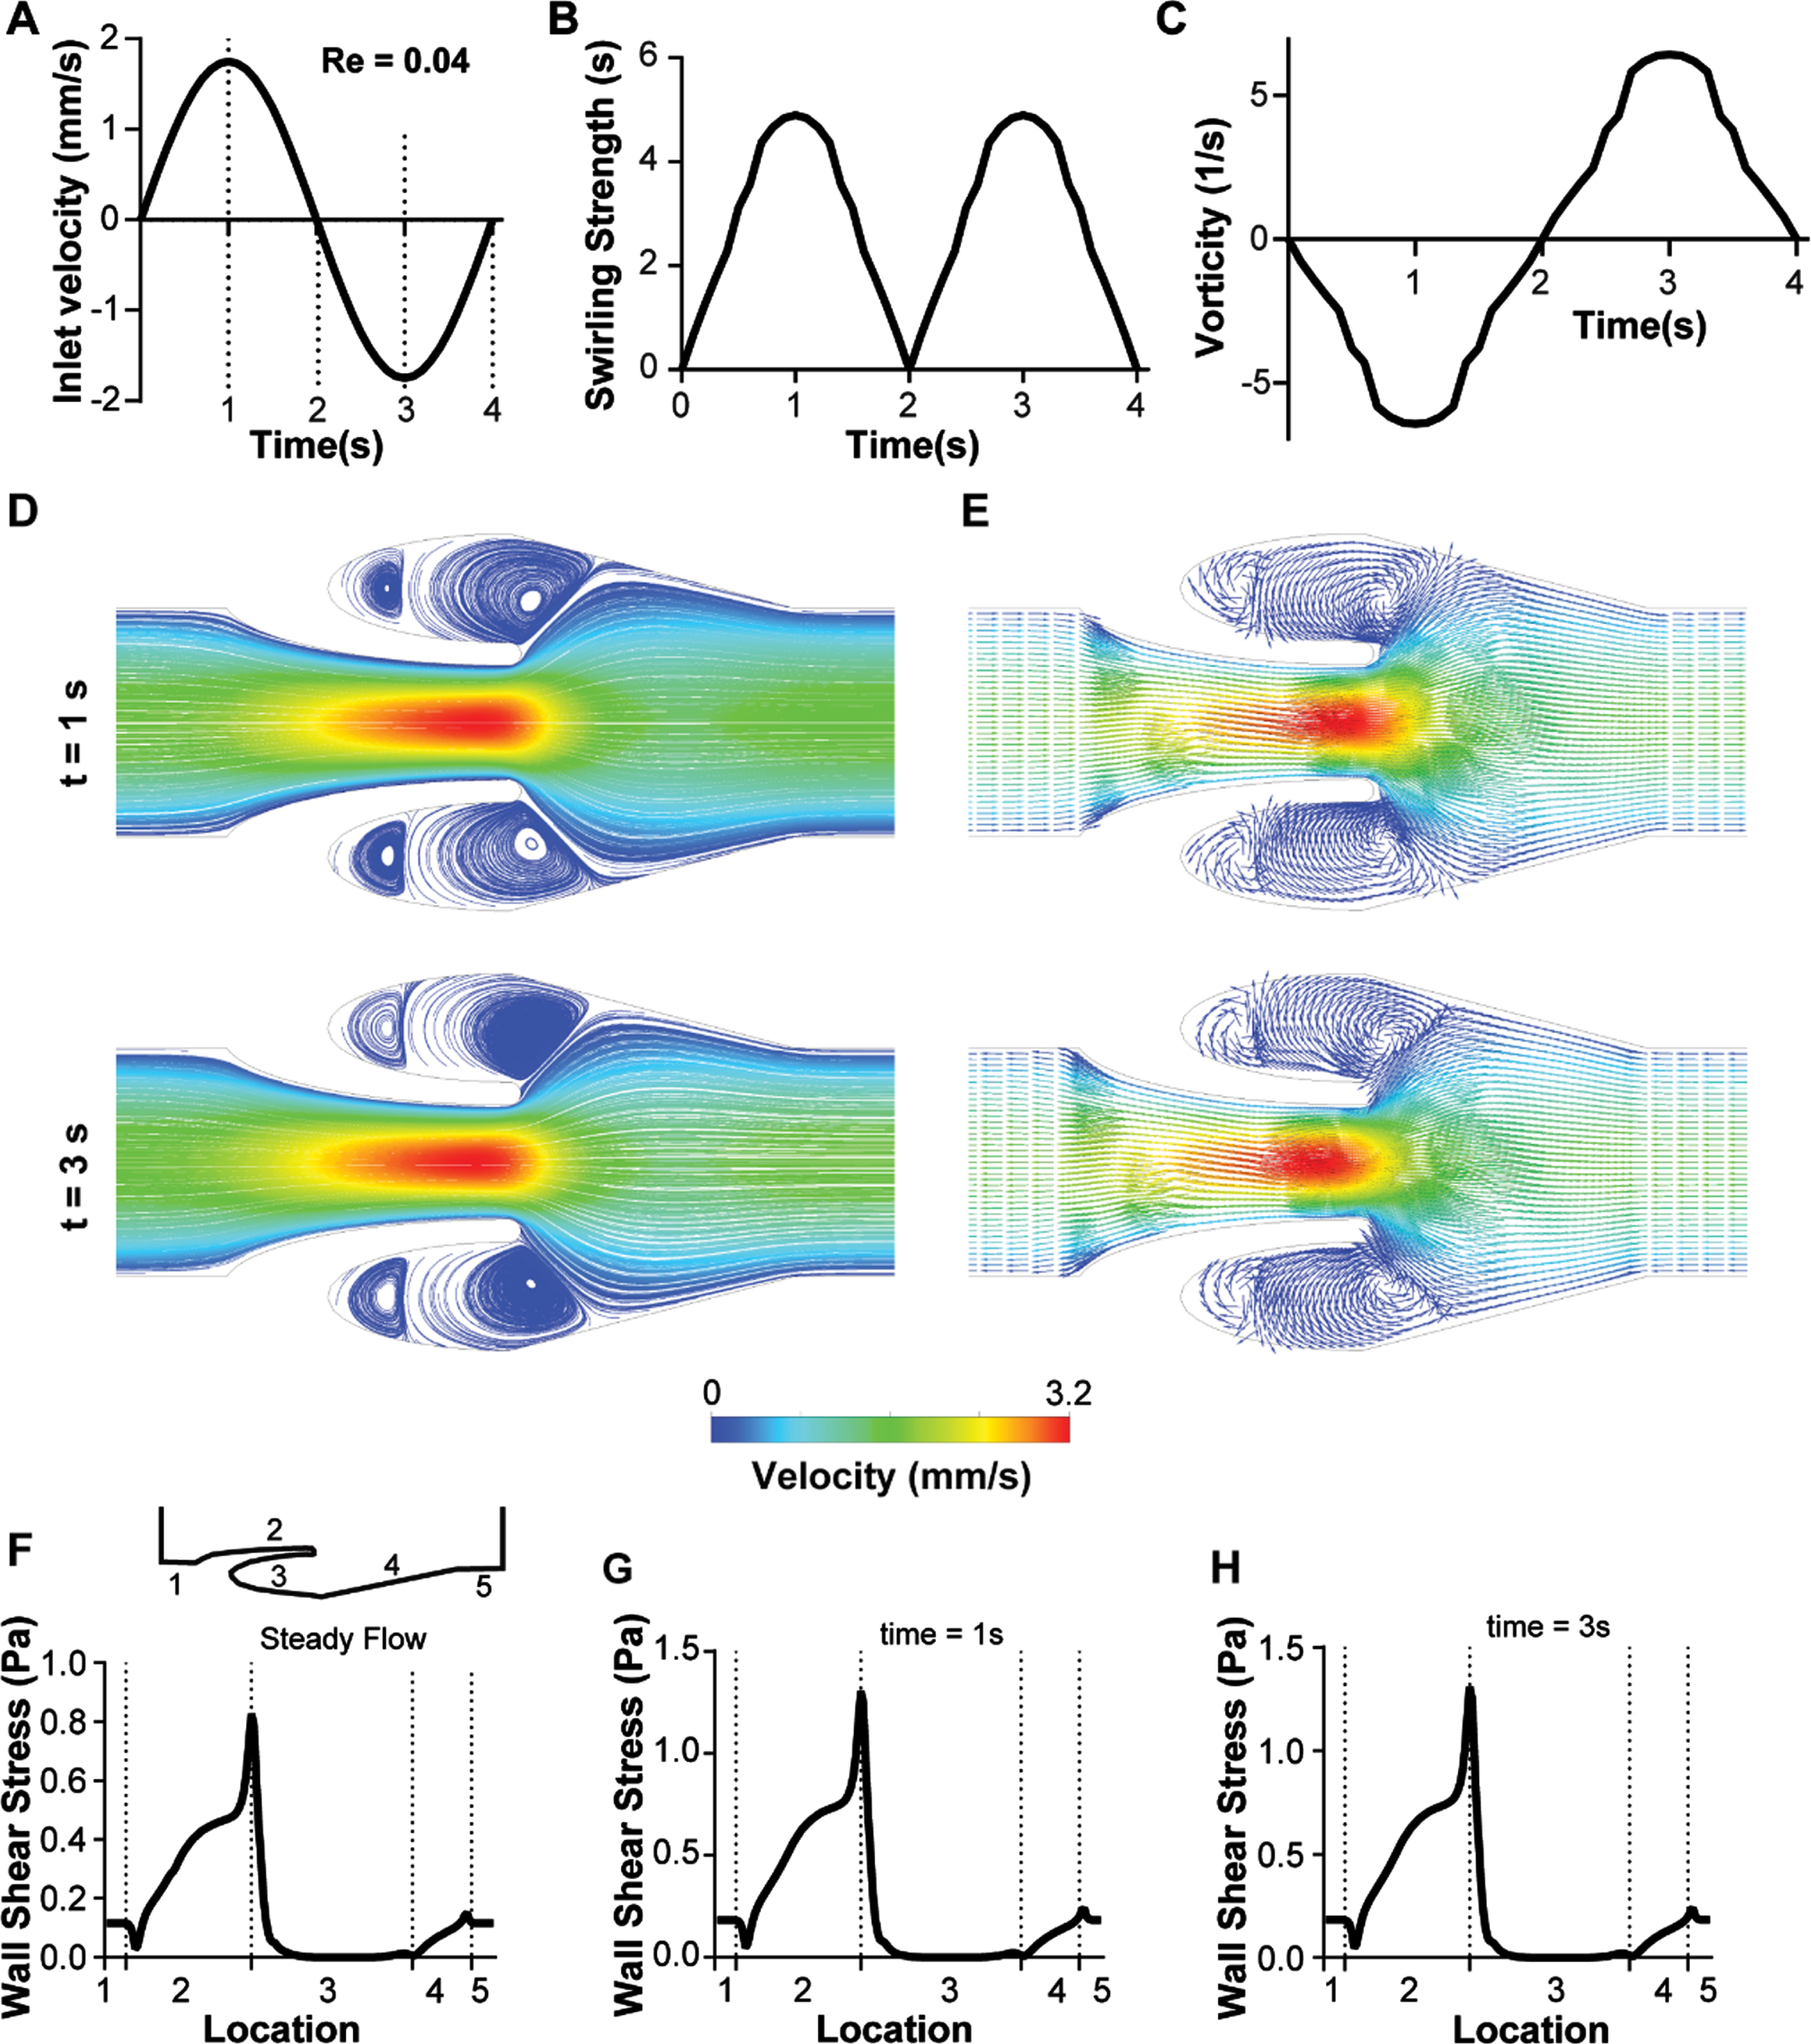
Transient analysis of blood flow through the venous valves under low Reynold’s numbers (Re 0.04). (A) Graph showing the transient inlet sinusoidal velocity profile. (B) Graph showing the transient variation of swirling strength of the primary vortex. (C) Graph showing the transient variation of vorticity of the primary vortex. (D) Contour plot showing velocity streamlines of whole blood flow in the venous valves at maximum forward and maximum backward velocity (time points t = 1s, and 3s respectively). (E) Vector plot showing velocity vectors of whole blood flow in the venous valve at maximum forward and maximum backward velocity (time points t = 1s, and 3s respectively). Graphs comparing the variation the wall shear stress distribution in the venous valve walls under (F) steady flow, (G) max forward velocity (t = 1s), and (I) max backward velocity (t = 3s).
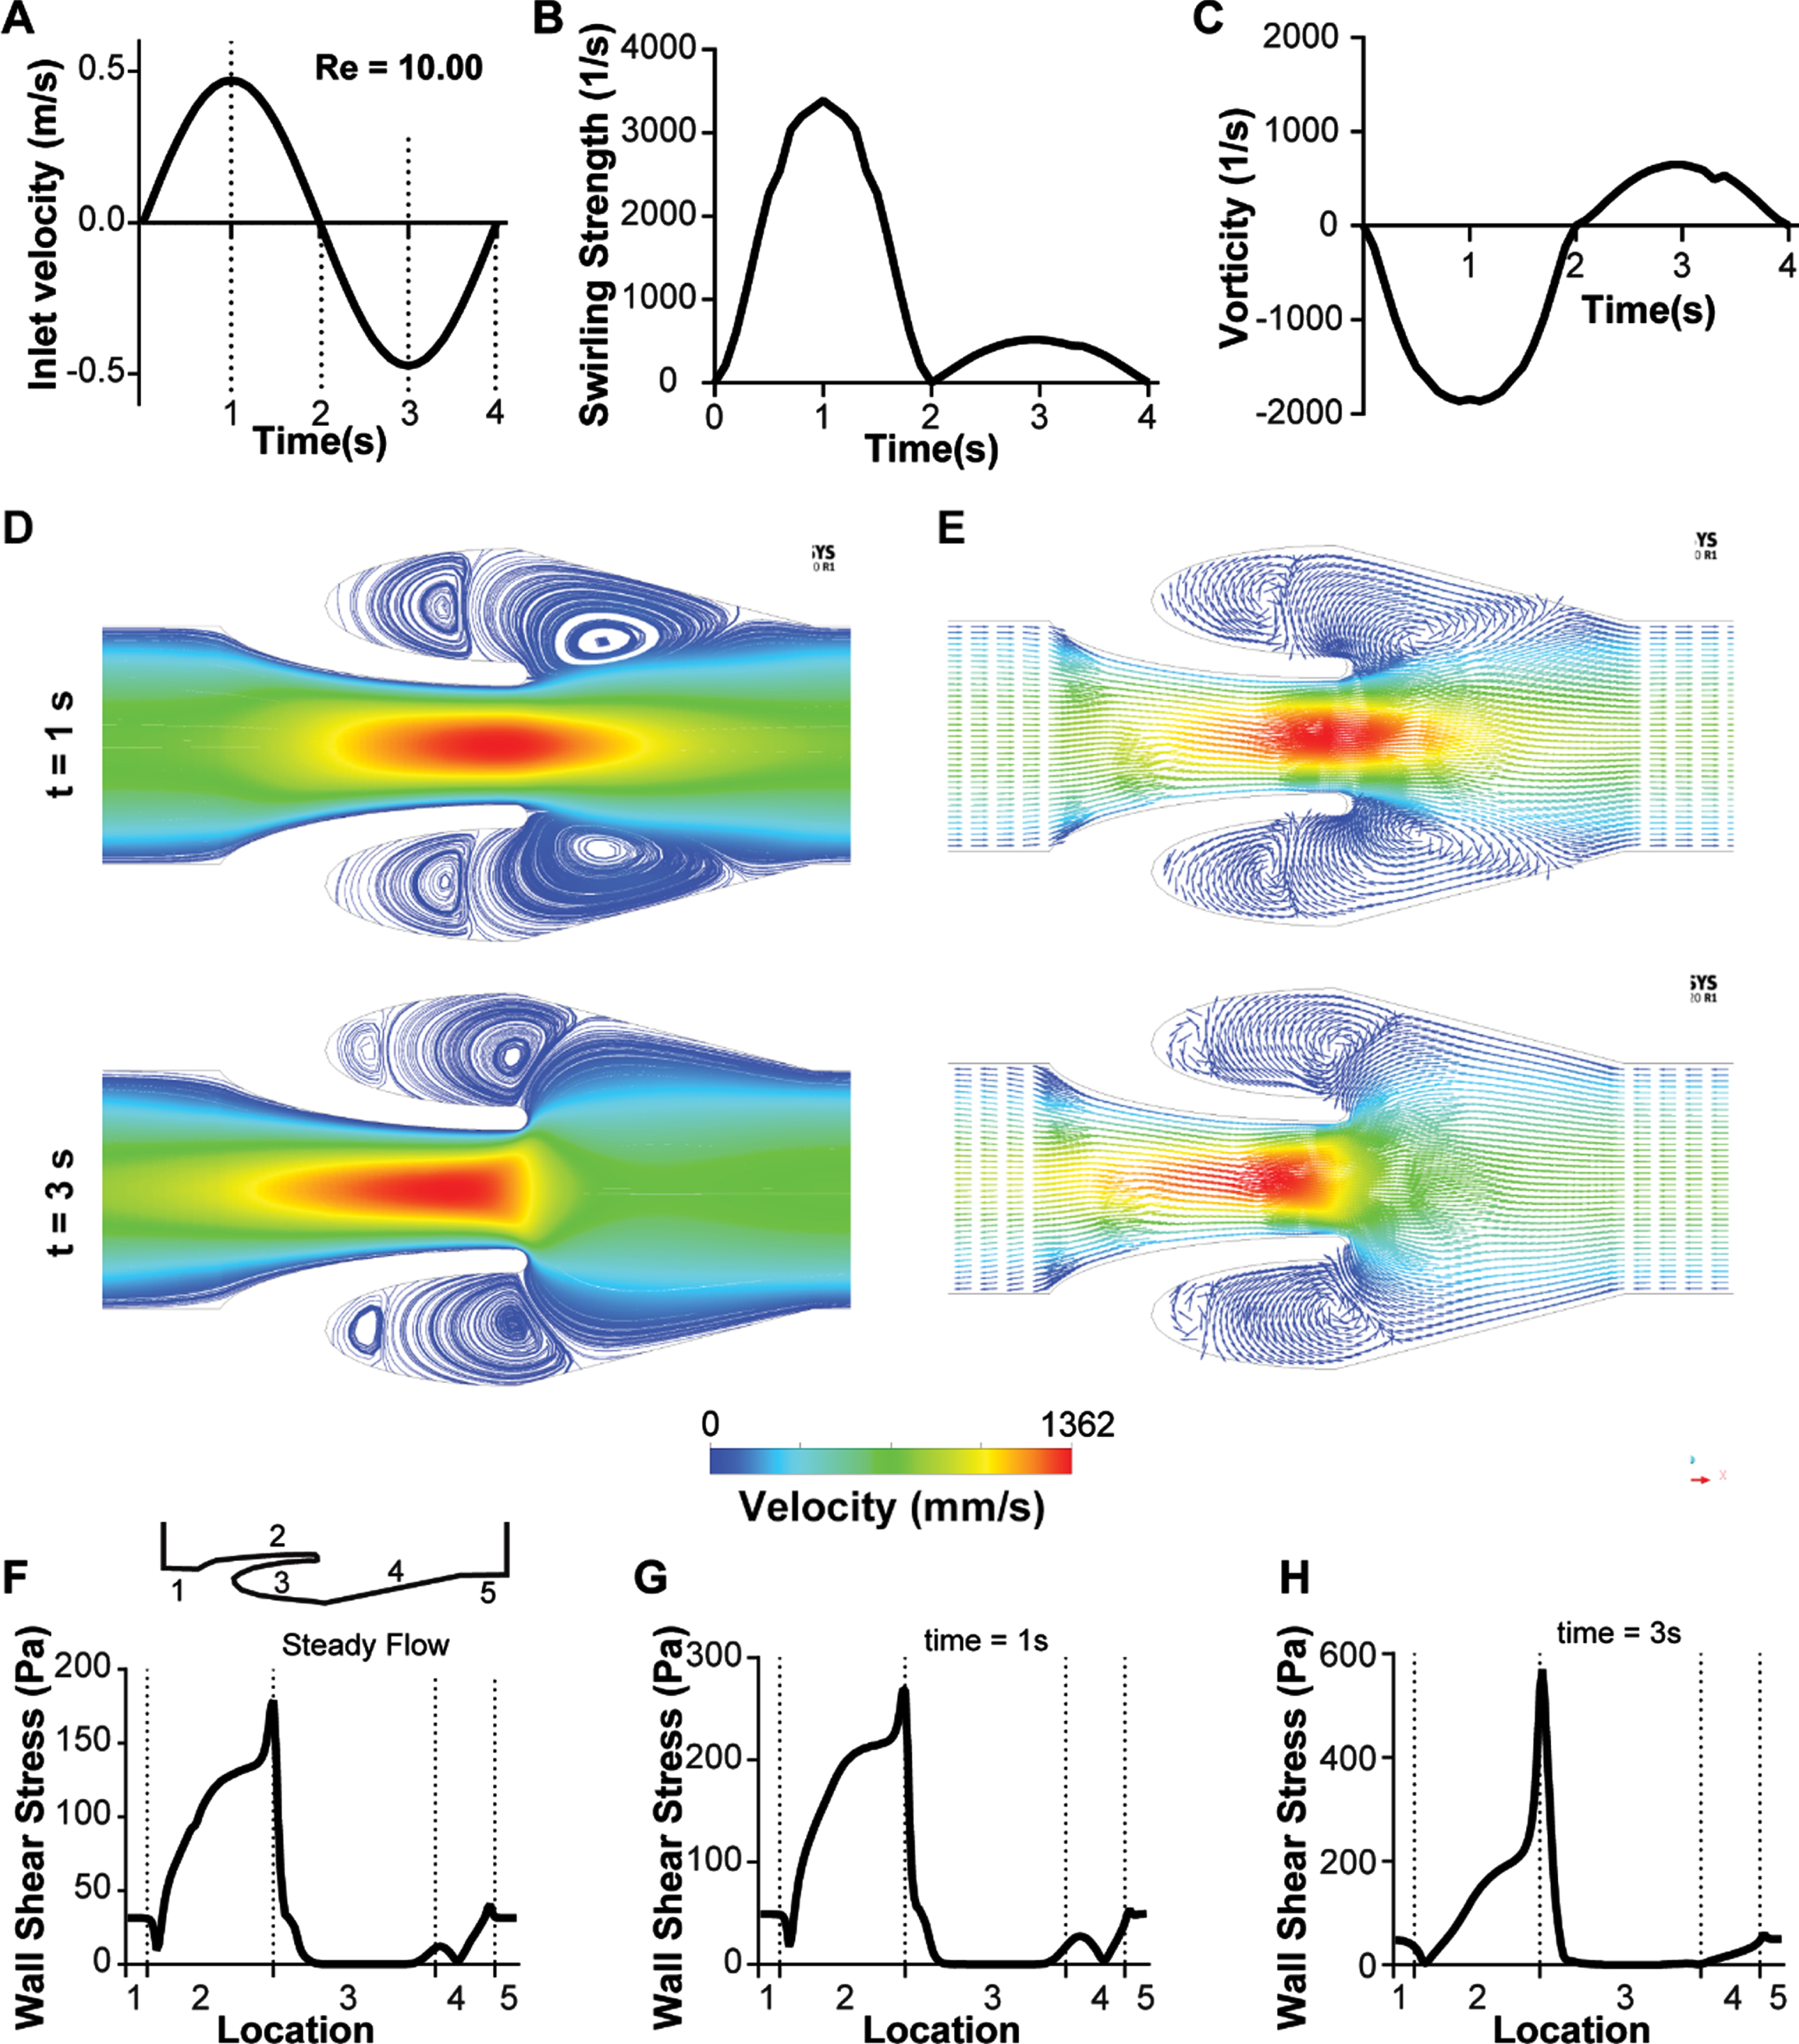
Transient analysis of blood flow through the venous valves under high Reynold’s numbers (Re 10.00). (A) Graph showing the transient inlet sinusoidal velocity profile. (B) Graph showing the transient variation of swirling strength of the primary vortex. (C) Graph showing the transient variation of vorticity of the primary vortex. (D) Contour plot showing velocity streamlines of whole blood flow in the venous valves at maximum forward and maximum backward velocity (time points t = 1s, and 3s respectively). (E) Vector plot showing velocity vectors of whole blood flow in the venous valve at maximum forward and maximum backward velocity (time points t = 1s, and 3s respectively). Graphs comparing the variation the wall shear stress distribution in the venous valve walls under (F) steady flow, (G) max forward velocity (t = 1s), and (I) max backward velocity (t = 3s).
Micro veins have small diameters and thus wall effects can potentially influence the flow. Therefore, we wanted to perform a sensitivity test to our 2D analysis and perform a few critical simulations in a 3D model that is significantly computationally expensive but reduces the assumptions on boundary conditions made in 2D models. So, we conducted an in silico experiment with a 3D geometry of the micro vein containing venous valves to observe the extent to which the resulting flow profile and vortex characteristics may differ from 2D analyses. As vein walls have much lesser stiffness compared to arterial walls, they have an elliptical cross-section rather than a perfect circular cross section (32). This prompted us to design our 3D model with a rectangular cross section of width of 200μm (same as the 2D model) and a height of 75μm (Fig. 5A). Use of a rectangular cross section for 3D geometry helped us discretize the fluid domain with hexahedral elements, which would be extremely difficult and computationally time-consuming with an elliptical cross section (Fig. 5A). Though the 3D analysis also showed the formation of the primary and secondary vortices (Fig. 5B–D) under steady state (Re 0.04), the position and swirling strength of these vortices were distinct from the ones predicted by the 2D analysis. The center of the primary vortex in the 3D analysis was inside the venous valve cusp (Fig. 5B-C) whereas the center of the primary vortex in the 2D analysis was just outside the venous valve cusp (Figs. 2C, 3D). The swirling strength of the vortex was reduced under the 3D analysis (0.18 s–1) compared to the 2D analysis (2.69 s–1, Fig. 3B). Also, our results showed that even though the vortex strength reduced in the 3D analysis the maximum velocity at the gap width of the 3D analysis had a higher velocity (4.4 mm/s, Fig. 5C) compared to the 2D analysis (3.2 mm/s, Fig. 3D). This increase in maximum velocity is likely due to the effects of the top and bottom walls, which effectively reduced the total cross section at the valve gap width much more that the reduction in area in a 2D domain. Wall shear stress at the micro venous valve cusps of the 3D analysis (Fig. 5E) were however, similar to the wall shear stress of the 2D analysis (Figs. 3F and 4F), which was a low shear region.

Blood flow simulation in 3D venous valves. (A) The discretized domain of a 3D micro venous valve. Vector plot of the velocity profile at the midplane of the 3D venous valves (Re 0.04), (B) orthogonal view and (C) isometric view. (D) Contour plot of the primary and secondary vortices formed at the 3D venous valve cusps. (E) Contour plot of the wall shear stress distribution.
We then plotted the variation of the swirling strength of the primary vortex to find the effects of the top and bottom walls on them (Fig. 6A-B). The swirling strength of the primary vortex had a parabolic profile when moving from the bottom wall to the top wall of the microfluidic channel with the maximum swirling strength at the mid-section (∼37.5μm) for both Re 0.04 and 10.00. The transient analysis of sinusoidal velocity profiles (Re 0.04 and 10.00) showed the variation of the swirling strength to be similar to the variations shown in a 2D analysis, but with a lower magnitude (Fig. 6C-D, Fig. 3B-C, Fig. 4B-C). These results suggest that it is possible that 3D modeling may better accommodate the wall effects of the microfluidic veins, and computational predictions of blood flow in small veins may require more expensive computational approaches.
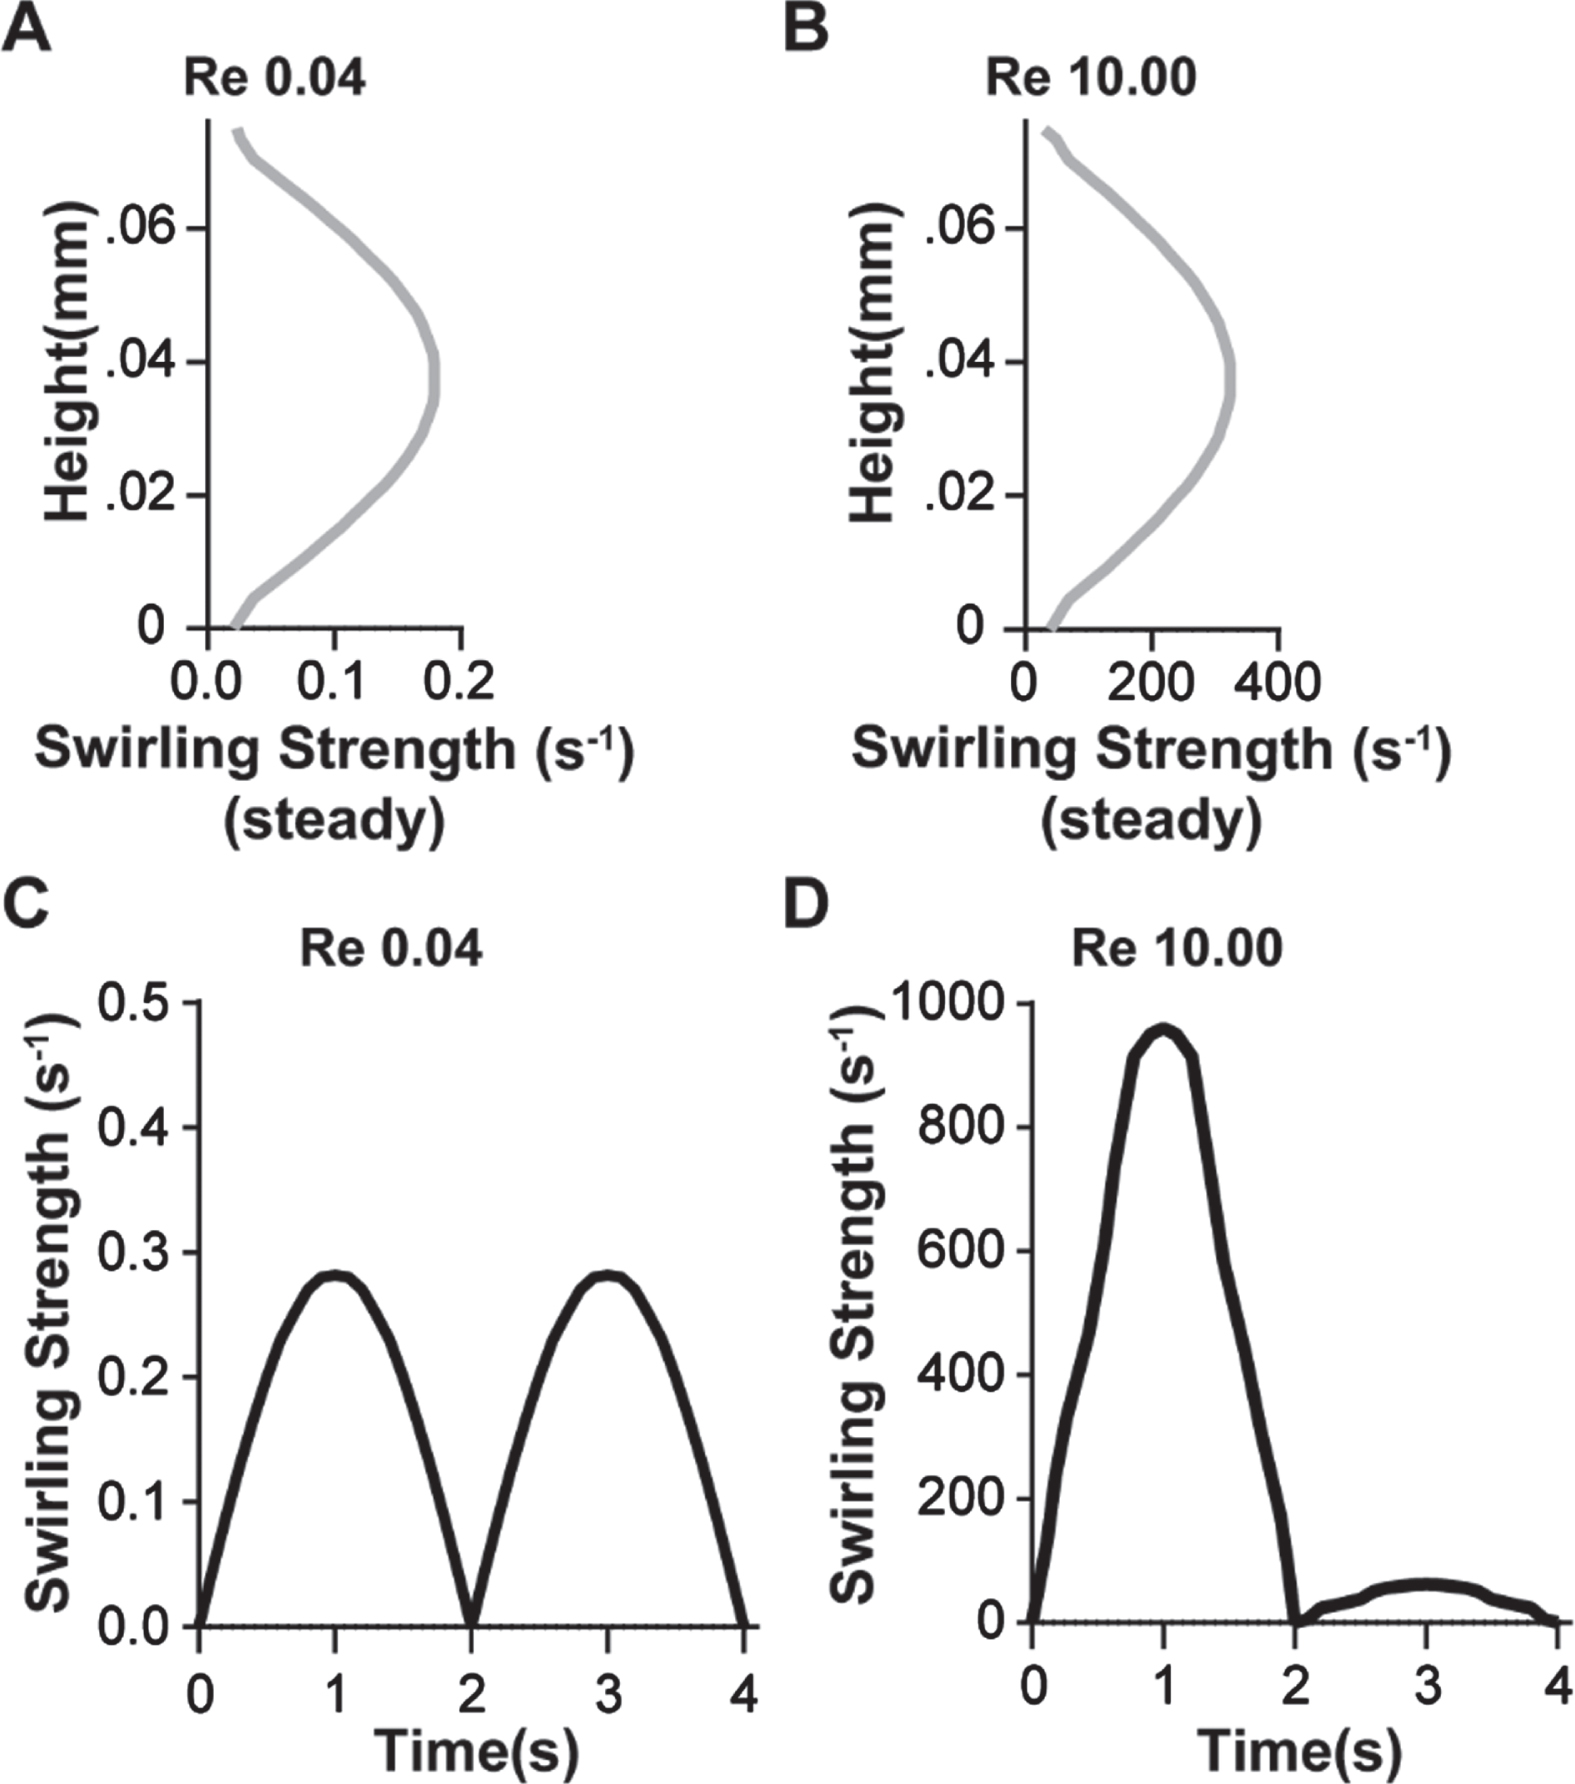
3D vortex characterization at venous valves. Graph showing the variation of swirling strength of the primary vortex along the height of the 3D venous valve at (A) Re = 0.04 and (B) Re = 10.00 (red). Graph showing the transient variation of swirling strength of the primary vortex at the 3D venous valve at (C) Re = 0.04 and (D) Re = 10.00.
Non-actuating venous valves are known to influence the fluid flow patterns that limits oxygen transport into the cusps fueling hypoxic inflammation of cusp endothelium [13]. Hypoxic inflammation of the deep venous valves is one of the mechanisms that triggers thrombus formation, which ultimately leads to DVT formation. So, we aspired to predict how changes of flow pattern in the micro venous valves due to changes in magnitude, direction, and the rate of change of velocity may regulate the transport and distribution of oxygen in the venous valves. To find the distribution of oxygen at the venous valves under different flow conditions, we superimposed the mass transport equations of diffusion and forced advection on the fluid flow domain (Equation 7.0–8.0). Once the contour plot and streamlines matched (Fig. 7A-B), we simulated the mass transfer of oxygen at different flow rates corresponding to Re 0.04 and 10.00. We consider the inlet concentration and initial concentration of oxygen in the system to be 2.22 mols/m3, which corresponds to 5% oxygenated blood that is observed in the veins [33]. The endothelium at the walls of the veins including the venous valves is assumed to absorb oxygen at a rate of 3.2e–9 mol/(m2s) [34] and therefore, we kept that as a reaction wall boundary in our model. The bulk oxygen in the system is assumed to be transported by a combination convection and diffusion, where the coefficient of diffusion of oxygen was 1.62e–9 m2/s [35]. Simulations of oxygen transport in the venous valve cusps revealed that the oxygen concentration at the venous valve cusps were higher at Re 10.00 compared to Re 0.04 (Fig. 7C-D). Therefore, these in silico results showed that bulk transport of oxygen by convection plays a crucial role in the transport of oxygen to the valve cusps compared to diffusion. Oxygen concentration at the abyss of the venous valve cusps were tracked for transient flows and compared with the concentration at steady flow (Fig. 7E-F). These results showed an interesting trend where the transient flow profile at Re 0.04 has lower oxygen concentration at the abyss compared to the steady flow at Re 0.04. This may be because the oxygen transport at the valves is dominated by advection and the transient sine wave at Re 0.04 has near stasis systemic flow for a considerable interval of time (Fig. 2A & B). However, this observation was reversed for Re = 10.00. At Re = 10.00, the transient flow had the higher oxygen content at the valve cusp abyss for most of the time period (77%) compared to the steady flow (dotted vertical lines in Fig. 6G). This result appears consistent as the transient profile has velocities higher than the steady flow at Re 10.00 and the transient flow does not have a near stasis systemic flow for a considerable interval of time (Fig. 2A & C). Importantly, these in silico results for oxygen transport suggest that the cusp of a non-actuating micro venous valve have lesser chances of becoming hypoxic under steady systemic flow compared to deep veins and thus prevent the hypoxic inflammation of the valve endothelium at the micro venous valve cusps and consequently prevent thrombus formation. Therefore, this computational study provides a basis for experimental validation of this hypothesis.
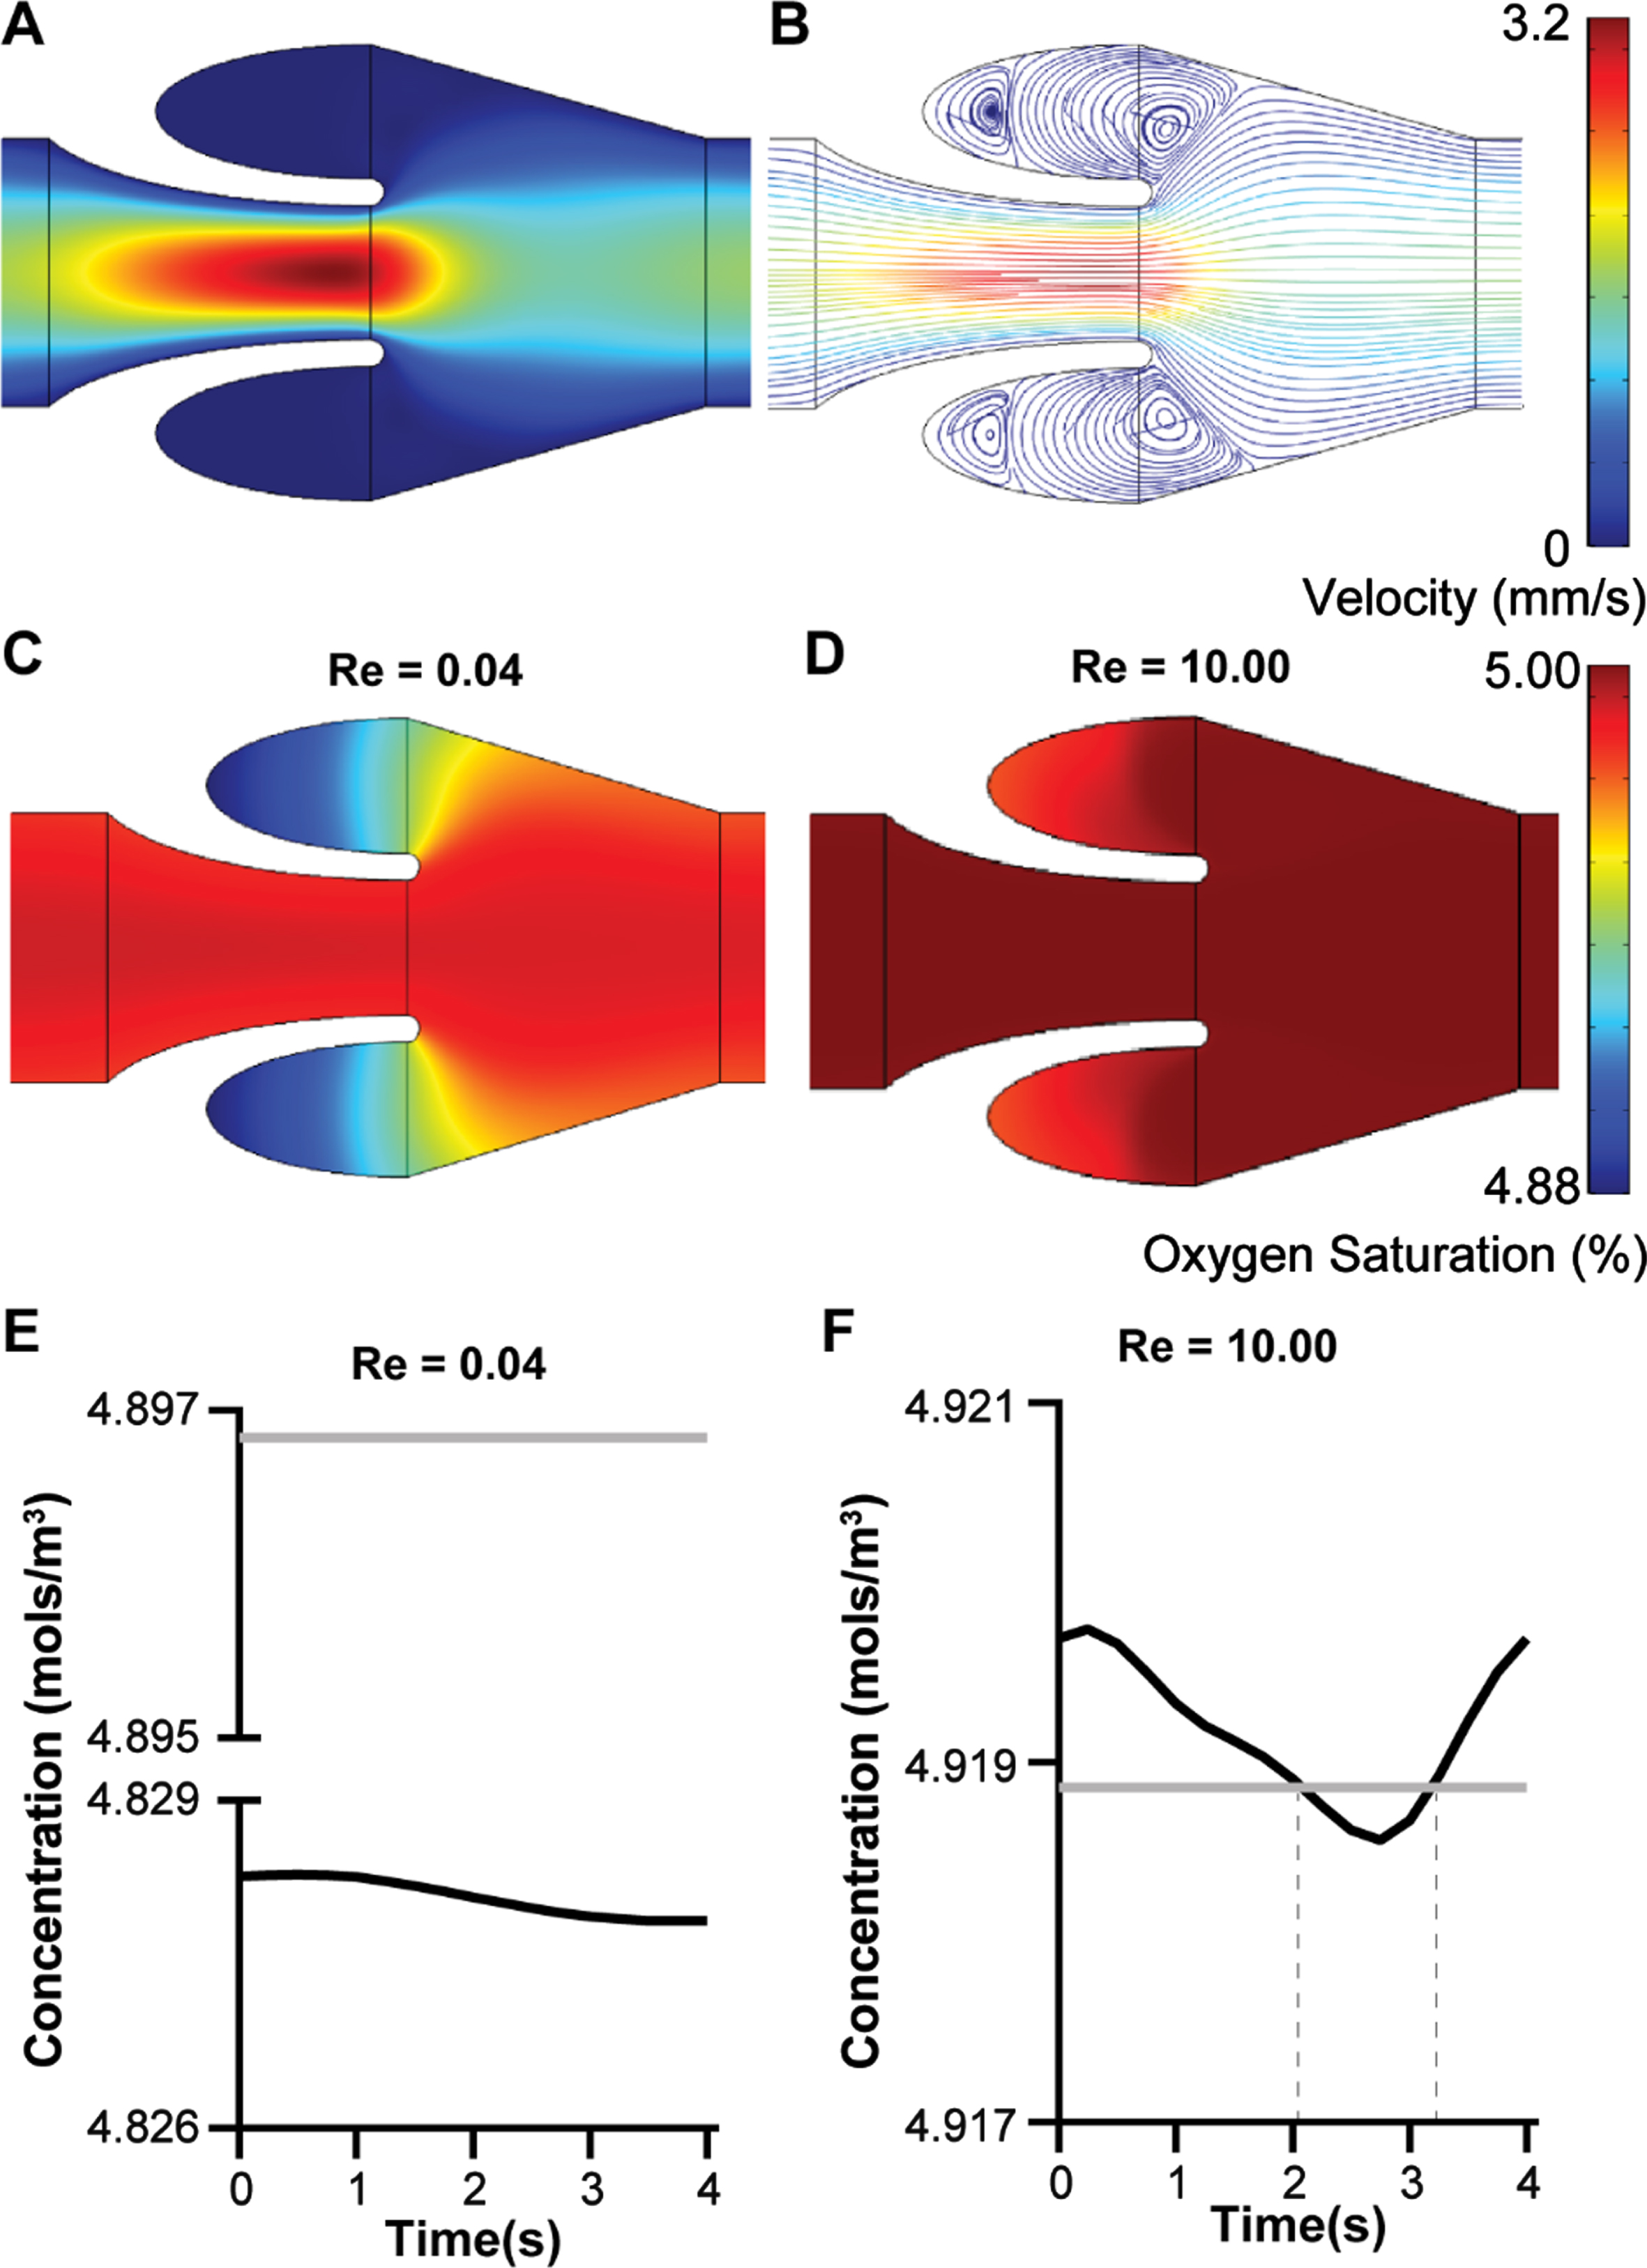
Mass transport of oxygen in the venous valves. (A) Velocity contour and (B) streamline plot of whole blood flow in the venous valves. Contour plot of the distribution of oxygen concentration under different steady flow condition (C) Re = 0.04 and (D) Re = 10.00. Graph showing the transient variation of oxygen concentration at the venous valve cusps for (E) Re = 0.04 and (F) Re = 10.00, under steady flow (grey line) or a transient sinusoidal flow profile (black line).
In the current study, we introduced a model of a micro venous valve and the complex fluid flow patterns associated with the non-Newtonian blood flow through them. We showed that the shear thinning blood tend to become highly viscous and stagnant at the low shear regions of venous valve cusps. This stagnation region is generally formed in the region below the primary vortex fromed at the mouth of the venous valve cusps. Though the strength of the primary vortex varies in a transient flow, the stagnation region was still present in the venous valve cusps. In transient flow, we also observe oscillations happening behind the valves, which leads to the change in vortex size. It is difficult to monitor this phenomenon in the in vivo venous valves due to their location (deep tissue) and the limitations in the imaging techniques available. Also, our study reveals that the stagnant flow inside the micro venous valves are not enough to create hypoxic inflammation that can lead to endothelial inflammation. We only see a drop from 2.22 mol/m3 (5% weight per volume in blood) of oxygen in the vein to 2.16 (4.88 % weight per volume in blood) mol/m3 of oxygen in the venous valve cusps under Re = 0.04 flow. The oxygen content in the cusps are above pathological hypoxic levels which is less than 1% oxygen (weight per volume in blood). The oxygen tranport into the cusps are improved by an increase in the systemic flow of blood in the veins. Therefore, even in pathological state of thrombosis, the underying vascular inflammation may not be regulated by hypoxia but by the abrupt and vortical shear forces. This is a novel hypothesis that can be experimentally validated by contemporary in vitro models, such as a vein-chip [22]. Finally, we showed that the 3D models may predict a different location of fluid vortices within the cusps relative to the 2D models due to the wall effects, and therefore may be required when more accurate predictions are needed.
We have modelled the pathological state of a micro venous valve where the stiffening of the valve leaflets lead to non-actuation of the venous valves. This replicates a pathological model as venous valves are observed to grow stiffer and become rigid with old age [36, 37]. The endothelium of stiffened valve leaflet tips may possibly be exposed to high shear stresses as observed in our simulations (Fig. 4H). These local and concentrated shear stresses at the lead let tip endothelium may potentially lead to endothelial damage and inflammation, which is hitherto unknown. Pathological conditions such as varicose veins (where dilation of venous walls may happen) and paralysis of the legs, which are known to cause venous insufficiency are known to cause valvular stasis [13]. Our results are comparable with many contemparary works on the blood flow simulations at the venous valves [4, 8]. Further, since veins are more compliant than arteries, they have an elliptical cross-section and the nature of the ellipse is a function of pressure. At typical low pressure, a vein can therefore, be approximated to a rectangle with a wide length and a narrow width [38]. Our in silico approach is consistent also with the most common in vitro experimental approaches, that have yielded a wealth of knowledge about vein flow and physiology [22, 39]. Therefore, we have the advantage that future work could be directed easily to cross-validate our in silico model with in vitro models and vice versa. However, like any other model, our model also has limitations. For example, in a healthy micro venous valve, the leaflets of the venous valves actuate and they open and close with time. This healthy actuation of a venous valve and the fluid dynamics of blood related to actuation are not captured in our present model, which may be overpredicting the shear stress at the valve leaflet tips in our models relative to in vivo. Simulation of an actuating venous valve would need a more complex fluid structure interaction (FSI) model where the fluid flow of blood affects the opening of the valve and the opening of the valve inturn affects the fluid dynamics of blood in the region till an equilibrium is reached. These simulatons in 3D need large structural deformation of the valve leaflets and subsequent change of fluid flow domain, mesh deformation and re-meshing in each iteration. Though our models do not incorporate this complex fluid structure interaction, the transient analysis is still able to predict results that are approximations of actual flow. However, a more complex FSI model can be designed that would be an improvement to the current approach.
We also use a continuum model with non-Newtonian generalised power law model to capture the complex fluid flow dynamics of whole blood. However, blood is not a continuum and is madeup of blood cells which act as particle. This limitation of the present model can be improved by modelling blood with a more advanced and devloping technique such as the discrete element method [40]. Though such simulations may give more accurate results, they may come at a computational cost and the resulting flow patterns and oxygen transport values may not change orders of magnitude.
Conclusion
In summary, our computational study provides a prediction about the fluid dynamics of blood in a micro venous valve and its implications on valve heath, and thrombus formation, which can be a foundation for more efficient preclinical experimental approaches.
Footnotes
Acknowledgments
We thank Dr. Michael J McShane at the department of Biomedical Engineering at the Texas A&M University for sharing the COMSOL Multiphysics v5.2 license with us for conducting this study. This project was supported by the NHLBI of NIH under Award Number R01HL157790 and R44HL145860, NIBIB of NIH under Award Number R21EB025945, NSF CAREER Award number 1944322, Osciflex LLC, Texas A&M Engineering, and President’s Excellence in Research Funding Award of Texas A&M University.