
Abstract
BACKGROUND AND OBJECTIVE:
Microfluidics is a useful tool for investigating blood microrheology. The study aimed to present the development of a microfluidic device for assessing the microrheological properties of blood cells’ suspensions and its application in patients with diabetes mellitus type 2 (T2DM).
METHODS:
A new microfluidic device was elaborated, connected to a system, including a microscope with a digital camera, a pump with a manometer and a computer with specially developed software. Blood cells’ suspensions were investigated in a microchamber between two parallel optical slides within a 100μm distance. The motion of the blood cells in the microchamber was observed by the microscope and it was recorded and visualized by a digital camera. A method for evaluating the deformability of blood cells and a device for its implementation were used [1].
RESULTS:
The pressure and flow rate ranges in the microfluidic device were specified by model suspensions of beta-ferroxy-hydroxide and red blood cells (RBC) suspensions. The pressure changes, realized by a pump (micropipette), connected to a manometer were established and the corresponding shear rates in the microfluidic device were determined. Data about the blood microrheological properties like RBC aggregation and deformability, leukocyte adhesion from a group of healthy volunteers and from patients with T2DM were obtained.
CONCLUSIONS:
The developed device and experimental system is a promising tool for the study of blood microrheology.
Keywords
Introduction
Currently microfluidic approaches are becoming increasingly popular for investigation of blood microrheology - RBC deformability [1–7] and RBC aggregation [8, 9]. The advantages of these technics allow small sample sizes, effective cost, small amounts of waste, relatively fast data evaluation etc. Fluid flow behaviour in microfluidic systems can differ greatly from macroscale systems. Dimensionally microfluidics is within the scale of 1–1000μm. This small scale results in low Reynolds number, thus realizing laminar flow with viscous forces more significant than inertial ones. Intramolecular surface forces and boundary layers may also play a larger role in a microfluidic system compared to a macro system. These factors need to be taken into consideration when designing a microfluidic system.
All blood cells interact among themselves and with epithelial cells by mechanisms that depend on adhesion molecules as well as by several forces involved in the interaction, such as Van der Waals attraction forces and repulsive electrostatic forces [10]. Using a 100μm microchannel flow chamber, the in vitro adhesion of flowing leukocytes and erythrocytes aggregation and deformability can be studied by mimicking laminar flow in vivo into blood vessels. The aim of the flow microchamber studies is to find a relationship between the microrheological parameters of the blood and the leukocyte adhesion under flow conditions. Based on the obtained experimental data and images of the studied diluted cell suspensions, erythrocyte aggregation and deformability were determined, as well as leukocyte adhesion and their dependence on different pressure drops, respectively different shear rates. The changes in the microrheological properties of the blood and their effect on RBC aggregation and deformability and leukocyte adhesion are analyzed as associated with vascular disorders in patients with different diseases, in particular type 2 diabetes mellitus.
The study aimed to present the development of a microfluidic device for assessing the microrheological properties of blood cells’ suspensions and its application in patients with T2DM.
Materials and methods
Scheme of the microfluidic chamber and the experimental setup
The principal scheme of the microfluidic chamber, adapted from Muravyov et al. [1, 11] is shown on Fig. 1.

Scheme of the microfluidic chamber.
Based on it the microfluidic device was developed with the following constant geometry and dimensions of the rectangular channel: length of the inner working (experimental) part of the microchamber Lm of 30 mm, width Wm of 14 mm and thickness of 100μm respectively (Fig. 2). The inlet and outlet openings are the same and unchanged.
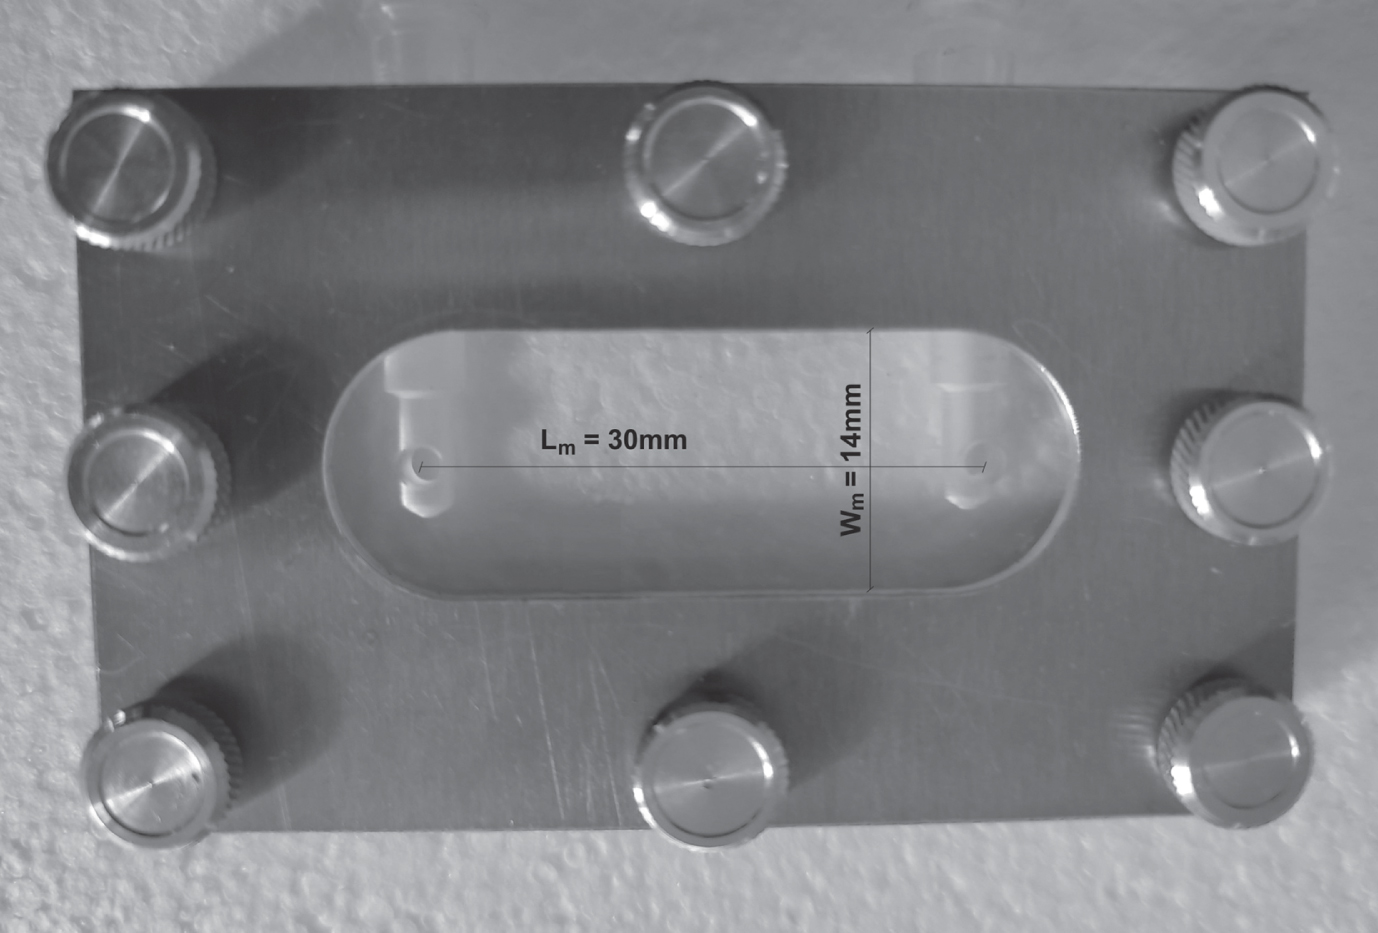
Photo of the developed flow microchamber with length Lm = 30 mm and width Wm = 14 mm.
The chamber with indicated dimensions was created in the form of a “sandwich” [2, 12], consisting of plexiglass basement that does not deform under given conditions, a film (the thickness of which was measured with a micrometer and it also did not undergo deformation changes when pressure was applied to the chamber), a cover glass rigidly fixed with a titanium plate from above. Therefore, the geometry of the chamber was always unchanged and constant. It is important to emphasize that in our microfluidic chamber the upper (glass) and bottom plexiglass parts, forming the 100μm microchannel have close hydrophilicity providing equal conditions on the two microfluidic chamber walls.
The experiments with the microchamber are realized in the following manner: the microchamber is filled with a model suspension or with diluted blood cells’ (erythrocyte or leukocyte) suspensions by a micropipette. The microfluidic device (chamber) –1, is placed on the microscope object table (Fig. 3). The pressure differences are created by the pump (micropipette) –3 and measured with the digital manometer - 5. The test suspension moves under the applied pressure of 20, 30 or 40 mmH2O. The shear rates in the microchamber change in accordance with the applied pressure. There are two reservoirs attached to the microchamber - one in which the test suspension is placed and another into which it moves after passing through the microchamber. The flow of the suspensions is observed under a microscope –2 and the process is recorded with a video camera - 2. The obtained images are analyzed with a computer with special software for image analysis - 6. The system is tested with model suspensions of beta-ferroxy-hydroxide and with a highly diluted suspension of erythrocytes to specify and validate the experimental conditions: pressure range, flow rate, etc.

Photo of the experimental setup with the developed microfluidic device. 1- Flow microchamber, 2-microscope with a digital camera, 3-pump (micropipette), 4-tap, 5- digital manometer (model 82012-4), 6-computer with special software for image analysis.
An optical binocular microscope (Optika, model B-192, at magnification x40 and magnification of the eyepiece x10) connected to a digital camera (Optika 5.1 MP, model C-B5) is used to observe the processes taking place in the flow microchamber. (Fig. 3.).
In the flow, the erythrocytes attach to the lower wall of the microchamber at one “point", deformed by the shear flow in dependence with the created deformation rate (Fig. 4).

The image of RBCs at rest and under shear flow in the microchamber; 1 –the image of the nondeformed erythrocyte at rest; 2 –the deformed erythrocyte attached by one point to the bottom wall of the channel and elongated by the shear flow; 3 –an example of elongation (deformability) index (EEI) estimation, where L –is the length of an elongated cell, W –is the elongated cell width (arrow indicates the flow direction) [1].
Two typical examples of calculating the relation between the applied pressures, shear stresses and shear rates for isotonic solution of NaCl and isotonic solution +Dextran250 (Dx250) at a temperature of 20°C, using formula (1) are presented in Table 1.
Values of the pressure, shear stresses and shear rates in the flow microchamber
where τ is shear stress, P is the pressure in N/m2, h is the height of the microchamber in meters (m), Lm is the length of the inner working (experimental) part of the microchamber in m or correspondingly
As for calculating the shear rate - γ, for this the following formula is used:
or shear rate = shear stress / viscosity.
As the viscosity is known, we first have the calculated value of the shear stress, and then, based on Equation 2, we calculate the corresponding shear rates (Table 1).
When we use physiological isotonic NaCl solution (buffer), at 20 °C its viscosity is 1.10 mPa.s (0.0011 Pa.s or 0.0011 N/m2) –see Table 1, case a)). When we use a mixture of isotonic solution + Dextran 250 (70 + 30%), then the viscosity of such a liquid is 1.30 mPa.s (at a temperature of 20 °C) or 0.0013 Pa.s or 0.0013 (N/m2) –see Table 1, case b).
Blood samples - Preparation of erythrocyte and leukocyte suspensions
Blood samples were prepared and collected by venepuncture (using K2EDTA as anticoagulant), by special medical staff in Uni Hospital, Panagyurishte, Bulgaria. Experiments were carried out on peripheral blood samples from healthy volunteers (control group) and from patients with T2DM. Whole blood samples from healthy volunteers were used to prepare diluted suspensions from erythrocytes in solution of Dextran 250.
Erythrocytes and leukocytes have been isolated from each blood sample of both groups of 15 healthy volunteers and 15 patients with T2DM, from peripheral blood with K2EDTA (total 6 ml) by centrifugation for 15 minutes at 1500 rpm by a Janetzki T 23D centrifuge.
The erythrocyte suspension, separated from the whole blood was twice washed with physiological solution and centrifuged (5 minutes at 800 rpm). The hematocrit of the concentrated erythrocyte suspension was measured by a TH12 microhematocrit centrifuge and adjusted to a hematocrit Hct = 40% by addition of the calculated amount of saline. From the erythrocyte suspension with Hct = 40%, 10μl are pipetted and added to 1 ml of Dextran 250 (Dx 250) solution - with a concentration of 3 g/dl (in physiological solution), to stimulate erythrocyte aggregation. Thus, to fill the microchamber, the Hct = 40% suspension was diluted 100 times.
Leukocyte suspensions were prepared after centrifugation; the plasma is pipetted off and the “white diaper” of leukocytes obtained on the erythrocyte suspension was collected. 10 ml of 0.83% ammonium chloride solution in a ratio of 1:10 was added to the separated leukocytes. The resulting suspension is allowed to stay for 10 minutes to “destroy” the erythrocytes that have fallen into the leukocyte suspension during their separation. Then, the leukocyte suspension was twice washed with saline and centrifuged for 5 min, at 1500 rpm.
These samples were used to determine the erythrocyte aggregation index (EAI) and erythrocyte elongation (deformability) index (EEI). Diluted suspensions of leukocytes in isotonic buffer solution and Dx250 were also tested to measure the leukocyte adhesion index (LAI).
We chose the original composition of the incubation medium (isotonic Ringer’s solution + dextran of medium density. The ratio of the components allowed us to maintain the physiological values of pH = 7.4 and osmolarity - 300 mOsm/l) for erythrocytes, which allowed to ensure efficient attachment of erythrocytes (point-attached red blood cells) to the bottom of the microchamber and efficient aggregation of erythrocytes.
Methodology
Study of the aggregation of erythrocytes
The flow microchamber is filled with 1 ml of the prepared diluted 100 times erythrocyte suspension in Dx250. Since, in addition to recording the deformability of individual erythrocytes in a microchamber, we measured the viscosity of their suspensions (to assess the total flow deformation of erythrocytes) at a relatively high shear rate (γ between 251.44 s-1 and 502.90 s-1), we prepared a suspension strictly with Hct = 40% (at a constant viscosity suspension medium).
The preparation of the suspension was controlled by determining the hematocrit. Then, to fill the microchamber, the Hct = 40% suspension was diluted 100 times. Naturally, in all samples and always, the hematocrit (the concentration of cells in the volume) remained constant.
The microchamber is placed on the microscope slide, connected to the manometer and the micropump. The test sample is allowed to remain for 15 minutes at room temperature, after which 10 photographs are taken at random sites of the sample with formed in them erythrocyte aggregates. The obtained images are analyzed with specific software - “Program for determining the degree of aggregation of blood cells” [13], calculating the erythrocyte aggregation index (EAI) for each image:
To assess the erythrocyte deformability in flow, the erythrocyte suspension in the microchamber is subjected to sequential pressures of the order of 20 mm water column (196.13 Pa), 30 mm water column (294.19 Pa) and 40 mm water column (392.26 Pa), creating shear rates of respectively 251.4 s-1, 377.17 s-1 and 502.9 s-1. In the flow, at the corresponding deformation rate, the erythrocytes are attached to the lower wall of the microchamber at one “point”, elongated by the shear flow (See Fig. 4) [1, 14]. The erythrocytes deforming in the flow of the microchamber are recorded with a digital video camera. Then, frames are taken from the video records at maximum erythrocyte elongation - at the appropriate rate of deformation. The obtained images are analyzed with a specific software [15] for calculation of the erythrocyte elongation index (EEI) - for each studied rate of deformation:
The elongation indices of erythrocytes in a flow microchamber (τ= 0.54 N/m2), calculated in two ways are:
1) EEI1 = L / W (According to G.M. Artmann [2]); the elongation index (EEI1), where L and W are the length and width (the major and minor axes) of the deformed cell respectively
2) EEI2 = (L-W) / (L + W), n = 100 (the length and width of 100 deformed erythrocytes were measured).
The correlation coefficient obtained from comparison of the calculated by the two different formulas elongation (deformability) indices (EEI1 and EEI2) was R = 0.997 (Fig. 5).

Regression relationship between the elongation indices of erythrocytes in a flow microchamber (τ= 0.54 N/m2), calculated in two ways.
To study the leukocyte adhesion the microchamber is filled with 1 ml of the prepared diluted leukocyte suspension in Dx250. To assess the leukocyte adhesion, the leukocyte suspension in the microchamber is subjected to sequential pressures of the order of 20 mm water column (196.13 Pa), 30 mm water column (294.19 Pa) and 40 mm water column (392.26 Pa), creating shear rates, respectively 251.44 s-1, 377.17 s-1 and 502.9 s-1. The leukocyte adhesion index (LAI) was calculated by the formula (5):
where Sl2 is the total area of adhered leukocytes in the corresponding image and S1 is the total observed area.
The relative index of leukocyte adhesion - α is calculated according to the formula (6):
where LAI0 is the leukocyte adhesion index at the initial moment (at zero shear rate - at rest), LAI is the leukocyte adhesion index at a corresponding shear rate. The relative index of leukocyte adhesion indicates how much of the resting leukocytes adhered to the wall of the flow microchamber at the respective shear rate.
Data analysis was performed using the software packages Sigma Plot 11.0. All data are presented as mean±SD (standard deviation). The significance of differences was evaluated using the t-test and the Mann-Whitney Rank Sum Test. Differences were accepted as significant at p < 0.05.
Experimental results in healthy volunteers and in patients with T2DM
By the developed microfluidic device, the influence of the shear rate on the aggregation and deformation of suspension of erythrocytes, leukocytes in mixed isotonic solution and Dx250 were studied. The influence of the shear rate on the leukocyte adhesion to the walls of the microchamber was also studied. Data about the blood microrheological properties as RBC aggregation and deformability, leukocyte adhesion for a group of healthy subjects and from patients with type 2 diabetes mellitus (T2DM) were obtained.
Red blood cells aggregation
On Fig. 6 the difference between RBC aggregation in healthy subjects and in diabetics is observed. In the healthy subjects, individual small erythrocyte aggregates are seen. In the RBCs suspension samples from patients with T2DM, erythrocytes form relatively large aggregates (“rouleaux”) which form branched networks. The images of erythrocyte aggregation in a healthy subject and in a patient with diabetes mellitus type 2 on Fig. 6 represent only one visual field of the sample examined with the flow microchamber. For each sample, 10 randomly selected images were analyzed.

Red blood cell aggregation, observed in healthy volunteer (a) and in a patient with T2DM (b). Images are obtained at rest by the microfluidic device.
The erythrocyte aggregation index (EAI) was calculated using the formula (3). A difference between EAI for healthy subjects and T2DM patients was found. The erythrocyte aggregation index EAI was increased in patients with type 2 diabetes mellitus as compared to healthy volunteers (Table 2).
Mean values and standard deviations of EAI (Erythrocyte Aggregation Index) of the control group of healthy subjects and of patients with T2DM [16]
It is worth noting that the formation of large aggregates or “rouleaux” (Fig. 6), which are grouped together to form networks and three-dimensional aggregates, has been also estimated by the Myrenne aggregometer in T2DM patients [17]. The formation of large aggregates or “rouleaux” (Fig. 6), which are grouped together to form networks and three-dimensional aggregates, is the cause of the so-called hyper viscosity in patients with T2DM [18–20]. The optical technique for measuring RBC aggregation has been developed and implemented in commercial aggregometers including LORCA (Mechatronics, The Netherlands), Erythro-aggregometer (Regulest, France) and Myrenne-aggregometer (Myrenne, GmbH, Germany). Although these methods and instruments can measure RBC aggregation, most of them require a labor-intensive cleaning process after each measurement in comparison with the developed microfluidic device. Thus, they, while useful in a research setting, are not optimal for day-to-day clinical use. Furthermore, most current techniques adopt a high-speed rotational shearing system to disperse RBC aggregates, which causes the instruments to be complex and expensive.
In the microfluidic device, the cell progressively elongates in the direction of the flow as the shear stresses increase, taking the shape of a prolate spheroid, producing an ellipse in the observation plane of the microscope. Thus, the shape of the deformed RBCs can be described by a single parameter, EEI (Eq. 4), determined by the measurements depicted in Fig. 4 and Fig. 7.

Images, captured from the video, obtained using the microfluidic device: elongated erythrocytes from a healthy volunteer - (a, b, c) and from a patient with T2DM (d, e, f), under different shear rates: a), d) 251.44 s-1; b), e) 377.17 s-1; c), f) 502.9 s-1.
The results show, that in patients with T2DM, the EEI was statistically significantly reduced in all applied shear rates compared to the data in healthy individuals (Table 3, Fig. 7). The mean values of EEI in the patients with T2DM decreased, accordingly with 18% (p = 0.036) at γ= 251.44 s–1, 26% (p = 0.013) at γ= 377.17 s–1 and 26% (p = 0.015) at γ= 502.9 s–1, compared to the data in the control group.
Mean values and standard deviations of the Erythrocyte Elongation Index (EEI) of the control group of healthy volunteers and in patients with T2DM
t-test *p < 0.05; **p < 0.01; ***p < 0.005.
In the same studied group of patients with T2DM, negative correlations were found between the erythrocyte elongation index EEI at shear rates of 251.44 s-1 and 377.17 s-1, determined with the flow microchamber and the apparent dynamic whole blood viscosity of the blood samples determined with the Low Shear 30 rotational viscometer within the high shear rate range - from 11.02 s-1 to 51.2 s-1 (Table 4). The observed increased blood viscosity in the T2DM patient group compared to the control group at these shear rates is due to reduced erythrocyte deformability. The negative correlations found were between –0.51÷–0.56 (p≤0.05) at a shear rate of 251.44 s-1 in the microchamber and the whole blood viscosity measured in the range of 11.02 s-1 to 51.2 s-1. At a shear rate of 377.17 s-1 in the microchamber and the whole blood viscosity measured in the range of 11.02 s-1 to 51.2 s-1 the correlations varied between –0.68÷–0.70 (p≤0.005). Comparison of viscometric method for determination of deformability of erythrocytes, evaluating whole blood viscosity at high shear rates and the erythrocyte elongation index EEI at shear rates of 251.44 s-1 and 377.17 s-1, determined with the flow microchamber, verifies the method of estimation of the deformability of erythrocytes with the developed system with the flow microchamber.
Linear correlation coefficient (r) between the erythrocyte elongation index EEI at shear rates of 251.44 s-1 and 377.17 s-1, determined with the flow microchamber and the apparent dynamic whole blood viscosity determined with the Low Shear 30 rotational viscometer at 37 °C in T2DM patients’ group (n = 15)
t-test *p < 0.05; ***p < 0.005.
Similar results to those obtained by us using the microfluidic device (Table 3; Fig. 7) were also established by optical, filtration, ectacytometer etc. experimental methods [17–27].
Muravyov et al. also found [17] that the deformability of erythrocytes in patients with T2DM decreased by 12% compared to controls, assessed by a flow microchamber at a shear stress of 2 Pa, in suspensions of erythrocytes in Dextran 200. The deformability of erythrocytes in diabetic patients was again found to be lower compared to healthy controls by K. Tsukada et al. [21], evaluated in vitro, using transparent microchannels of crystalline substrates as capillary models. Ektacytometry studies have shown that EEI in diabetic patients is reduced by 10% compared to control measurements [22]. A significant decrease in EEI is associated with a decrease in erythrocyte deformability in diabetes [23], which was also found by the filtration method [24, 25]. A significantly lower deformability index was found in patients with T2DM and diabetic retinopathy compared to control group of healthy subjects using the “optical tweezers” method [26].
Red blood cell microrheological variables were estimated by means of the microfluidic device and in patients with cerebrovascular disease (CVD) and peripheral arterial disease (PAD) by A. Muravyov et al. [11] after 4 weeks of pentoxifylline therapy - after the cell incubation with pentoxifylline and some phosphodiesterase (PDE) inhibitors. The marked RBC deformability changes were observed after the in vitro cell pentoxifylline treatment. In another study Muravyov et al. [27] found only slight alteration of the RBC deformability index, evaluating the effect of some antitumor chemotherapy drugs on red blood cell deformability by means of microfluidic device with a parallel plate flow channel.
The images of adhered leukocytes (Fig. 8) show that as the shear rate increases, the number of adhered leukocytes decreases in healthy individuals and in patients with T2DM. Leukocytes retain their round shape as the shear rate increases, both in the control group of healthy individuals and in patients with T2DM.

Images, captured from the video of leukocytes suspensions, adhered to the wall of the microfluidic device, from a healthy subject (a, b, c, d) and from patient with T2DM (e, f, g, h) at the following shear rates: a), e) rest (0 s-1); b), f) 251.44 s-1; c), g) 377.17 s-1; d), h) 502.9 s-1.
The results show that the relative index of leukocyte adhesion (α) decreases in the examined samples of leukocyte suspensions from the control group of healthy individuals and in patients with T2DM, with a shear rate increase (Table 5; Fig. 8). It is seen that the adhesion of leukocytes decreases as the shear rates increase (for both controls‘ group and the group with T2DM). For diabetic patients the relative index of leukocyte adhesion (α) is higher, compared with healthy subjects.
Mean values and standard deviations of the relative index of leukocyte adhesion (α, relative units) - at different shear rates, in the control group of healthy individuals (n = 15) and in the group of patients with T2DM (n = 15)
t-test *p < 0.05; **p < 0.01.
The described microfluidic device and method applied elucidated the effects of blood rheology on the leukocyte adhesion properties under flow - in physiological conditions (healthy subjects) and in pathological states (T2DM patients). By evaluating leukocyte adhesion, endothelial dysfunction and subsequent vascular disorders can also be assessed. The results obtained with the flow microchamber could serve as objective biomarkers for diagnosis and monitoring of the microvascular complications in T2DM.
Advances in microfluidics applications have made it possible to design microsystems, in which various processes, including diagnostics and fundamental research in biofluids, can be performed. J. C. Cluitmans et al. [5] developed a microfluidic system to study RBC flow behaviour in a microcirculation-mimicking network. In addition to assessing deformation in microchannels with dimensions like those of microcapillaries, the relaxation to the discocyte shape was also monitored. This approach enables the evaluation of the effect of heterogeneity within the RBC population. C. Londrero et al. [6] determined simultaneously parameters of adhesion and deformability of erythrocytes through a microfluidic device that uses an inverted optical microscope with new technologies for image acquisition and analysis. K. Seki et al. [7] investigated the relationship between blood rheology, assessed by the microchannel method using the passage time and the hemorheological factors in healthy subjects. S. Shin et al. [8] integrated conventional equipment, such as a vibration-induced disaggregation mechanism, a disposable microfluidic channel and a laser–photodiode system into a noble, disposable aggregometer. The analysis of platelet aggregation and thrombosis kinetics also has significantly advanced with progress in microfluidic technology [29].
A system with a microfluidic device and a microchannel with a height of 100μm was built. Deformability and aggregation of erythrocytes and adhesion of flowing leukocytes were studied in vitro, using the microfluidic device, simulating in vivo conditions in blood vessels, where microchannels imitate microvascular flows. The developed microfluidic device was used for assessing the microrheological properties of blood cells’ suspensions in patients with T2DM and in a control group of healthy subjects. Experimental data were obtained for the changes of the microrheological parameters - aggregation and deformation of erythrocytes, as well as adhesion of leukocytes at different shear rates. From the results obtained, their effect on the number and behavior of leukocytes, which adhere to a model of a vascular wall under the conditions of flow in microchannels, imitating microvascular flows, is evaluated.
This microfluidic device provides reliable information since it allows an in vitro at real time visualization of two RBC processes (aggregation and deformability) and leukocyte adhesion under different flow conditions. Both increased aggregation and reduced RBC deformability, increase the apparent viscosity of blood which can have implications for physiological blood flow.
The developed microfluidic device and methods offer: firstly, to simultaneously record aggregation in one blood sample (the first phase of measuring the microrheology of erythrocytes) and secondly, their deformability (the second phase, when erythrocytes sediment and attach “point-attached RBCs” to the bottom of the chamber), thirdly, if a dosed concentration of leukocytes of a given blood sample is added to a suspension of erythrocytes, then their adhesion is also measured by the known “washing method”. In addition, visualization of cells in a microchamber makes it possible to accurately assess the shape of erythrocytes (discocytes, echinocytes, stomatocytes, spherocytes, etc.) and, knowing the frame area (it is constant in the microphoto), calculate the percentage of certain erythrocyte morphologies. The method does not require consumables and/or disposable cartridges.
Footnotes
Acknowledgments
The financial support of the Bulgarian National Scientific fund - Project KII-06-H27/13 from 2018:”Development of experimental microfluidic system and methodology for assessing microrheological properties of blood. Analysis of the peripheral vasomotor reactivity and vascular endothelial function in patients with type 2 diabetes mellitus” is greatly acknowledged. The study was realized and within the agreement between the Dept. of Biomechanics at the Institute of Mechanics at the Bulgarian Academy of Sciences and the Surfaces and Colloids Section of the Institute of Physical Chemistry at the Bulgarian Academy of Sciences.
Informed consent statement
“Informed consent was obtained from all subjects involved in the study”
Conflicts of interest
The authors declare no conflict of interest.
“The authors comply with the Ethical Guidelines for Publication in Clinical Hemorheology and Microcirculation as published on the IOS Press website”.