
Abstract
BACKGROUND:
Acute kidney injury (AKI) is a common complication of sepsis, with the burden of long hospital admission. Early prediction of AKI is the most effective strategy for intervention and improvement of the outcomes.
OBJECTIVE:
In our study, we aimed to investigate the predictive performance of the combined model using ultrasound indices (grayscale and Doppler indieces), endothelium injury (E-selectin, VCAM-1, ICAM1, Angiopoietin 2, syndecan-1, and eNOS) as well as inflammatory biomarkers (TNF-a, and IL-1β) to identify AKI.
METHODS:
Sixty albino rats were divided into control and lipopolysaccharide (LPS) groups. Renal ultrasound, biochemical and immunohistological variables were recorded 6 hrs, 24 hrs, and 48 hrs after AKI.
RESULTS:
Endothelium injury and inflammatory markers were found to be significantly increased early after AKI, and correlated significantly with kidney size reduction and renal resistance indices elevation.
CONCLUSIONS:
Using area under the curve (AUC), the combined model was analyzed based on ultrasound and biochemical variables and provided the highest predictive value for renal injury.
Introduction
Sepsis is a common and frequently fatal condition in which mortality has been consistently linked to increasing organ dysfunction. It is the most common cause of acute kidney injury (AKI) in critically ill patients [1]. AKI occurs in 40–50% of septic patients and increases mortality six to eight-fold [2]. High serum urea and creatinine are routinely recommended as AKI diagnostic markers, however, previous markers do not reflect the early tubular cell injury but rather the delayed consequences of the injury [3, 4].
Hemodynamic instability is often recognized during sepsis. It interferes with renal perfusion and oxygen delivery. A pathophysiological connection is recognized between microvascular injury and inflammatory tubular injury. A drop in the renal blood flow during sepsis consequently results in vasoconstriction, with subsequent acute tubular necrosis [5–7]. Areas of sluggish peritubular flow trigger inflammatory mediators [8, 9]. Thus, the hemodynamic instability seems to proceed the rising in serum creatinine [10], however, the precise value of hemodynamic instability in the prediction of sepsis-associated AKI is limited.
Growing evidence suggests that endothelial injury occurs early in the pathology of AKI and deteriorates with progression to chronic kidney disease (CKD) [11]. The endothelium is recognized as crucial for adjusting the vascular tone and the permeability of the blood vessel. Endothelial cell injury and blood cell aggregation impact higher resistance, and thus contribute to the early microperfusion decline [12, 13]. Pro-inflammatory cytokines alter the expression of cell adhesion molecules (such as selectins, vascular cell adhesion molecule (VCAM), Intercellular Adhesion Molecules (ICAM), angiopoietin 2 and syndecan-1), which results in endothelial shedding and interactions between Leukocyte and endothelial cells [14–16]. Furthermore, endothelial and inducible nitric oxide (NO) synthase (eNOS/iNOS) imbalance may result in the generation of peroxynitrite, which may contribute to the tuning of flow by increasing the resistance [17, 18]. Current data on quantifying endothelial injury generally concentrate on their predictive value in the context of AKI. However, it remains uncertain whether sepsis-induced AKI can be predicted using endothelial markers.
Ultrasound is a non-invasive imaging technique that is classically used to assess the renal size, echogenicity, renal hilum, and vascularity [19]. Using ultrasonography Doppler to measure renal resistive indices (RRIs) (resistive index (RI) and pulsatility index (PI)) are also currently tested to characterize the flow velocities in intraparenchymal renal arteries, but current clinical studies have demonstrated that RRIs alone have limited predictive value [20, 21]. Simultaneous assessment of endothelial injury markers may provide an effective supplement to RRI to reflect the impact of the endothelial injury on renal vasculature.
To the best of our knowledge, the predictive value of combined biochemical parameters and ultrasound indices for AKI has not been previously described. The principal goal of this study was to evaluate the usefulness of the combined model for the prediction of AKI and non-AKI in endotoxemic rats. We speculated that combining renal ultrasonography and biochemical variables would better predict AKI.
Material and methods
Animals
Sixty adult female Wister albino rats (110–150 g) were included in the current study. The animals were obtained from the animal care unit of the Faculty of Medicine, Cairo University. All rats were housed in groups with a 12 h dark/light cycle and unlimited access to food and water. Animals were allowed to acclimatize for 1 week before the start of the experiment. The experimental study procedures and interventions were in accordance with the institutional animal care and use guidelines of Cairo University (IACUC, no. CU III F 14 22)
Experimental design and study protocol
The rats were randomly allocated into 2 main groups (n = 30 per group): the Control group and Lipopolysaccharide induced acute kidney injury group (LPS-AKI). The animals in LPS-AKI groups were intraperitoneally (i.p.) injected with a single dose of LPS from E. coli, strain 055: B5 (5 mg/kg) dissolved in saline [22]. Thereafter, both the control & LPS-AKI groups were subdivided into 3 subgroups: 6 hours, 24 hours, and 48 hours. Rats were placed in metabolic cages for urine collection for 6 hours, 24 hours, and 48 hours following saline or LPS injection. At each time point, the animals were sacrificed, and serum, urine, and renal tissues were collected.
Urine was centrifuged, the supernatant was collected and stored at –20°C. A total of 5 ml of blood was harvested from the retro-orbital venous plexus, and were centrifuged at 3000 rpm for 10 minutes for serum separation. The obtained serum samples were stored at –20 °C till used for analysis.
The left kidney, left renal artery and aorta from each rat were obtained for morphological assesment.
Ultrasound analysis of renal size and vasculature
Rats were ultrasound scanned before and after induction of acute kidney injury by an investigator with 16 years of experience in ultrasound.
Ultrasound examination of the left kidney was performed using a 15L8 w linear transducer of the ultrasound imaging system (EvoTouch ultrasound; Quantel Medical, Cournon d’Auvergne, France), as previously described [23]. The gain, frequency, depth, and focus were adjusted manually (15 MHz, Depth 20 mm, Focus 8–15 mm, Gain 35–55). Rats were anesthetized with an i.p. injection of a mixture of ketamine (120 mg/kg) and xylazine (12 mg/kg), and were laid supine on a heated mattress to keep their temperature normal throughout the procedure. A pre-warmed gel was placed on the shaved skin for ultrasound application. Real-time standard B-mode examination of the kidney was performed in a long-axis view. The gray scale parameters included: renal length (measured as the greatest pole-to-pole distance in the sagittal plane), renal thickness (measured as the maximum transverse axis in the hilar region), cortical thickness (measured from the outer border of the medullary pyramids to the renal capsule), medullary length (assessed perpendicular to the medullary thickness), cortical echogenicity (an area of approximately 1 cm2 in the cortex was assessed using the standard histogram function of Adobe PhotoshopCC2019) and corticomedullary differentiation [24–26]. Following the color-Doppler mapping of the aorta, renal, and left intra-renal vascular tree using a frequency of 15 MHz, a cursor was placed at the artery, and flow velocity was measured using pulse wave Doppler. The angle between the long axis of the vessel and the Doppler beam was adjusted to be less than 60°. Systolic and diastolic velocities were recorded. The aorta, renal, and intrarenal arteries resistance parameters (RI and PI) were determined as follows [27]: RI=(PSV–EDV)/PSV, and PI=(PSV–EDV)/MV. Where PSV is peak systolic velocity, EDV is end-diastolic velocity, and MV is mean velocity).
Estimation of renal function
Serum urea level was measured using an enzymatic colorimetric assay (BioMed Systems, Egypt). Creatinine was determined by a Colorimetric kit obtained from (BioMed Systems, Egypt). The optical density was adjusted at 550 nm [28]. Glomerular filtration was assessed by creatinine clearance (CCr) based on serum and urine creatinine levels, with values expressed in mL/min/kg, according to the following formula: Creatinine clearance (CCr) (ml/min./kg)=[urinary Creatinine (mg/dl) X urinary volume (ml)/serum Creatinine (mg/dl)] X [1000/ body weight (g)] X [1/1440 (min.)] [29, 30].
To quantify serum and urinary sodium, QuantiChrom TM assay (Biovision, USA) was used.The fractional excretion of sodium % (FENa %) was calculated using the following formula [31]: FENa (%)=(urine/serum sodium) / (urine/serum creatinine) X 100.
Enzyme-Linked Immunosorbent Assay (ELISA)
Tissues & urine samples were used to quantify the biomarkers of renal injury (Kidney Injury Molecule-1 (KIM-1)), renal fibrotic transforming growth factor-β1 (TGF-β1), endothelium injury markers (E-selectin, VCAM-1, and ICAM-1), and inflammatory cytokines (tumor necrosis factor-alpha (TNF-a), interleukin-1beta (IL-1b)), using enzyme-linked immunosorbent assay (MyBioSource, USA).
Samples were added to 96-well plates (100μl/well) and incubated overnight at 4°C. The remaining protein-binding sites were then blocked by incubating samples for 1.5 h with a blocking buffer containing 2% fetal bovine serum at 37°C. Primary anti-rat KIM-1, anti-rat TGF-β1, anti-rat E-selectin, anti-rat VCAM-1, anti-rat ICAM-1, anti-rat TNF-a, and anti-rat IL-1b monoclonal antibodies (dilution, 1 : 1,000) and goat anti-mouse IgG secondary antibodies (dilution, 1 : 2,000) were added to bind specifically with the target antigen. The plates were read at 490 nm using a microplate reader.
Quantitative RT-PCR
Syndecan-1 & angiopoietin-2 mRNA was quantified in tissue & urine samples using qRT-PCR analysis. The total RNA was extracted using Qiagen tissue extraction kit (Qiagen, USA), therafter, the reverse was transcribed into cDNA with PrimeScript reverse transcription Master Mix (Fermentas,USA).The qRT-PCR analysis was performed using an Applied Biosystem with software version 3.1 (StepOne™, USA).The PCR primer sequences for angiopoietin-2; forward primer::5’-5-AAACCACACGGCCACCAT -3, Reverse primer:5’- TGGATTTCAAGACGGGATGT -3, for syndecan-1; forward primer: 5- CAGCAGCAACACCGAGAC -3, Reverse primer: 5- GATTGGCAGTTCCATCCTC -3, and for Beta actinβ; Forward primer: 5′-TGTTTGAGACCTTCAACACC-3′, Reverse primer 5′-CGCTCATTGCCGATAGTGAT-3
Histopathological and immunohistochemical evaluation
Following deparaffinization and rehydration, tissue sections were stained with Hematoxylin-Eosin and masson trichrome for histopathological observation. Five kidney sections from each rat were randomly selected and evaluated at×100 and×400 magnification for renal injury scoring. The degree of kidney damage was scored according to the following criteria: 0, normal; 1, area of damage=<25%; 2, area of damage = 25–50%; 3, area of damage = 50–75%; and 4, area of damage = 75–100% [32].
The degree of endothelial damage in the arterial wall was recorded on a 4 grade scale where 0 indicates no damage, 1 denotes minimal damage, 2 indicates mild damage, 3 signifies moderate damage and 4 is scored when there is severe endothelial damage.
Immunostaining of endothelial nitric oxide synthase (eNOS) was performed with the avidin-biotin peroxidase method as previously described [23], using rabbit polyclonal Anti-eNOS antibody (ab5589, 1 : 50, IHC-P, species reactivity including rats, Abcam®) via the automated staining protocol. The area percentage of eNOS expression in the kidney tissue, the count of eNOS immune-histochemically-positive endothelial cells as well as the area% of masson trichrome staining in the renal and arterial tissue were evaluated in five histological fields in a standard measuring frame of 85,550 mm under magnification 400 via Image J analyzer computer system (J Image Pro Plus6.0, Media Cybernetics, Silver Spring, MD, USA).
Statistical analysis
The sample size was estimated using the following equation: n = 1 + 2 C(s/d)2; Where s is the standard deviation, d is the difference to be detected, and C is a constant dependent on the value of α and β selected (For α to be (0.05) and 1- β to be (0.9), C is 10.51). Using GraphPad Software 5.0, analysis of variance two-way ANOVA was applied for the normally distributed data followed by the Bonferroni post hoc test to detect multiple comparisons among groups. Pearson’s correlation test was performed to detect the relationship between different variables among groups. The area under the curve was estimated using the Multivariate logistic regression and receiver operating characteristic (ROC) analyses performed by SPSS software. A significant difference was considered if the P-value was < 0.05.
Results
Kidney functions and histological characteristics of LPS-induced AKI
While Ccr was significantly decreased after LPS, serum creatinine, BUN, and FENa% levels were significantly increased in the LPS group after 24 hrs, compared with control groups. Previous data have referred to an increase of TGF-β1 during sepsis, which is a powerful profibrotic molecule that promotes the induction of fibrosis [33]. Consistent with previous findings, we found a significant increase in the level of urinary TGF-β1 compared to the control group after 6 h from LPS injection Table 1.
Time points alterations in renal function after LPS injection
Time points alterations in renal function after LPS injection
Data are expressed as mean±SE. BUN; Blood urea nitrogen, Cr clearance; creatinine clearance, FENa; fractional excretion of sodium, TGF-β1; Transforming growth factor-beta1. $P < 0.05 Vs corresponding control; *P < 0.05 Vs LPS 6 hrs; ∧P < 0.05 Vs LPS 24 hrs.
Characteristic histopathologic features of acute kidney injury, i.e., tubular degeneration with highly-vacuolated epithelial cells and sclerosed glomeruli (Fig. 1), were observed in LPS renal samples after 6 hrs. Compared to control groups, kidney injury scores were significantly elevated in the 24 and 48 h LPS groups Fig. 1. Histological analysis of arterial tissues revealed hypertrophy of the smooth muscle cell nuclei with separation of endothelial cells 24 hrs after LPS. Furthermore, we observed an increase in the endothelial injury score in the LPS 24 hrs and 48 hrs groups Fig. 1. Furthermore, glomerular and arterial collagen deposition significantly increased after 6 hrs in LPS-subjected rats Fig. 2.
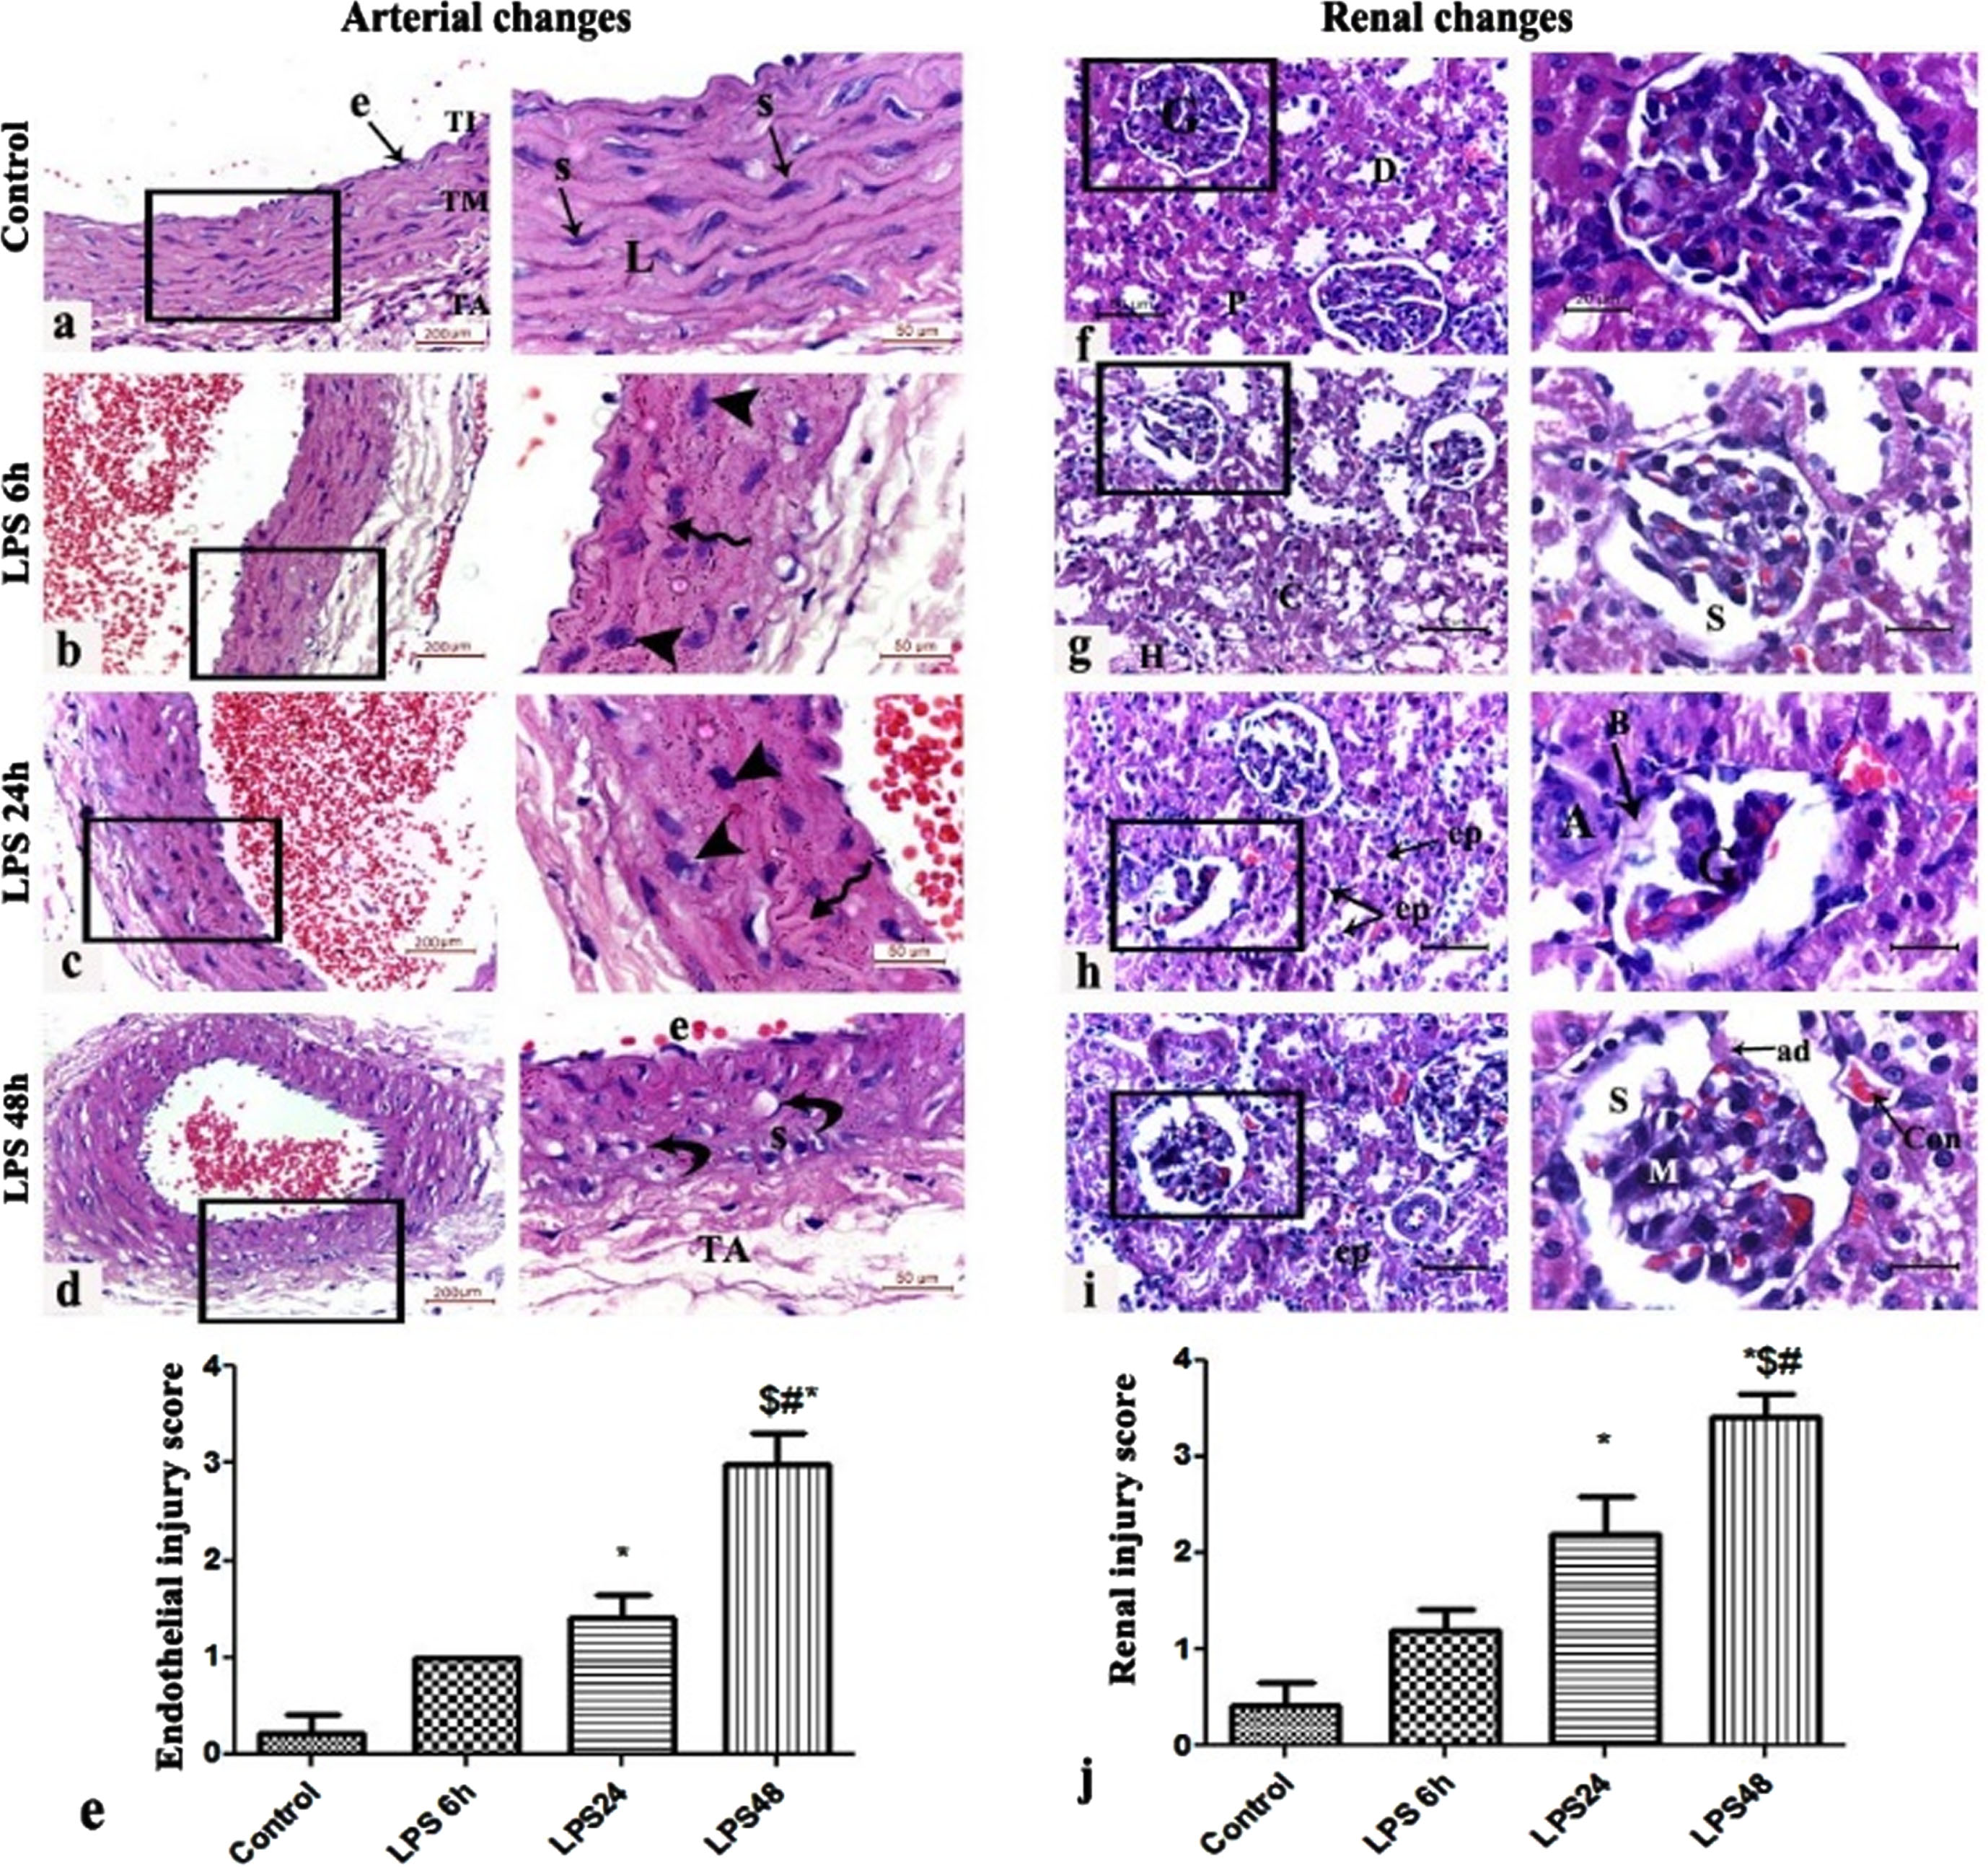
(a-e) Representative histological figures of H&E-stained sections of the wall of the abdominal aorta showing (a) control group with intact endothelial cells (e) lining the tunica intima (TI), regular elastic lamellae (L) and horizontally-oriented spindle-shaped smooth muscle cell nuclei (S) of the tunica media (TM), and normal tunica adventitia (TA), (b) LPS 6 h and (c) LPS 24 h showing hypertrophy of the smooth muscle cell nuclei (arrowheads) and irregularity of the elastic lamellae of the tunica media (spiral arrow) (d) LPS 48 h group showing separation of the tunica intima endothelial cells (e), vacuolar degeneration (curved arrows) and hyperplasia of the smooth muscle cell nuclei of the tunica intima and irregularity of the tunica adventitia. (e) Endothelial injury score, (n = 3).(f-j) Representative figures of renal H&E-stained sections of (f) Control group showing normal renal corpuscles formed of a glomerulus (G) surrounded by intact Bowman’s capsule and normal urinary space and macula densa. The PCTs exhibit the characteristic narrow lumen and cubical epithelial lining with dark acidophilic cytoplasm (P). The DCTs show wider lumen and pale acidophilic cubical cells (D). (g) LPS 6 h group shows distorted tubules with highly-vacuolated epithelial lining. Other tubules show intra-luminal hyaline (H) and cellular (C) casts. Higher magnification demonstrates retraction of the glomerular capillary tuft of capillaries widening of the capsular space (S). (h) LPS 24 h group shows tubular degeneration with separation of the epithelial lining of some tubules (ep), other tubules appear partially obliterated with desquamated epithelial and cellular debris. Higher magnification demonstrates sclerosed glomeruli (G) with a collapsed, segmented glomerular capillary tuft. The Bowman’s capsule (B) appears disrupted and irregular. The juxtaglomerular arteriole (A) appears thickened. (i) LPS 48 h group shows cortical tubules with intra-luminal exfoliation of their epithelial lining (ep). Congestion (con) of peri-glomerular and interstitial capillaries is also observed. Higher magnification demonstrates shrinkage of the glomeruli with widened urinary space (S) intervened by tuft-to-capsule adhesions (ad). Mesangial cell proliferation is also observed (M). (e) Renal injury score, (n = 5), (LPS, Lipopolysaccharide Group, (*P < 0.05 vs. control; #P < 0.05 vs. LPS6 h, $P < 0.05 vs. LPS24 h).
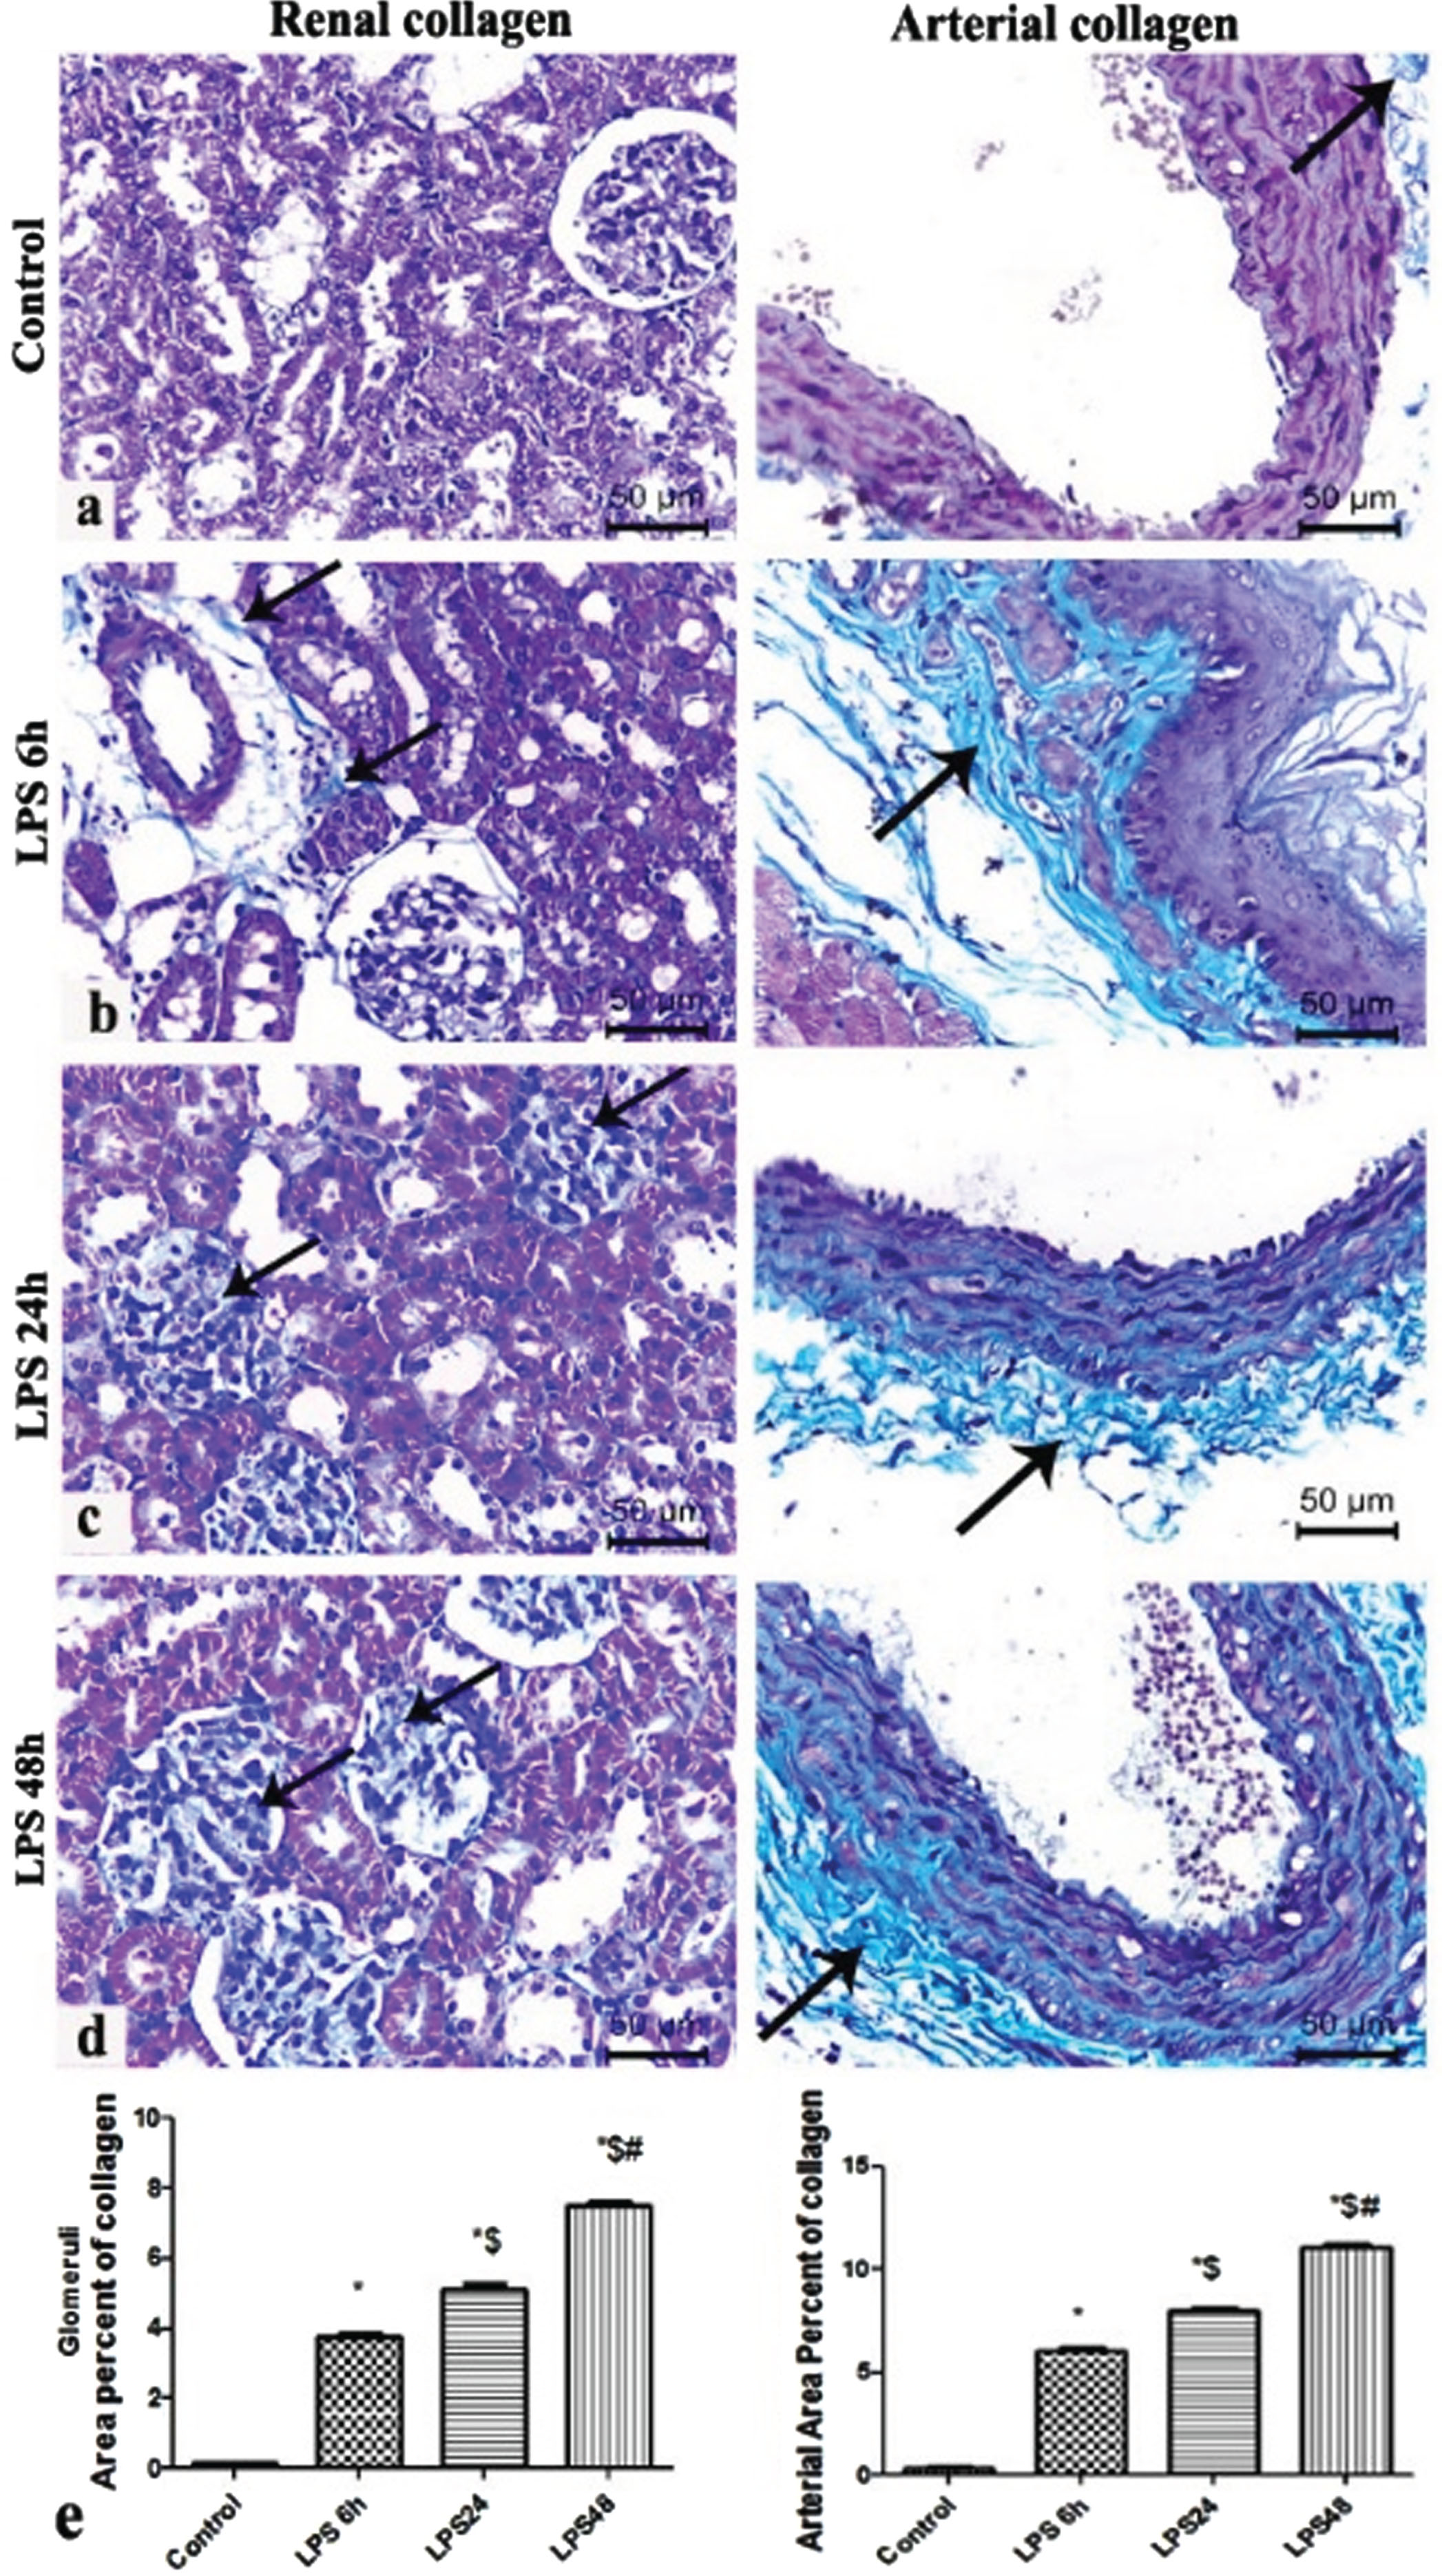
(A-E): Representative figures of Masson trichrome staining of (a) Control group (b) LPS 6 h group showing minimal perivascular deposition of collagen fibers around the renal arteriole and in the tunica adventitia of abdominal aorta (c) LPS 24 h group showing intra-glomerular and peri-arterial collagen deposition. (d) LPS 48 h group showing glomerulosclerosis and dens deposition of collagen bundles in the tunica adventitia and in-between the lamellae of the tunica media (e) Area percentage of glomerular and arterial collagen deposition in the different study groups *: significant versus control group, $: significant versus LPS 6 h, #: significant versus LPS 24 h, at p-value≤0.05 (n = 5).
Our results showed also that cortical echogenicity and RRI (RI & PI) in LPS groups showed a significant rising pattern with time and a significant difference between control and LPS groups. In LPS groups, RI and PI started to rise 6 hrs after LPS, whereas, cortical echogenicity was significantly elevated over control at 24 hrs. The renal length and thickness, cortical thickness, medullary length, Sys Vel, and Dias Vel of the LPS groups were manifestly lower compared with the control groups from 24 hrs to 48 hrs, with considerable differences Fig. 3.
The Sys Vel, Dias Vel, and RRI were calculated for all of the aorta, renal and intrarenal vessels. There was no significant difference in Sys Vel, Dias Vel, and RRI of the aorta and renal arteries between the control and LPS groups. However, LPS groups elicited a sustained significant increase in the intrarenal RRI with a statistically significant drop in Sys Vel and Dias Vel throughout the experiment Table 2, Fig. 3.
Comparison of Endothelium injury markers between AKI and non-AKI rats
The differences in renal, urinary, and immunostained endothelium biomarkers (E-selectin, VCAM-1, ICAM1, Angiopoietin 2, syndecan, and eNOS) were detected in renal injury groups earlier than the current standards renal function. The tissue endothelial markers of rats in the 6 hrs LPS group were significantly higher than that in the control group, and the difference in urinary endothelial markers (ICAM and angiopoietin) was also considerably different between the two groups after 6 hrs hrs Fig. 4. Additionally, a plot of endothelial injury markers and ultrasound intrarenal indices (RI and PI) demonstrated a significant positive correlation Fig. 4. In parallel, the expressions of renal artery inflammatory endothelium markers were observed to be significantly increased 6 hrs after LPS Fig. 5. Moreover, eNOS was noted to be significantly decreased in the immunostained arterial endothelium and glomerular capillaries 6 hrs after LPS injection Fig. 6.
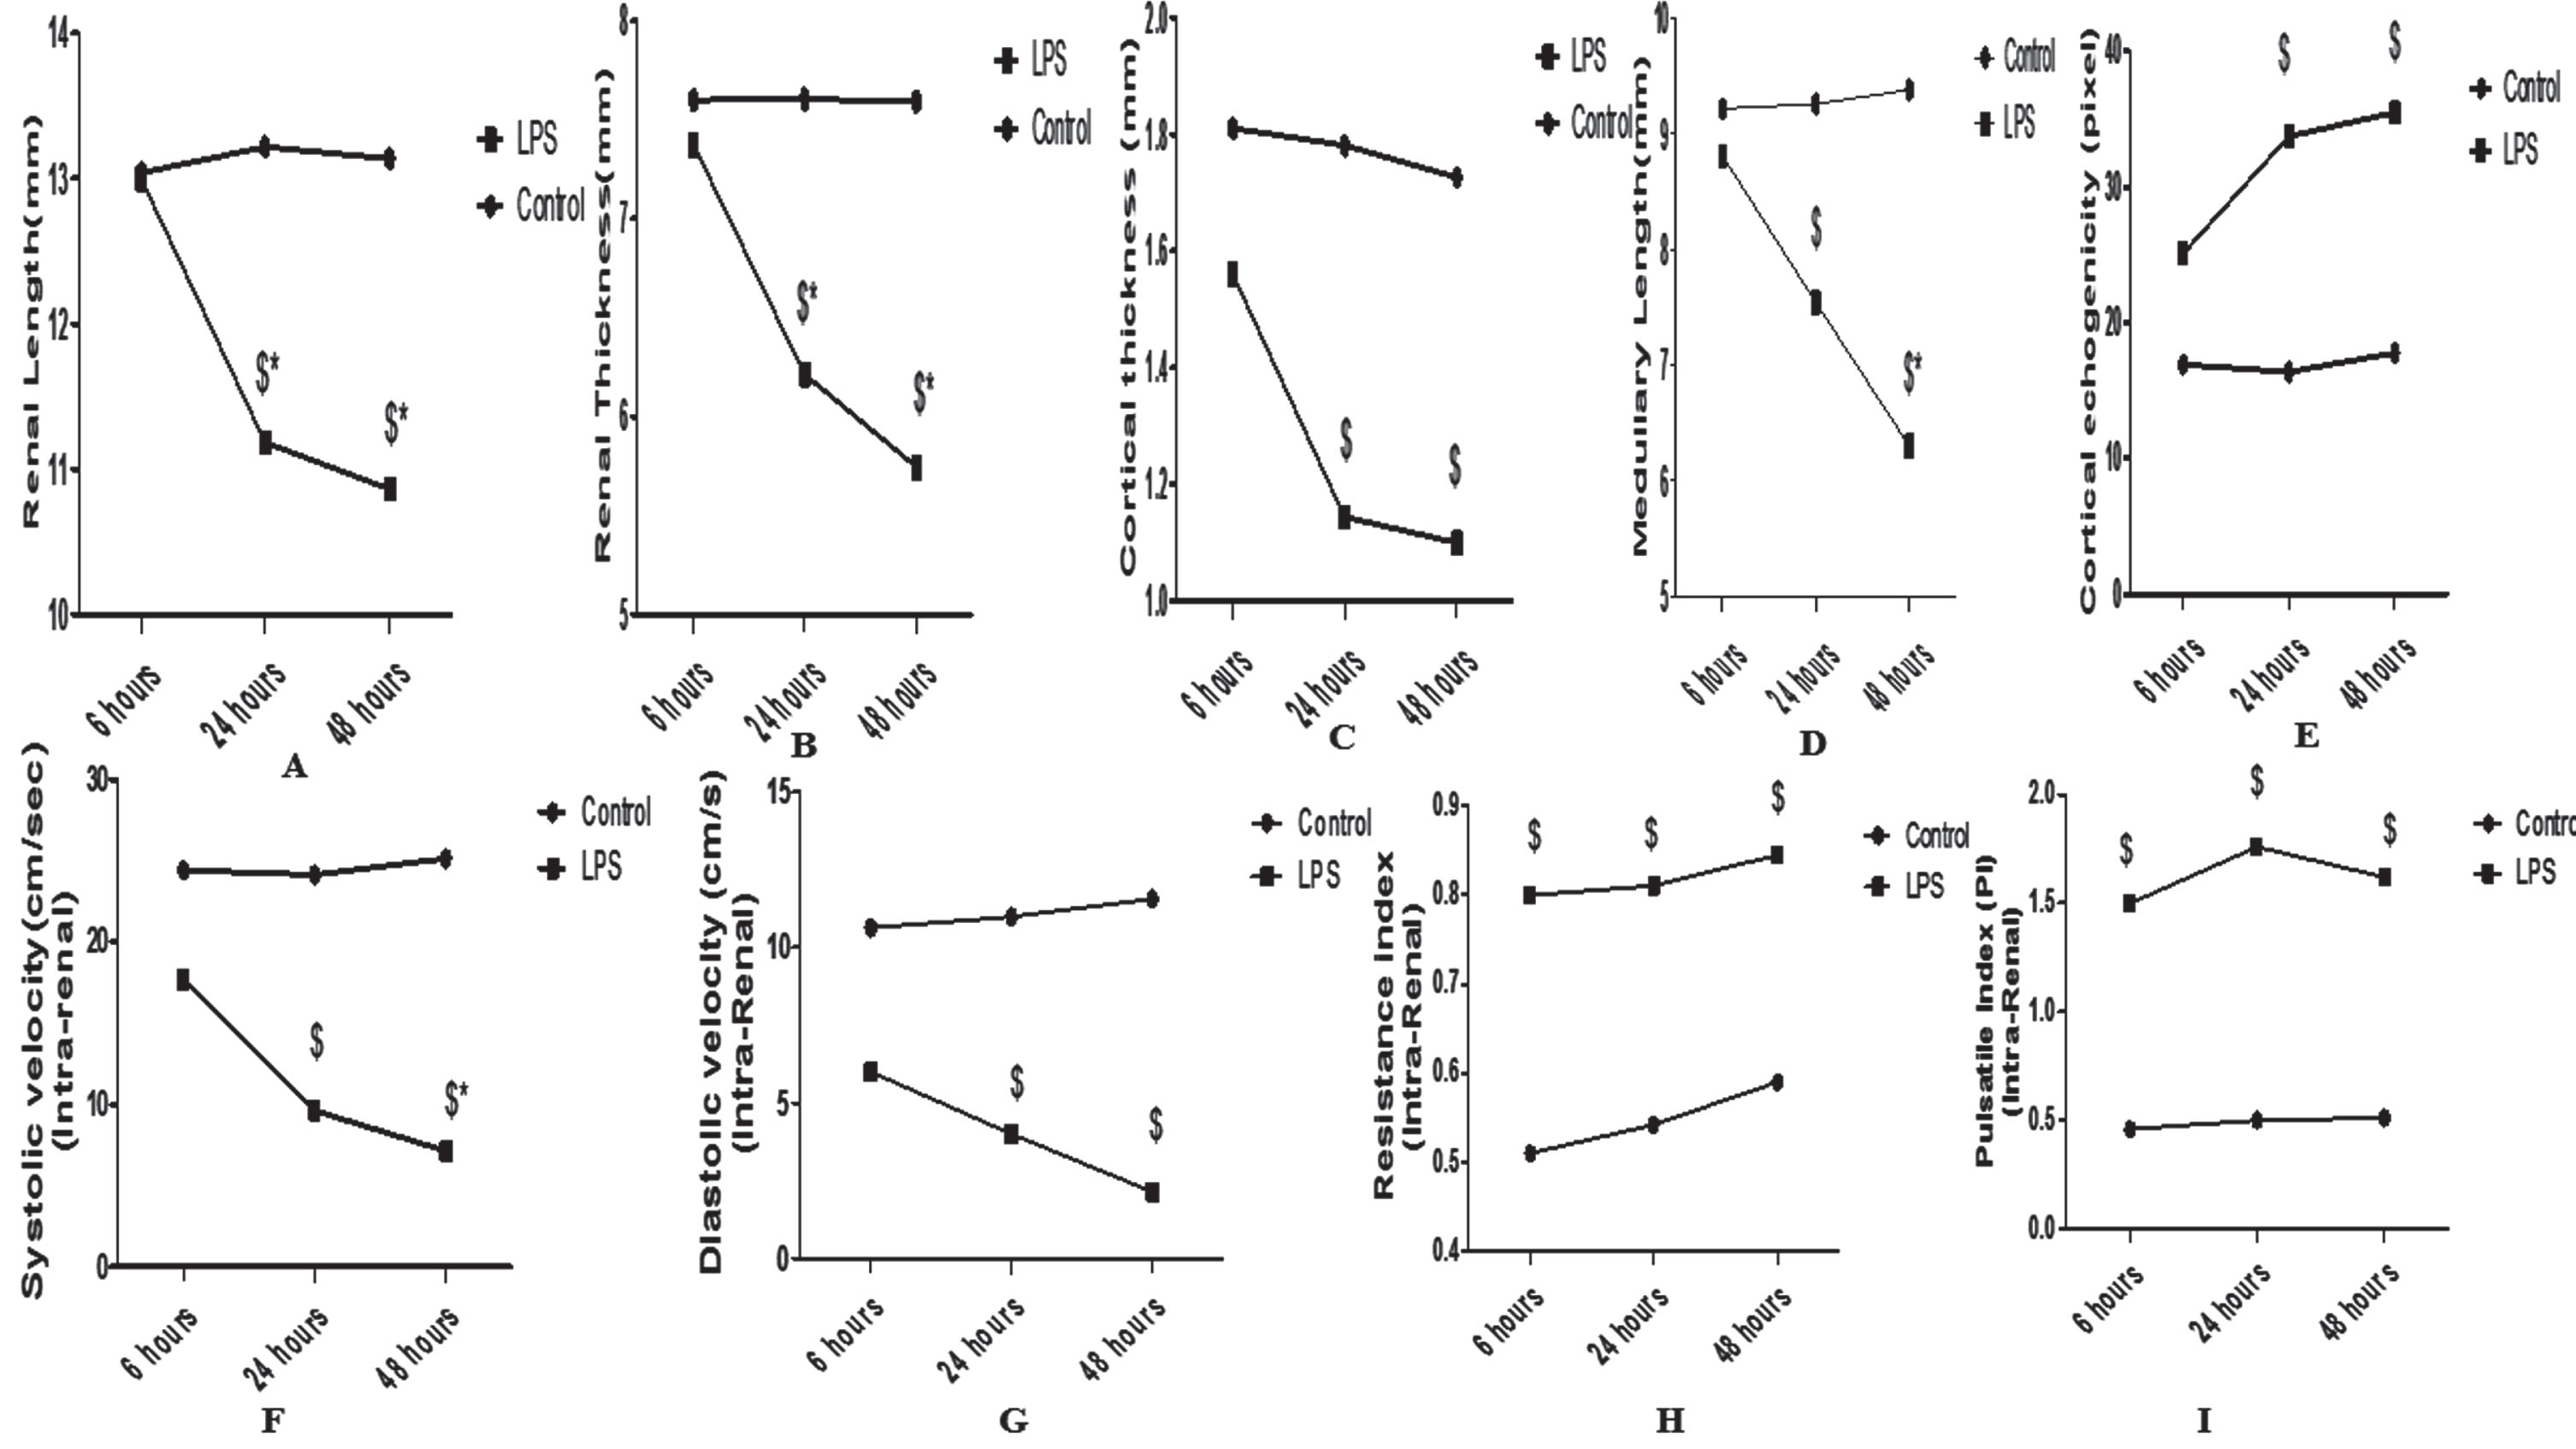
Lipopolysaccharide induces time point changes in grayscale ultrasonographic parameters (renal length (A), renal thickness (B), cortical thickness (C), medullary length (D), cortical echogenicity (E)) and Doppler ultrasonographic measurements of the intrarenal artery systolic velocity (F), diastolic velocity (G), resistance index (H) and Pulsatile Index (I). Data are presented as the mean±SE (n = 10 rats/group). $P < 0.05 vs corresponding controls, *P < 0.05 vs LPS 6 hrs, ∧P < 0.05 vs LPS 24 hrs.
Time points alterations in aortic and renal Doppler analysis
Data are expressed as mean±SE. $P < 0.05 Vs corresponding control; *P < 0.05 Vs LPS 6 hrs; ∧P < 0.05 Vs LPS 24 hrs.

(A-E) Lipopolysaccharide induces time point changes in urinary and renal endothelium injury markers (VCAM-1 (A), E-selectin (B), ICAM-1 (C), Angiopoietin (D), and syndecan (E). Data are presented as the mean±SE (n = 10 rats/group). $P < 0.05 vs corresponding controls, *P < 0.05 vs LPS 6 hrs, ∧P < 0.05 vs LPS 24 hrs. (F-O) Representative Pearson correlations between intra-renal resistance and pulsatile indices and endothelium injury markers (VCAM-1 (F-G), E- selectin (H-I), ICAM-1 (J- K), Angiopoietin (L-M), and syndecan (N-O). (Pearson correlation, n = 10 rats per group).
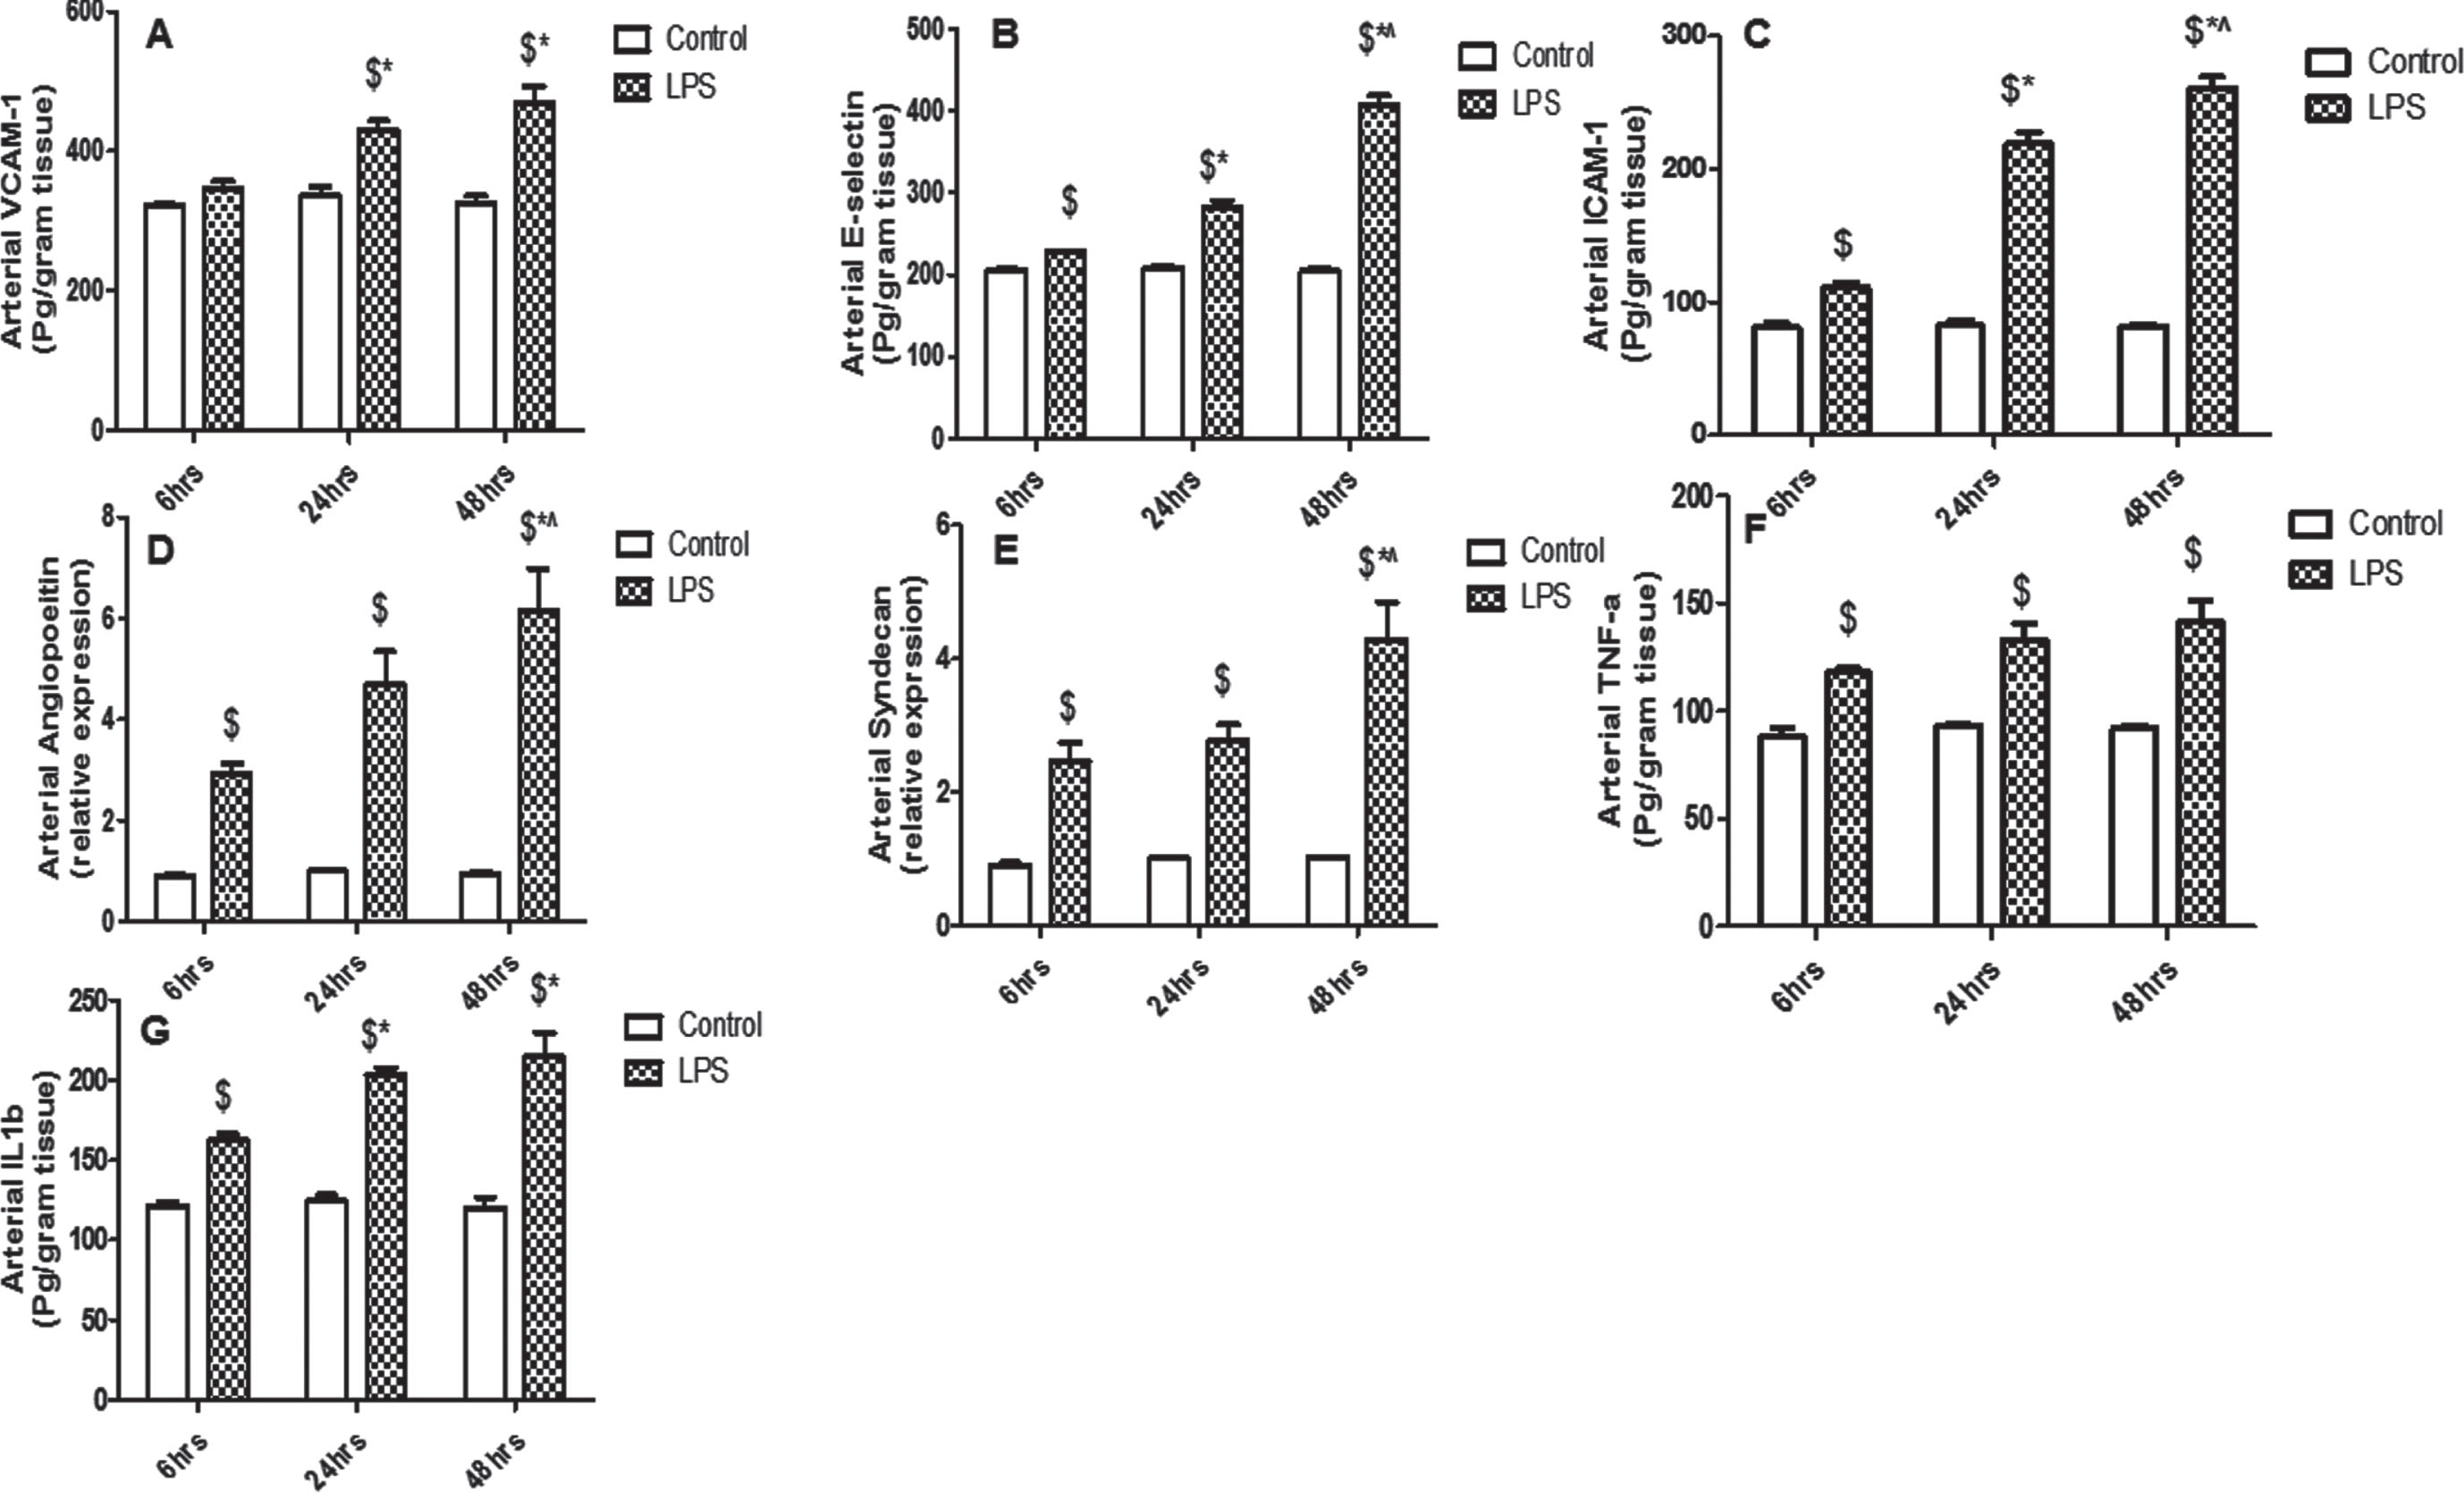
(A-G) Lipopolysaccharide induces time point changes in renal artery endothelium injury markers (VCAM-1 (A), E-selectin (B), ICAM-1 (C), Angiopoietin (D), and syndecan (E)) and inflammatory markers (tumor necrotic factor alpha)TNF-a((F), and interleukin)IL-1b((G)). Data are presented as the mean±SE (n = 10 rats/group). $P < 0.05 vs corresponding controls, *P < 0.05 vs LPS 6 hrs, ∧P < 0.05 vs LPS 24 hrs.
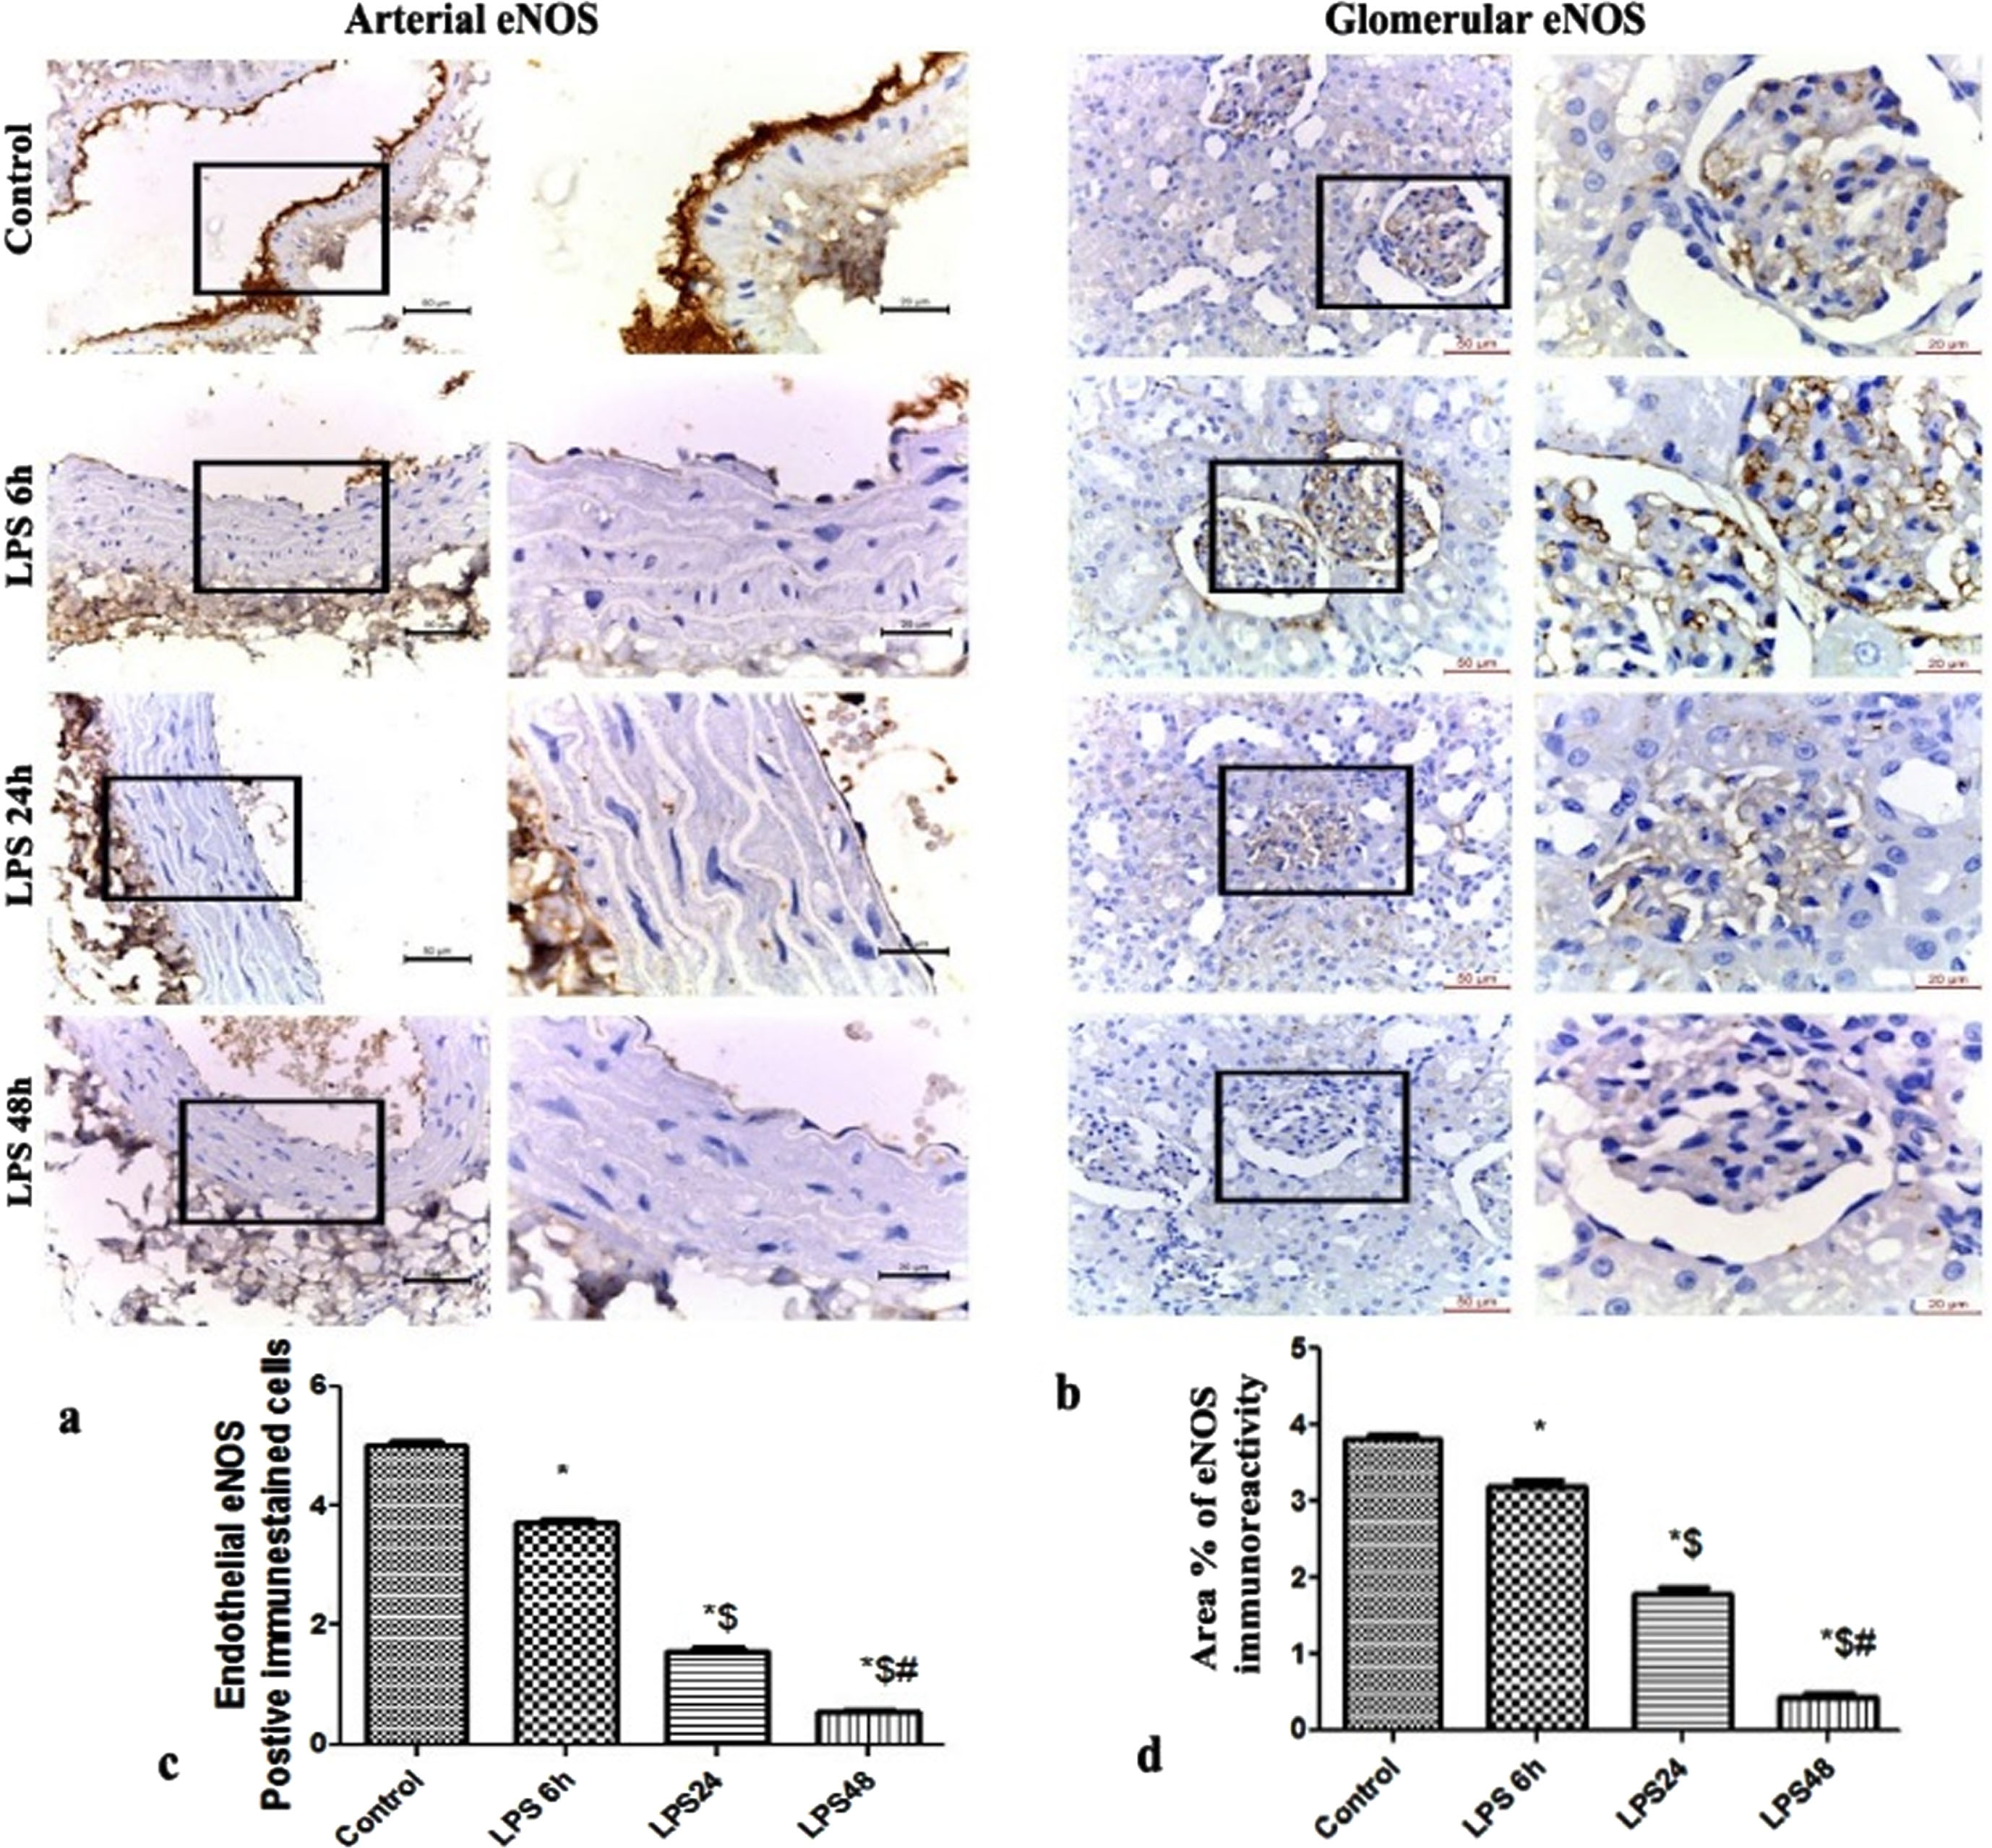
(A-D) Immunohistochemical expression of endothelial nitric oxide synthase (eNOS) reaction in (a) abdominal aorta (b) glomeruli showing changes in the level of eNOS immunohistochemical expressions in the arterial endothelium and glomerular capillaries of the LPS 6 h, 24 and 48 LPS groups.. (c) Count of endothelial eNOS-positive immune-stained cells. (d) Area percentage of eNOS immunohistochemical expression in the different study groups *: significant versus control group, $: significant versus LPS 6 h, #: significant versus LPS 24 h, at p-value≤0.05(n = 5).
In the present study, there was a statistically considerable difference in the urinary and renal inflammatory markers (TNF-a, and IL-1β) measured at 6 hrs, 24 hrs, and 48 hrs between the LPS and control groups. Furthermore, a significant increase in the urinary KIM-1 was noted 6 hrs following LPS injection. Our data showed also a strong correlation between inflammatory and grayscale variances Fig. 7.
Ultrasonography grayscale and Doppler indices correlating to standard markers of renal impairment
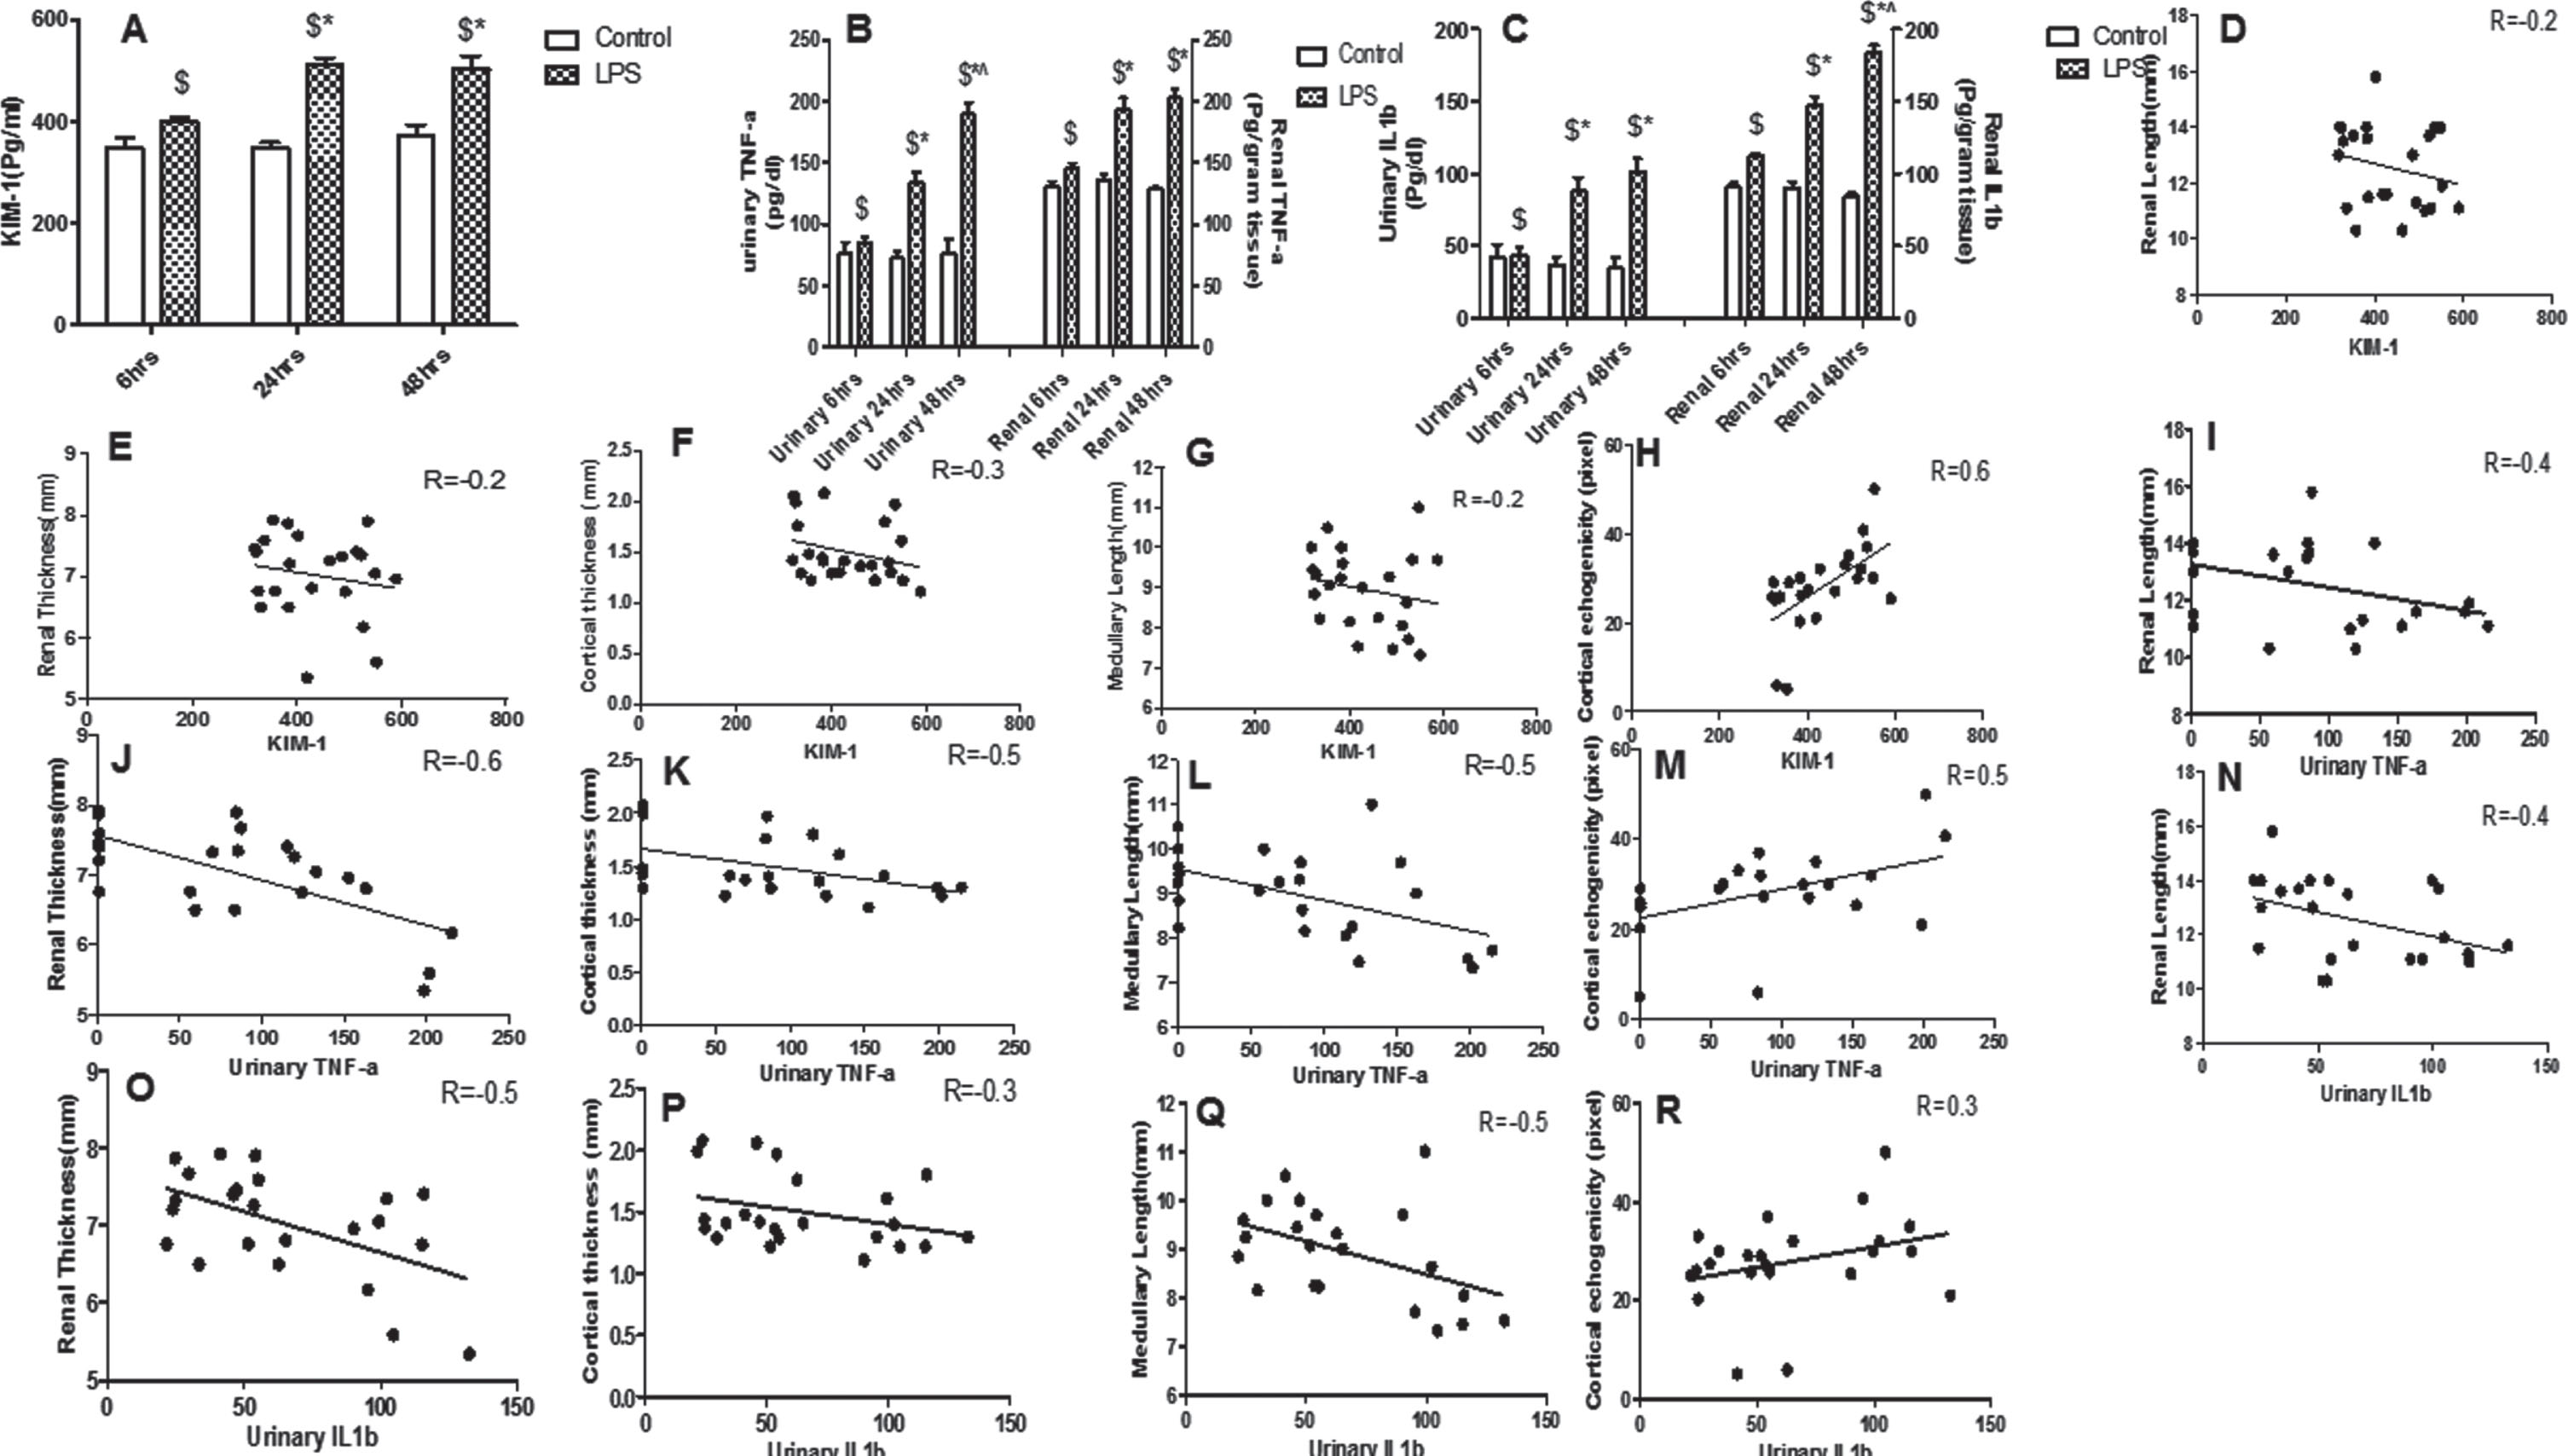
(A-C) Lipopolysaccharide induces time point changes in the inflammatory markers (KIM-1(A), TNF-a(B), IL1b(C)). Data are presented as the mean±SE (n = 10 rats/group). $P < 0.05 vs corresponding controls, *P < 0.05 vs LPS 6 hrs, ∧P < 0.05 vs LPS 24 hrs. (D-R) Representative Pearson correlations between inflammatory markers (KIM-1(D-H); TNF-a (I-M); IL1b (N-R)) and ultrasonography grayscale parameters (renal length, renal thickness, cortical thickness, medullary length, and cortical echogenicity). (Pearson correlation, n = 10 rats per group).
Regarding the relationship among ultrasound indices and biochemical parameters of renal function and fibrosis, our data showed a significant positive correlation between Ccr and ultrasound parameters (renal length and thickness, medullary length, Sys Vel and Dias Vel.), but a significant negative correlation between other standard kidney function (creatinine and FENa%) and previous parameters Table 3. In the present study, we found also that a decrease in renal length, renal thickness, medullary length, Sys Vel, and Dias Vel correlated significantly and negatively with fibrotic TGFβ as well as the percentage of collagen deposit. Further, standard kidney function (creatinine and FENa%), TGF-β, and collagen deposition correlated significantly and positively with RI, PI, and cortical echogenicity. Meanwhile, Ccr was noted to be significantly negative correlated with RI, PI, and cortical echogenicity Table 3.
Correlation and multiple regression analyses between ultrasonography indices and standard markers of renal impairment
The r-value was the coefficient correlation; P value was the significance test of coefficient correlation. Ccr; creatinine clearance, FENa; fractional excretion of sodium, TGF-β; Transforming growth factor-beta.
The Pearson coefficient was also used to verify any correlations between endothelium injury (VCAM-1, E-selectin, ICAM-1, angiopoietin, and syndecan) and inflammatory markers (KIM-1, TNF-a, and IL1b) and renal function (serum creatinine, Ccr, and FENa%) as well as renal fibrotic indicators (TGF-β and percentage of collagen deposition). The levels of serum creatinine, Ccr, and FENa% were strongly correlated with VCAM-1, E-selectin, ICAM -1, angiopoietin, syndecan, KIM-1, TNF-a, and IL1b. The collagen deposition and TGF-β were found also to be positively correlated with VCAM-1, E-selectin, ICAM -1, angiopoietin, syndecan, KIM-1, TNF-a, and IL1b Table 4.
Correlation and multiple regression analyses between endothelium and inflammatory indices and standard markers of renal impairment
Correlation and multiple regression analyses between endothelium and inflammatory indices and standard markers of renal impairment
The r value was the coefficient correlation; P value was the significance test of coefficient correlation. Ccr; creatinine clearance, FENa; fractional excretion of sodium, TGF-β; Transforming growth factor-beta, VCAM-1; Vascular cell adhesion protein 1, ICAM-1; Intercellular Adhesion Molecule 1, KIM-1; Kidney Injury Molecule-1, TNF-a; Tumour necrosis factor α, IL1b; interleukin-1 beta.
Creatinine, Ccr, and FENa are regularly used for diagnostic purposes and showed a significant difference at 24 hrs and 48 hrs between control and LPS. In addition, the fibrotic TGF-β level was significantly higher in LPS vs controls (p < 0.05). However, the AUCs of creatinine, Ccr, FENa, and TGF-β were 0.4, 0.05, 0.7, and 0.6; respectively in univariate ROC analyses, indicating a weaker ability to predict LPS-induced renal impairment Fig. 8. Ultrasonography and endothelial injury variables were also subjected to univariate ROC analysis to find the variable with the highest predictive capability for future renal impairment and fibrosis. Among all variables, cortical echogenicity, RI, PI, urinary VCAM-1, urinary E-selectin, urinary ICAM-1, urinary angiopoietin, and urinary syndecan scored the highest AUC of 0.9, 0.9, 0.8, 0.9, 1, 0.9, 1, and 1, respectively. The mean difference of inflammatory variables for LPS vs controls was statistically significant. Moreover, the AUC score of the inflammatory indices (KIM-1 AUC 0.9, TNF-a AUC 0.7, IL1b AUC 0.8) is relatively high, indicating their high predictability Fig. 8.
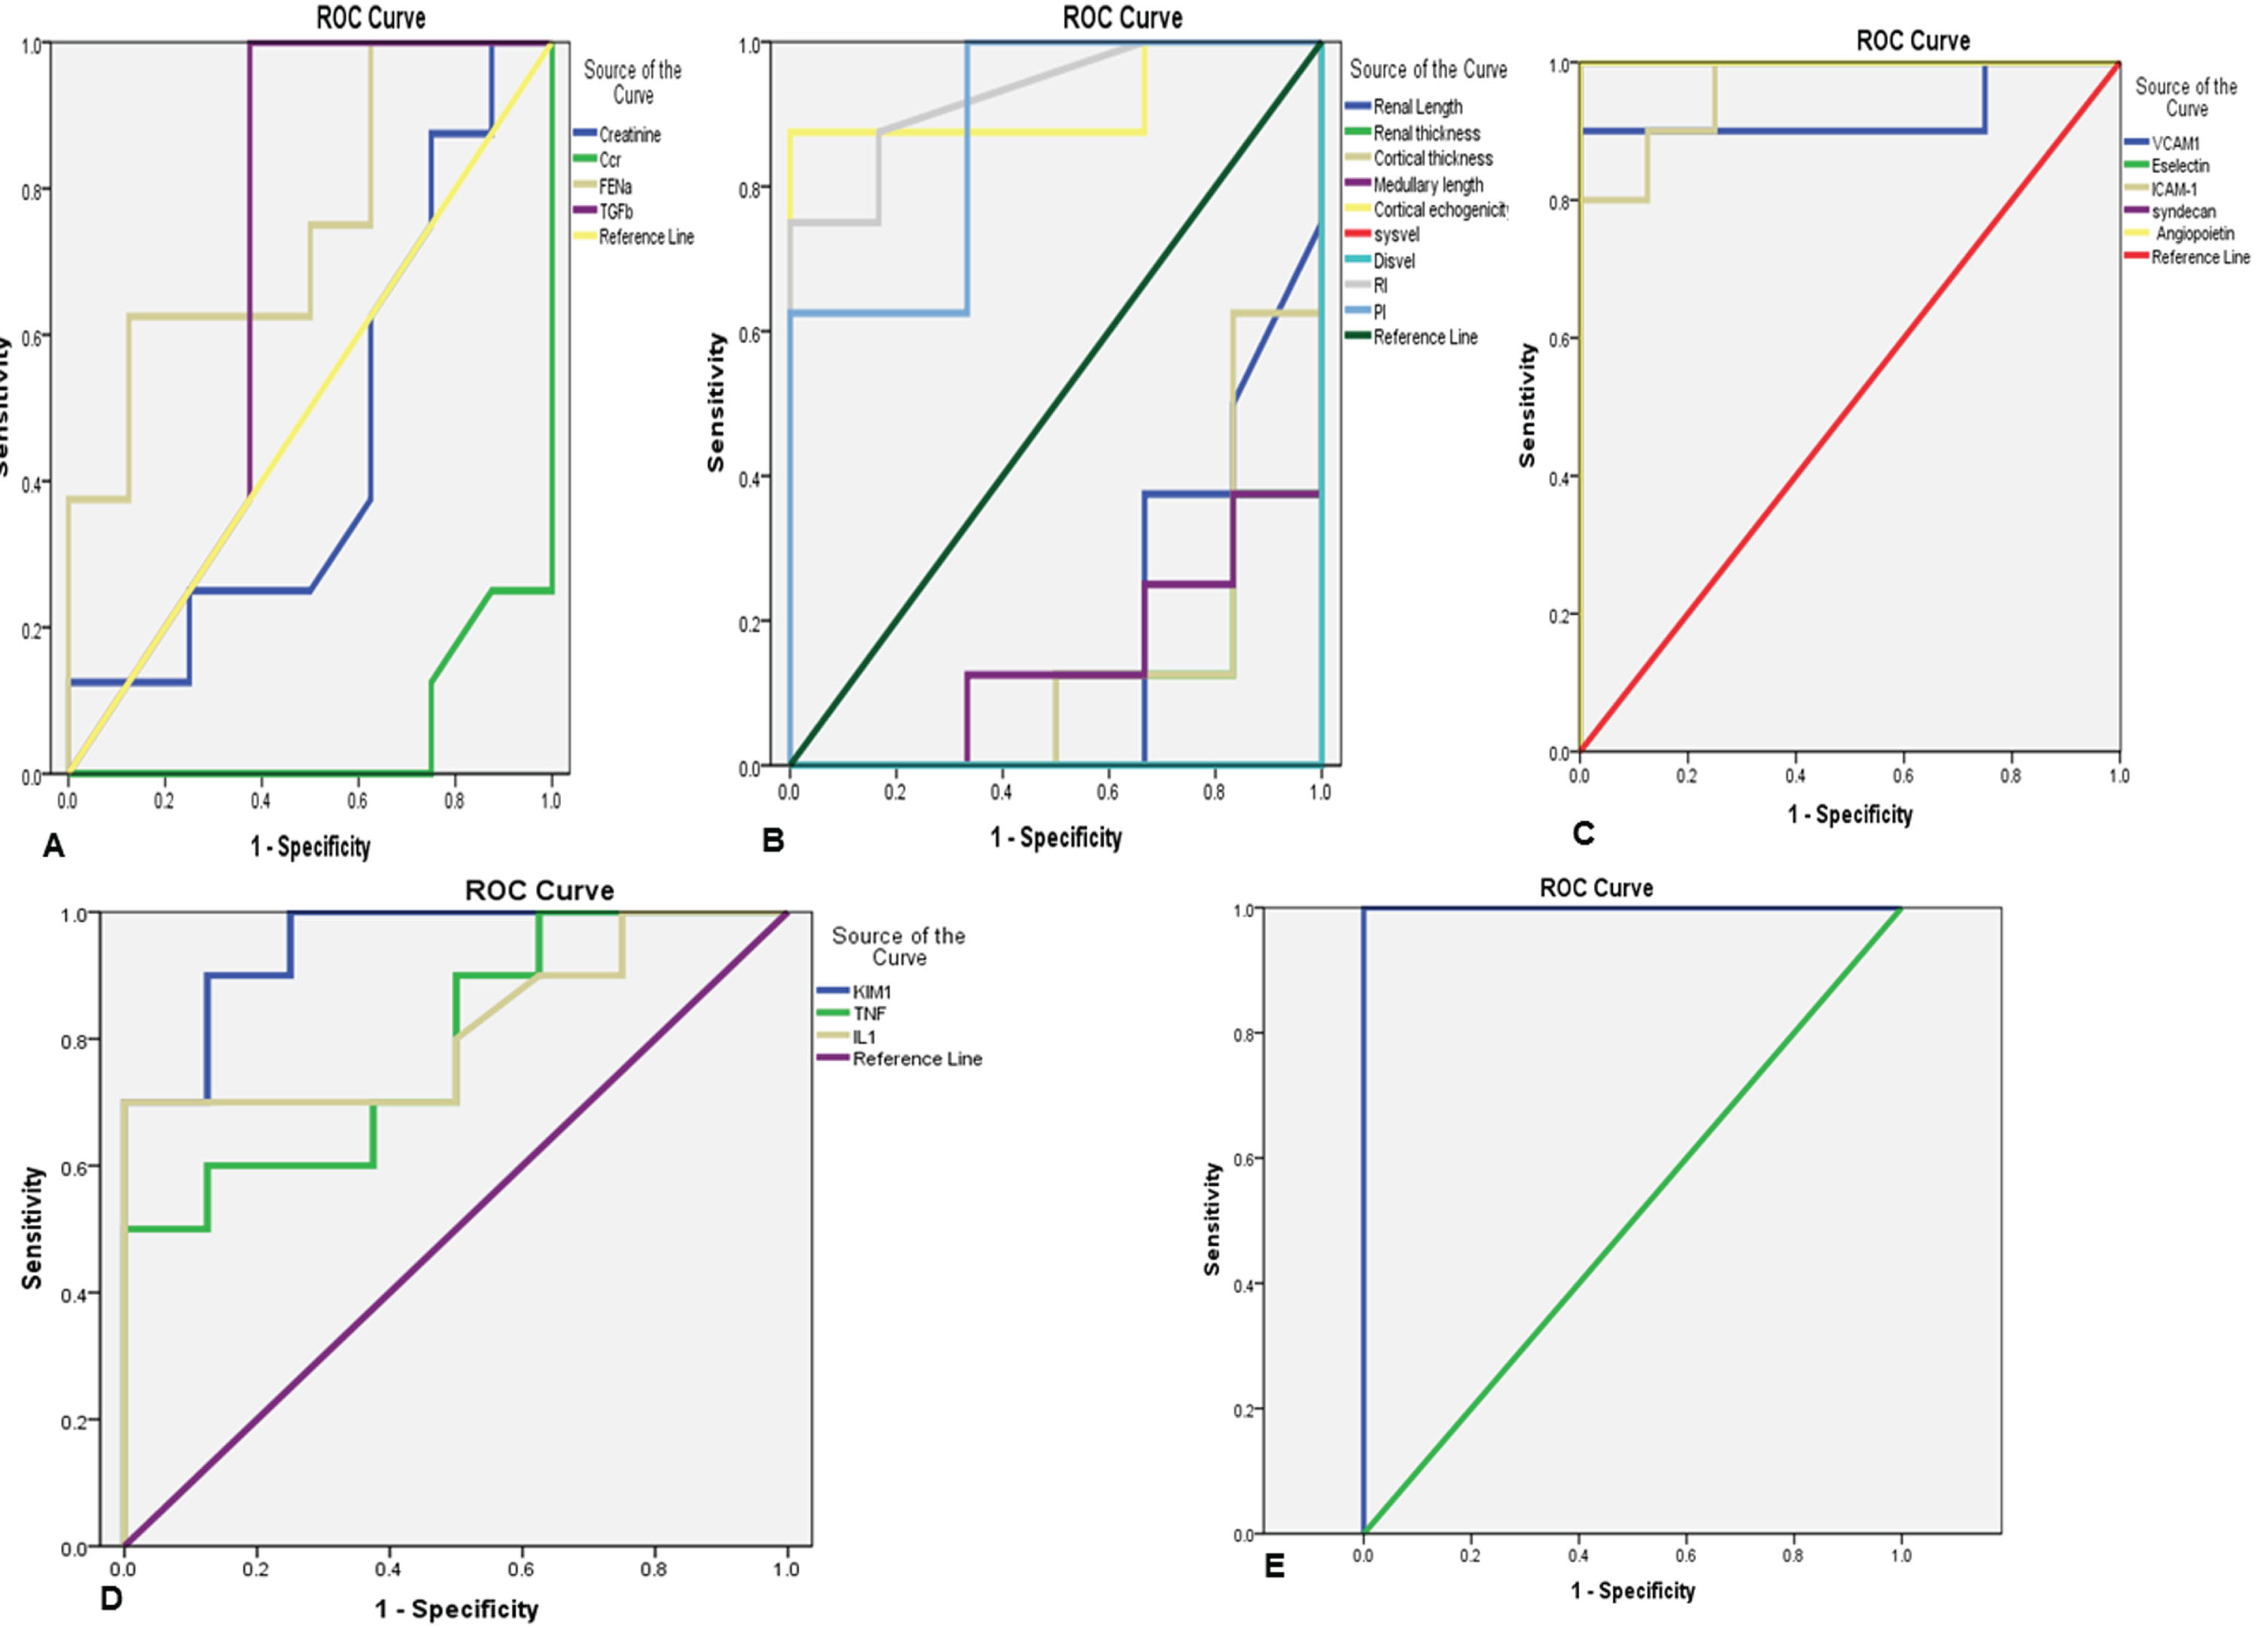
Comparison of the overlaid univariate ROC curves (A) for individual standard renal function indices (creatinine, creatinine clearance(Ccr), fractional excretion of sodium (FENa), and Transforming growth factor beta (TGF-B)), (B) individual ultrasound indices (renal length, renal thickness, cortical thickness, medullary length, cortical echogenicity, diastolic velocity, systolic velocity, resistance index (RI), pulsatile index(PI)), (C) for individual endothelium markers variables (Vascular cell adhesion protein 1(VCAM-1), E-selectin, Intercellular Adhesion Molecule 1(ICAM-1), Angiopoietin, and syndecan), and (D) for individual inflammatory markers (Kidney Injury Molecule-1(KIM-1), tumor necrosis factor-alpha (TNF-a) and interleukin (IL1b)). (E) Multivariate ROC curves for a combination of cortical echogenicity, RI, PI, VCAM-1, E-selectin, ICAM-1, Angiopoietin, syndecan, KIM-1, TNF-a, and IL1b.
Since LPS-induced AKI is a multifactorial disorder, multivariate analyses could have better strength in predicting upcoming renal impairment and fibrosis. Thus, Multivariate ROC analysis was carried out to assess the efficacy of combining ultrasonography, endothelial and inflammatory parameters. A combination of ultrasound variables, endothelium injury markers, and inflammatory markers improved the AUC value significantly beyond that of individual combining parameters. The maximum AUC of 1 was achieved with a combination of cortical echogenicity, RI, PI, VCAM-1, E-selectin, ICAM-1, angiopoietin, syndecan, KIM-1, TNF-a, and IL1b Fig. 8.
In this study, the changes in endothelium injury parameters and renal resistive indices (RI and PI) were strongly related, and were observed before alterations in the conventional renal function indicators. Furthermore, the differences in grayscale parameters, renal functions, and inflammatory indices between the LPS-AKI and control groups were noted. We observed a strong relationship between inflammatory variables and grayscale parameters. However, an increase in inflammatory indices started to be observed earlier than the alterations in grayscale variables and standard renal functions. We compared the predictive performance of ultrasound, endothelium injury, and inflammatory indices against standard renal function parameters. Cortical echogenicity, RI, PI, endothelium injury, and inflammatory variables, separately, showed a strong predictive capacity. However, combining endothelium injury, inflammatory as well as ultrasound variables (cortical echogenicity, RI, and PI) were noted to have a higher predictive value (AUC = 1) and better performance than every single item in predicting LPS-induced AKI, especially at the early stage.
During sepsis, three main mechanisms interact to trigger tubular cell injury: inflammation, endothelium injury, and impaired perfusion. The endothelium functions as an active signal transducer for inflammatory factors that alter the function and structure of the vessel wall. In the presence of pro-inflammatory cytokines, endothelial cells are hyper-activated and thereafter undergo structural and functional changes resulting in the maintenance of the ongoing inflammatory process [34, 35]. Inflammation and endothelial cell activation are prominent contributors to the impairment of perfusion [36]. Numerous possible explanations have been suggested, including leaky endothelium, tissue edema, leukocyte adhesion, and microthrombosis [17].
We found significant differences in endothelial injury markers between rats with and without AKI. Our results showed also that endothelium injury biomarkers have the highest predictive value. Measurements of endothelial markers provide insights into the status of endothelial-cell and represent an opportunity for early detection of renal disease [34]. Although endothelial injury markers are attractive biomarkers of AKI, conflicting results appear in the literature. Using multivariable logistic regression analysis, Katayama et al. [37] reported that endothelial markers could be a predictive factor of AKI during sepsis. Urinary VCAM-1 is suggested to be a good candidate for use as a non-invasive predictor biomarker of renal injury [38]. High urinary VCAM-1 level reported being increased in patients with a higher risk to develop renal dysfunction [39, 40]. Moreover, the preliminary study demonstrated an association between E-Selectin level and the risk of development of AKI after sepsis [36]. Unlike previous studies, Guan et al. [41] found a significant reduction in the level of ICAM-1 in urinary of lupus nephritis patients, which is inversely correlated with renal function. Although that selectin and ICAM-1 were found to be increased in the urine of the acute kidney injury patients, a day before the increase in the serum creatinine, neither selectin nor ICAM-1 were able to early predict kidney dysfunction [42]. Furthermore, the cross-sectional clinical study revealed that Syndecan and angiopoietin showed no significant difference between patients with and without AKI [43]. The differences in the results could be attributed to a decrease in the glomeruli filtration rate (GFR), resulting in failure to remove the shedded proteins from endothelial cells during AKI.
Simultaneous to endothelial markers alterations, we observed a significant increase in RRI in LPS groups that started 6 hours after LPS and was strongly associated with the observed elevation of endothelium injury markers. Endothelial injury underlies the reduction in renal perfusion in sepsis-induced AKI. Animal and clinical research in sepsis revealed a loss of hemodynamic coherence between the macro and microcirculation, wherein there is an improvement of macrocirculation after resuscitation, and a lack in the recruitment of microcirculation is observed [44, 45]. Ultrasonography may play an important role in defining the vascular changes that occur in the kidney, which is characterized by a decrease in the flow and an increase in the resistive index. RRI is an integrative parameter that could be influenced by endothelium status [46]. The normal range for the RRI is 0.50 to 0.70, and it tends to rise in AKI patients. Scant human studies have suggested that RRI is useful in distinguishing renal from prerenal acute kidney injury [47]. Platt et al. [48] observed a significant increase in the RRI of patients with acute tubular necrosis (ATN) when compared to patients with pre-renal AKI. The RI was correlated with the degree of tubulointerstitial damage and increased as the CKD stage progressed [49]. In septic AKI, the relationship between high RRI levels and the development of renal failure is controversial. Yu et al. [50] demonstrated that RRI can accurately predict the incidence of AKI, and its sensitivity is higher than the sensitivity of creatinine [51]. However, Brenner et al. [52] found that renal dysfunction may occur despite normal ranges of total renal blood flow. Similarly, in septic patients, RRI has a poor predictive value for AKI 6 hours [46] and 3 days after admission [53–55]. Therefore, RRI is still not conclusive in distinguishing the transient from persistent AKI [46, 47]. This can be explained by the suggestion that the RRI may reflect the changes in the vascular as well as the pressure of the renal interstitium [47].
Urinary kidney injury molecule-1 (KIM-1) is recognized as an important prognostic marker in AKI. However, the data about the predictive value of KIM-1 during sepsis are still limited and contentious [35]. Both urinary and serum KIM-1 failed to predict the severity of AKI in septic patients [56]. Several causes, other than inflammatory-induced tubular injury, have been advocated to increase KIM-1 [57]. Krzemień et al. [58] noted a negative correlation of urinary KIM-1 with C reactive protein in patients with urinary tract infections. They suggested that KIM-1 may participate in the repair process by promoting re-epithelisation, reducing apoptosis, and thus ameliorates inflammation [58].
Herein we found also a simultaneous alteration in inflammatory and grayscale indices in LPS groups. The level of inflammatory variables was strongly correlated with the changes in the grayscale parameters. While the predictive properties of the inflammatory indices and cortical echogenicity were high, grayscale variables showed poor predictive values. Ultrasound is considered the first choice imaging for nephrology patients due to its safety and low cost. However, its role in AKI patients is uncommon [59–61]. Recently, grayscale ultrasound was noted to have a low sensibility and specificity in the prediction of AKI [62]. However, grayscale parameters may perform as a good indicator to differentiate AKI and CKD. Thinner parenchyma with increased echogenicity has been reported as an indicator of progressive chronic renal disease [62]. Furthermore, renal size and cortical thickness may be used as tools to differentiate AKI from CKD. An increase in both suggests edema or infiltration associated with acute tubular necrosis, whereas, a decrease in renal size and cortical thickness seems to reflect chronic changes [63, 64]. Previous clinical study demonstrated a relationship between grayscale parameters (renal length, cortical echogenicity, and cortical thickness) and histopathological changes attributed to interstitial inflammation, renal tubules atrophy, and increased protein cast formation in renal tubules [65]. Another study reported that grayscale parameters, mainly echogenicity changes, and histopathological changes seem to be interlinked [62]. Moreover, Nogueira et al. [25] did not observe a significant correlation between echogenicity and histopathological data in nephrectomized rats. Few studies were performed to characterize the changes in grayscale parameters during sepsis. Gasser et al. [64] found that sepsis-induced inflammatory response was associated with a reduction in renal size, suggesting a chronicity of renal injury.
With univariate analysis, the predictive data for cortical echogenicity, RI, PI, endothelium, and inflammatory parameters were higher than standard renal functions (creatinine, Ccr, FENa, and TGF-β) and grayscale variables, separately. Therefore, we performed a multivariate analysis and found that combining cortical echogenicity, RI, PI, endothelium and inflammatory parameters performed better in the prediction of AKI, when compared to the predictive value of individual parameters, separately, the combination in the very early stage of AKI showed impressive predictive value (AUC = 1).
Conclusion
Endotoxemia-induced AKI is an integration of inflammation and alteration in renal perfusion that could be reflected by biomarkers and ultrasonography variables: mainly E-selectin, VCAM-1, ICAM-1, angiopoietin, syndecan, RRI, echogenicity, and inflammatory indices. Our finding may imply that ultrasonography, endothelium injury, and inflammatory parameters, separately, showed a high predictive value. However, the combination of these variables seems to reflect the renal impairment and can strongly predict endotoxemic-related inflammatory vascular endothelium injury.
Conflict of interest
All the authors have declared no competing interest.
Data availability
The data used to support the findings of this study are available from the corresponding author upon request.
Footnotes
Acknowledgments
This paper is based upon work supported by Science Technology & Innovation Funding Authority (STDF) under grant (N°26276). We thank Jamal and Naglaa for their contribution to this research. The authors are also grateful to Dr. Hazem Mahmoud Ali for his skillful assistance.