
Abstract
PURPOSE:
Early assessment of the severity of acute kidney injury (AKI) is critical to the prognosis of patients. Renal microcirculation hemodynamic changes and inflammatory response are the essential links of AKI induced by ischemia-reperfusion injury (IRI). This study aims to explore the value of contrast-enhanced ultrasound (CEUS) based on vascular cell adhesion molecule-1 (VCAM-1) targeted microbubbles (TM) in evaluating the renal microcirculation hemodynamics and inflammatory response of different severity of AKI.
METHODS:
Eighteen male C57BL/6J mice were randomly divided into three groups (n = 6): sham operation (sham) group, mild IRI-AKI (m-AKI) group, and severe IRI-AKI (s-AKI) group. CEUS based on VCAM-1 TM was used to evaluate renal microcirculation perfusion and inflammatory response. Pearson’s correlation was used to analyze the correlation between ultrasonic variables and pro-inflammatory factors.
RESULTS:
Compared with the sham group, AUC in m-AKI and s-AKI groups was significantly decreased, and s-AKI group was lower than m-AKI group (P < 0.05). NID of m-AKI and s-AKI groups was significantly higher than that of the sham group, and s-AKI group was higher than that of m-AKI group (P < 0.05). There was a linear positive correlation between NID and VCAM-1 protein expression (r = 0.7384, P < 0.05). NID and AUC were correlated with TNF-α and IL-6 levels (P < 0.05). Compared with early AKI biomarkers, CEUS based on VCAM-1 TM has higher sensitivity in evaluating the severity of AKI.
CONCLUSIONS:
CEUS based on VCAM-1 TM can evaluate renal microcirculation perfusion and inflammatory response in mild and severe AKI, which may provide helpful information for assessing the severity of AKI.
Introduction
Acute kidney injury (AKI) is a worldwide disease characterized by a dramatic decline in kidney function that occurs in up to 20% of hospitalized patients, and its prevalence is increasing [1, 2]. Some studies have reported that mild AKI can fully recover within seven days after injury. In contrast, severe AKI is irreversible after injury, and there is a great risk of progression to chronic kidney disease (CKD) [3, 4]. Therefore, accurately assessing the severity of AKI in the early stage is crucial for the prognosis of patients. The occurrence and development of AKI are often monitored by urine volume and serum creatinine (Scr). However, urine volume and Scr are less specific and sensitive and are susceptible to many factors [5, 6]. Therefore, urine volume and Scr can not detect AKI early and can not accurately identify the severity of AKI at an early stage, leading to missed optimal treatment opportunities and irreversible kidney damage. In addition, with the development of biomarkers for the diagnosis of early AKI, some scholars proposed that Cystatin C (Cys-C), kidney injury molecule-1 (KIM-1), and neutrophil gelatinase-associated lipocalin (NGAL) can be used for early monitoring of AKI [7]. However, due to the high detection cost and susceptibility to systemic complications, it has yet to be widely used in clinical practice.
Renal ischemia-reperfusion injury (IRI) is the primary pathophysiological mechanism of AKI, and renal microcirculation hemodynamic changes and inflammatory response are the two main mechanisms of IRI-AKI [8]. Numerous studies have confirmed that evaluating renal microcirculation hemodynamic changes and inflammatory responses can help identify AKI in the early stage [9, 10]. However, few studies assess the severity of AKI by evaluating renal microcirculation hemodynamic changes and inflammatory responses. Therefore, this study intended to establish mice bilateral renal model of mild and severe IRI-AKI, and evaluate the microcirculation hemodynamic changes and inflammatory response of AKI using contrast-enhanced ultrasound (CEUS) based on vascular cell adhesion molecule-1 (VCAM-1) targeted microbubbles (TM), to explore the value of CEUS based on VCAM-1 TM in evaluating the severity of AKI.
Materials and methods
Experimental animals
Eighteen male C57BL/6J mice aged 6–8 weeks, weighing 22–24 g, were purchased from the Medical Experimental Animal Center of the Chinese PLA General Hospital. The Animal Ethics Committee of the Chinese PLA General Hospital approved the animal experiments (No. 2022-x18-91). The experiments were performed after one week of acclimatization feeding. The animals were randomly divided into three groups: the sham operation group (sham group), the mild IRI-AKI group (m-AKI group), and the severe IRI-AKI group (s-AKI group).
Establishment of renal IRI-AKI model
The mice were weighed and anesthetized by intraperitoneal injection of 100 ul 1% pentobarbital sodium per 10 g body weight. After anesthesia, the skin was prepared bilaterally in the lateral abdomen, and the surgical area was disinfected with iodophor. The mice were placed prone on a thermostatic blanket to maintain the body temperature at 37–38 °C. A small longitudinal incision was made in the left lateral abdomen first, and the skin and lateral abdominal muscles were incised layer by layer to expose the kidney; the renal hilum was separated, and the renal artery and vein were clamped using atraumatic vascular clamps. The kidney color was observed to turn purple-brown gradually. The kidney was introduced into the abdominal cavity, and the start time of left kidney clamping was recorded. In the same way, the right renal artery and vein were clamped, the start time of the right renal clamp was recorded, and the gauze was covered to keep warm. After reaching the corresponding ischemia time in each group (22 min ischemia in the m-AKI group and 35 min in the s-AKI group), the atraumatic vascular clamps were released, and the kidney turned pale red within a few seconds. 0.9% sodium chloride solution 500μL was injected into the abdominal cavity through the wound to prevent postoperative dehydration. The abdominal wall and muscles were sutured. In the sham group, no clamping was performed, and the rest of the procedure was the same as in the other groups. The mice were kept at 37–38°C on a thermostatic blanket until recovery from anesthesia. Postoperatively, the mice were free to drink and eat. The same investigator performed the surgeries in this study, and the experimental conditions were the same in all groups. According to the KDIGO definition of AKI staging, the presence of AKI is defined as a 1.5-fold or more increase in Scr (a 1.5-fold or more increase in Scr is defined as mild AKI and a 3-fold or more increase is defined as severe AKI) [1].
CEUS examination
The Mindray Resona R9 color Doppler ultrasonic diagnostic instrument and L11-3U linear array probe were used for CEUS examination 12 h after the operation. The maximum coronal section of the right kidney was selected, the probe was fixed, and the contrast mode was switched (mechanical index 0.072, gain 65 dB, image depth 1.5 cm, frame rate 12 frames/sec). 100 ul TM (prepared by biotin-avidin method and carrying VCAM-1 polypeptide) with a concentration of 5x10⁶/ml were injected through the tail vein of mice. Dynamic images were stored continuously for 3 min by activating the active storage and timing keys simultaneously. Quantitative analysis of CEUS was performed by using the built-in analysis software of the ultrasonic diagnostic instrument. The renal cortex and medulla were selected as the regions of interest (ROI), and the time-intensity curve (TIC) was plotted to obtain the area under the curve (AUC). The goodness of fit (GOF) should be at least 75%. Measurements were taken three times and averaged.
After the first 3 min imaging video was collected, a destructive pulse with a high mechanical index of 0.503 destroyed all microbubbles for 3 seconds. After the destruction, ultrasonic imaging was performed for 10 seconds to obtain the signal of free-circulating microbubbles supplemented from the external imaging plane. Dynamic images were retained. The intensity before the destructive pulse was the total ultrasound signal from the target-bound and free-circulating microbubbles. In contrast, the signal intensity after destruction only comes from the free-circulating microbubbles after reperfusion. The quantification of the targeting contrast signal was calculated as the normalized intensity differences (NIDs [% ]) = (pre-destruction contrast intensity – post-destruction contrast intensity) / pre-destruction contrast intensity×100% ] [11, 12].
Detection of serum indicators
After the CEUS examination, 600–800μL of blood was taken from the inferior vena cava using a 1-mL sterile syringe. After standing at room temperature for 1 h, the blood was centrifuged at 3000 r/min for 15 min. The supernatant was collected, packed into EP tubes, and frozen at – 20°C. Scr, blood urea nitrogen (BUN), and serum Cys-C levels were measured using a fully automated biochemical analyzer (Hitachi, Tokyo, Japan). According to the manufacturer’s instructions, the biomarkers serum KIM-1 and NGAL levels were measured using enzyme-linked immunosorbent assay (ELISA) kits (Jiangsu Meimian Industrial Co., Ltd, Jiangsu, China).
Renal histopathology evaluation
The kidney was treated with 4% paraformaldehyde fixation, dehydration, and paraffin embedding, and the tissue was sectioned and stained with periodic acid-Schiff (PAS). Ten slices with 400-fold non-overlapping visual fields were randomly selected, including five in the cortical region and five in the corticomedullary junction. Renal tubular injury score was performed blind to evaluate the loss of brushy margins, tubular dilatation, cast formation, tubular necrosis, neutrophil infiltration, etc. The tubular injury was classified into six grades [13]: 0, normal; 1 score, mild injury (involving 0% to 10%); 2 scores, moderate damage (11–25% involvement); 3 scores, severe injury (26–49% involvement); 4 scores, highly severe injury (50–75% involvement); 5 scores, extensive damage (>75% involvement). All assessments were carried out by two pathologists who did not know the experimental conditions.
The expression of VCAM-1 protein in renal tissue was analyzed by immunohistochemical staining of paraffin sections. After routine dewaxing, endogenous peroxidase was removed using 3% H2O2, and antigen repair was performed. After goat serum was blocked at room temperature for 30 min, the sections were incubated overnight at 4°C with rabbit anti-mouse VCAM-1 antibody (Abcam) (1 : 500 dilution). After rinsing, the sections were incubated with HRP-labelled goat anti-rabbit secondary antibody for 50 min at room temperature, followed by DAB and hematoxylin re-staining of cell nuclei. After dehydration, clearing, and neutral gum sealing, the slices were microscopically observed and comparatively analyzed for VCAM-1 expression. Five non-overlapping fields of view at 400x were randomly selected. The quantification was completed by two researchers unaware of the experimental conditions.
TUNEL is currently the most commonly used method for detecting cell apoptosis. According to the manufacturer’s instructions (Roche, Basel, Switzerland), TUNEL staining was used to detect apoptosis in renal paraffin sections. Five randomly selected non-overlapping fields of view at 400x were used to count the number of apoptotic cells.
Tumor necrosis factor-alpha (TNF-a) and interleukin-6 (IL-6) are essential inflammatory factors, and their levels reflect the degree of inflammation in model mice. According to the manufacturer’s instructions, the levels of TNF-α and IL-6 in kidney tissue were measured using ELISA kits (Jiangsu Meimian Industrial Co., Ltd, Jiangsu, China).
Statistical analysis
Statistical analysis was performed using GraphPad Prism 8.0 (GraphPad Software, Inc. San Diego, CA, USA) and SPSS Statistics (version 25.0; IBM Corp., Armonk, NY, USA). The Kolmogorov-Smirnov test was used to test the normal distribution of the data. All quantitative parameters were compared and analyzed by one-way ANOVA. When the variance homogeneity test P > 0.05, Tukey’s multiple comparison post-test was used. Otherwise, Dunnett’s T3 postmortem test was applied. Pearson’s correlation was used to analyze the correlation between NID and VCAM-1 protein expression and the correlation between AUC and NID and pro-inflammatory factors (TNF-α and IL-6). P < 0.05 was considered a statistically significant difference.
Results
Comparison of renal tubular injury and renal function
Figure 1 shows the comparison of renal tubular injury and renal function indicators among the three groups. PAS staining showed that compared with the sham group (Fig. 1-A), both m-AKI and s-AKI groups had different degrees of renal tubule injury, and the s-AKI group was more severe than the m-AKI group. The renal tubular injury was mainly located at the corticomedullary junction. The renal tubules were characterized by the loss of brushy margins, tubular dilatation, and cast formation (Figs. 1-B-C). The results of renal tubular injury scores showed that the scores of the m-AKI and s-AKI groups were significantly higher than those of the sham group, with statistical significance (P < 0.05). The scores of the s-AKI group were higher than those of the m-AKI group, with statistical significance (P < 0.05) (Fig. 1-D).
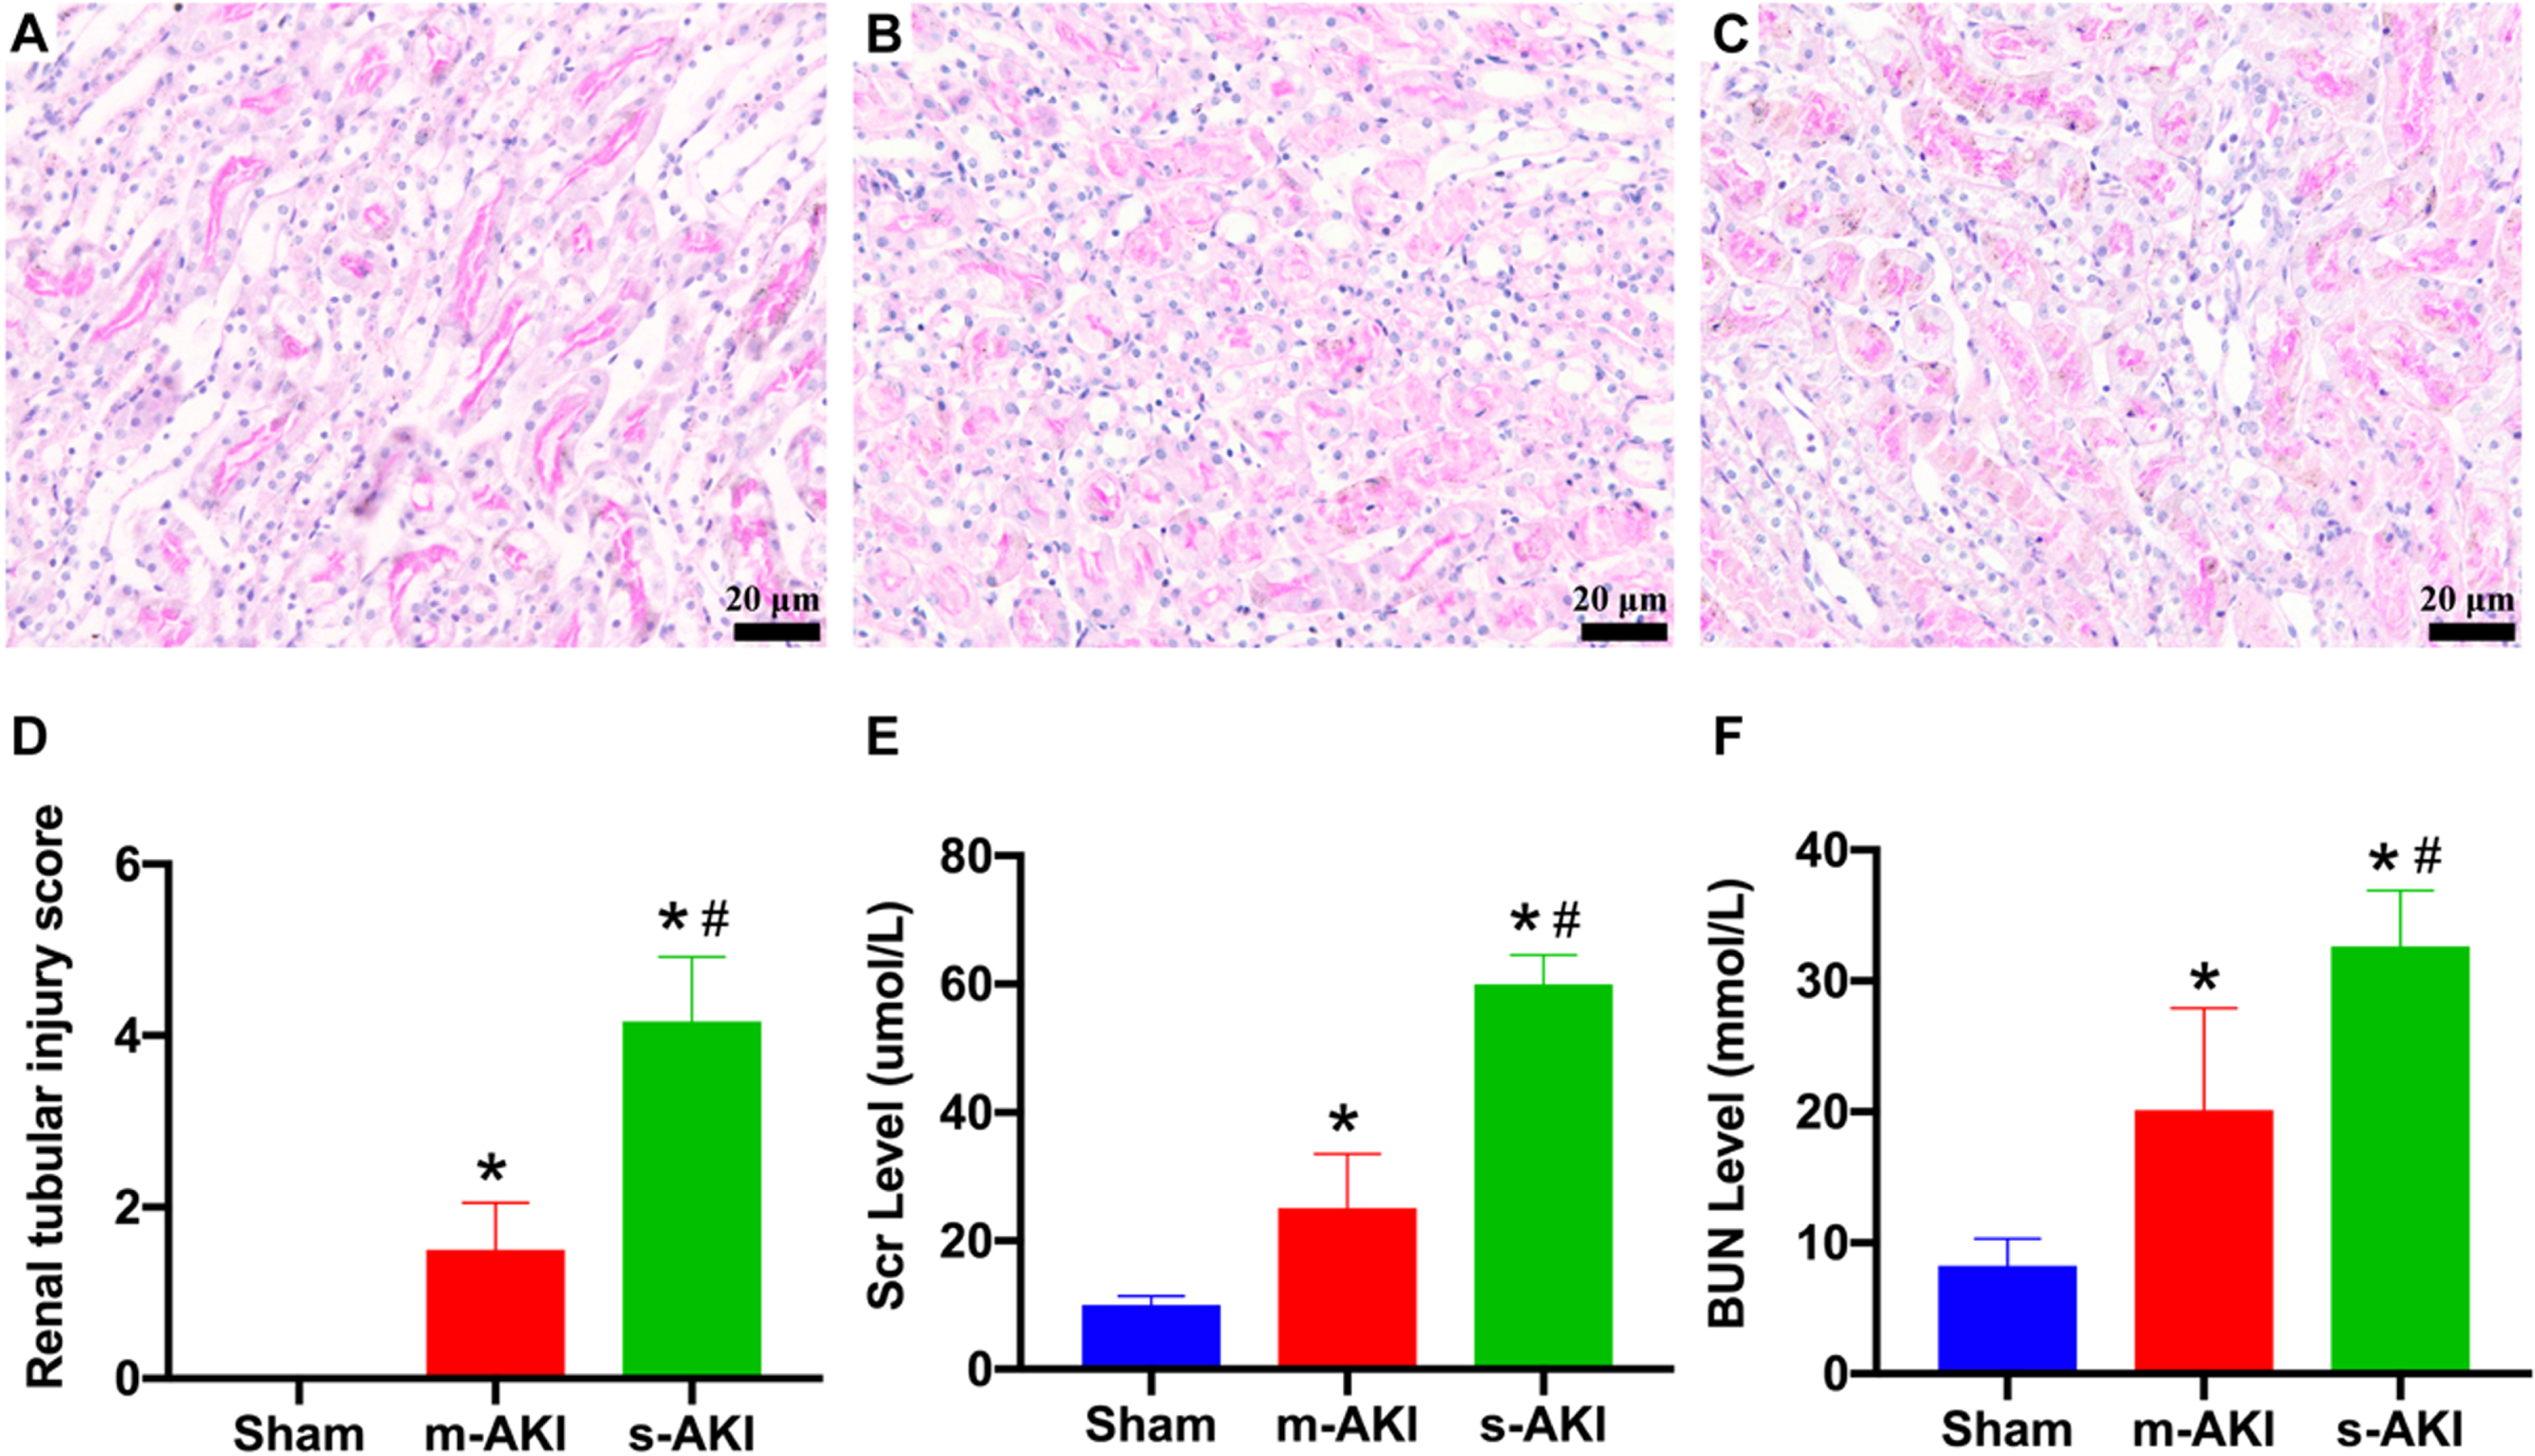
Assessment of AKI. (A-C) Histopathologic images of the kidney using PAS staining (A: Sham group; B: m-AKI group; C: s-AKI group); scale = 20μm. (D) Comparison of the renal tubular injury score. (E) Comparison of the Scr levels. (F) Comparison of the BUN levels. * P < 0.05 compared with Sham, #P < 0.05 compared with m-AKI (n = 6 per group). AKI: acute kidney injury; BUN: blood urea nitrogen; Scr: serum creatinine.
Scr and BUN are commonly used indicators to evaluate renal function. The results showed that Scr and BUN levels in the m-AKI group and s-AKI group were significantly higher than those in the sham group, with statistical significance (P < 0.05), and the s-AKI group was higher than the m-AKI group, with statistical significance (P < 0.05) (Figs. 1-E-F).
Figure 2 shows CEUS assessing renal microcirculatory perfusion in the three groups. After injecting microbubbles, all three groups showed rapid enhancement initially and began to fade after reaching the peak intensity (Figs. 2-A-C). Further quantitative analysis of the TICs of the cortical ROI showed that the AUCs in the m-AKI and the s-AKI groups were significantly decreased compared to the sham group, with a statistically significant difference (P < 0.05). The s-AKI group was lower than the m-AKI group, with a statistically significant difference (P < 0.05) (Fig. 2-D).
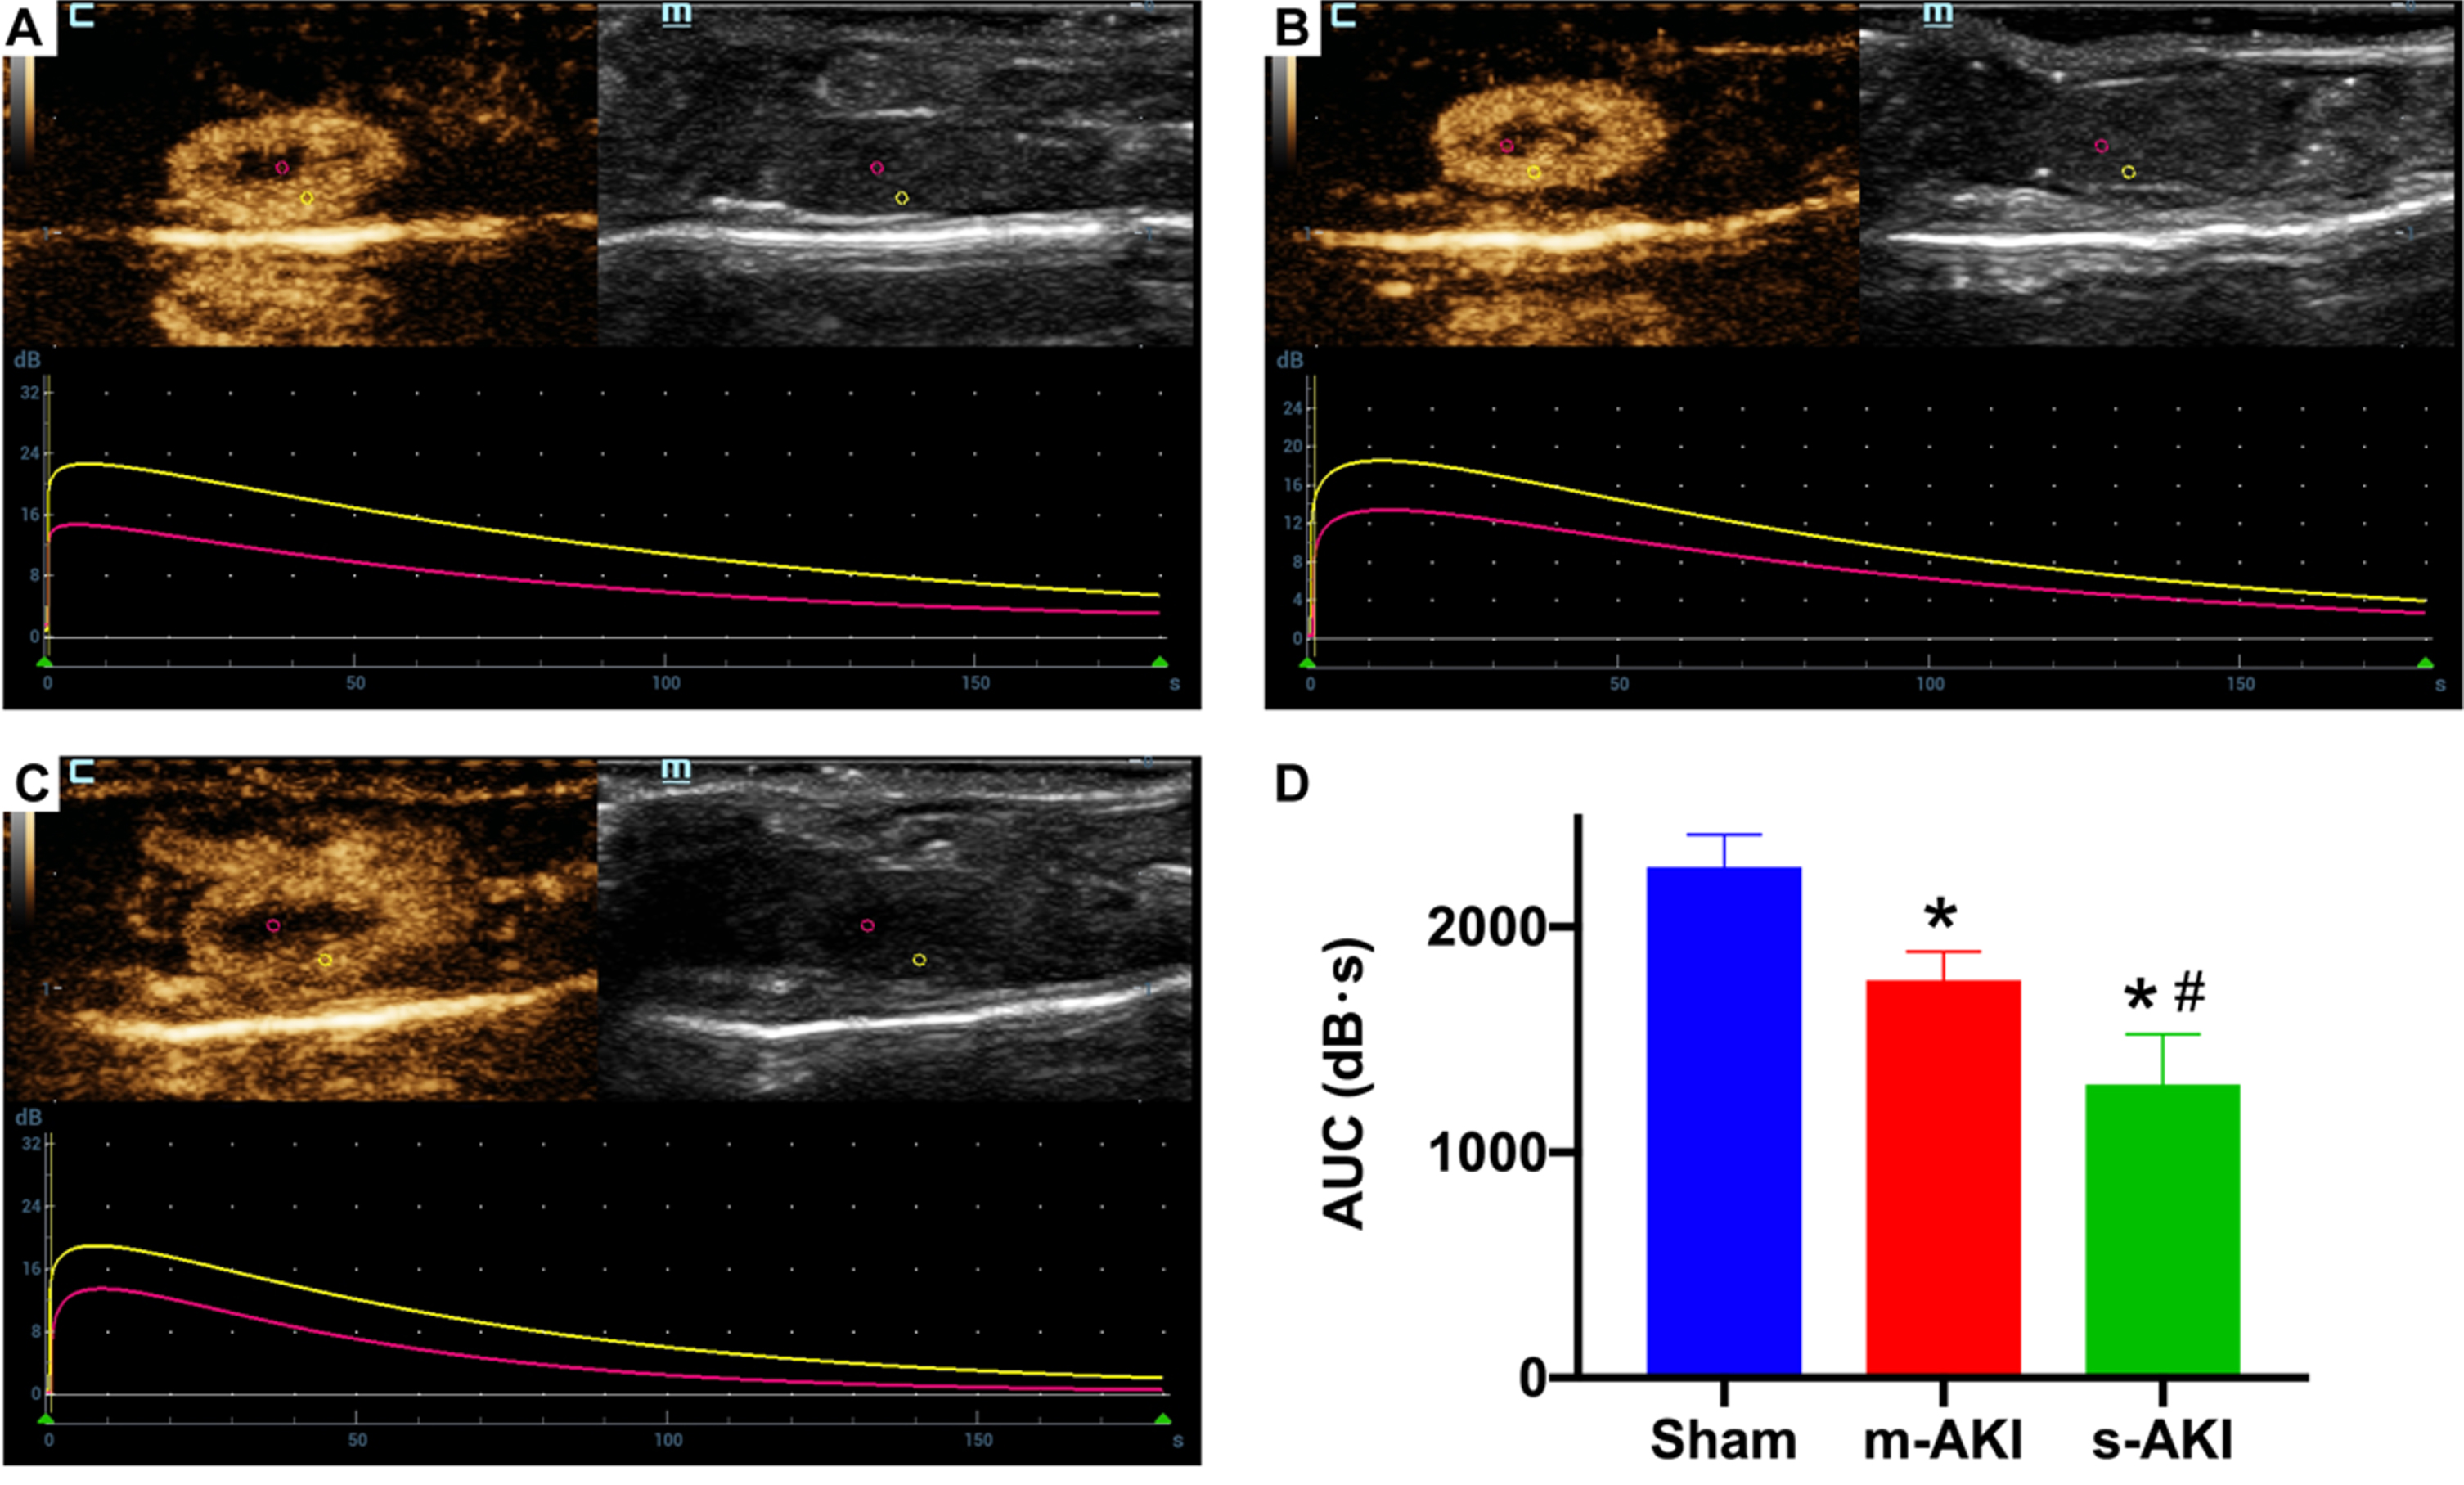
Quantitative evaluation of renal microcirculation perfusion by CEUS. (A-C) Renal CEUS images and corresponding time-intensity curves (A: Sham group; B: m-AKI group; C: s-AKI group). The yellow line and red line represent time-intensity curve of renal cortical and medullary ROI, respectively. (D) Comparison of AUC of renal cortex. *P < 0.05 compared with Sham, #P < 0.05 compared with m-AKI (n = 6 per group). AKI: acute kidney injury; AUC: area under the curve.
Figures 3-A-C show the enhanced images before the destruction of VCAM-1 TM and the TICs of the destruction process. Quantitative analysis results showed that the NID of the m-AKI group and s-AKI group was significantly higher than that of the sham group, with statistical significance (P < 0.05), and the s-AKI group was higher than that of the m-AKI group, with statistical significance (P < 0.05) (Fig. 3-D).

Quantitative evaluation of inflammatory response by CEUS. (A-C) CEUS images before the destruction of VCAM-1 TM and the TICs of the destruction process (A: Sham group; B: m-AKI group; C: s-AKI group). Red circles represent kidney outlines. (D) Comparison of the NID (%). *P < 0.05 compared with Sham, #P < 0.05 compared with m-AKI (n = 6 per group). AKI: acute kidney injury; NID: normalized intensity difference.
Immunohistochemistry results showed that VCAM-1 protein expression in the m-AKI and s-AKI groups was increased mainly in peritubular capillaries (Figs. 4-A-C). And quantitative analysis showed that the expression of VCAM-1 protein in the m-AKI and s-AKI groups was significantly higher than in the sham group, with statistically significant differences (P < 0.05). The s-AKI group was higher than the m-AKI group, with statistically significant differences (P < 0.05) (Fig. 4-D). In addition, Pearson’s correlation analysis showed a linear positive correlation between NID and VCAM-1 protein expression (r = 0.7384, P < 0.05) (Fig. 4-E).
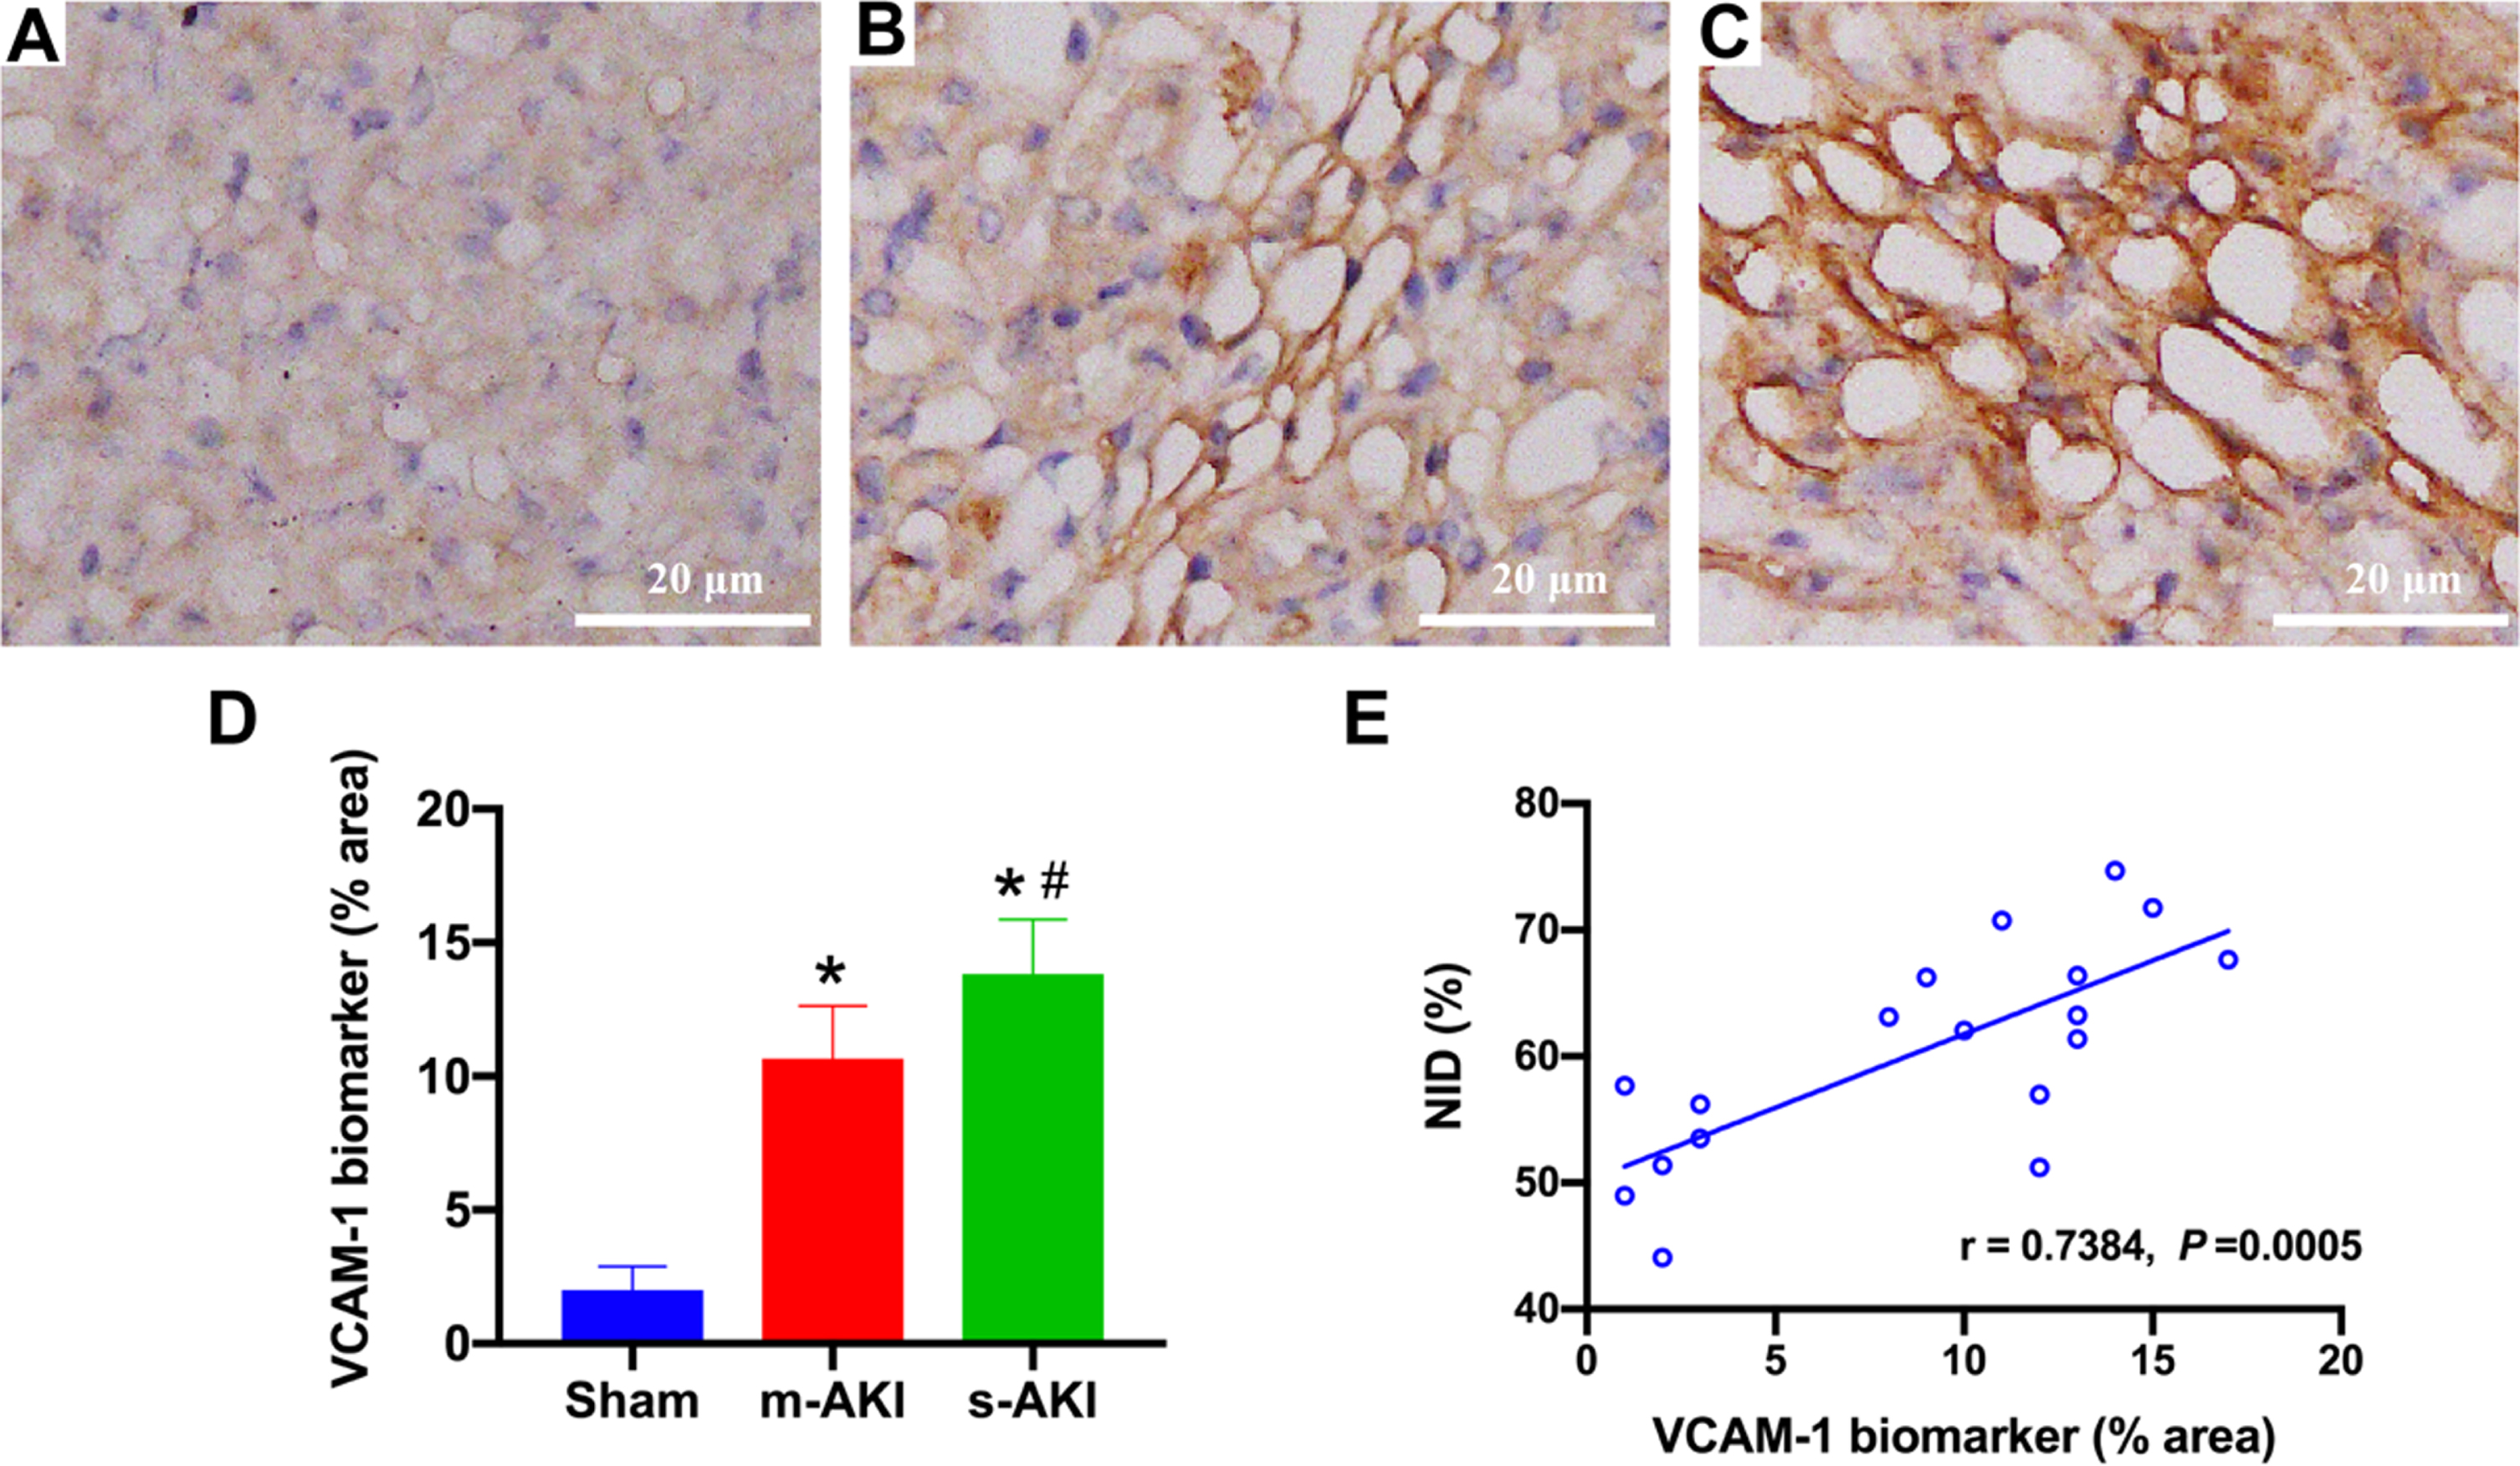
Immunohistochemical staining results. (A-C) Immunohistochemical images of VCAM-1 expression (A: Sham group; B: m-AKI group; C: s-AKI group). scale = 20μm. (D) Quantitative analysis of VCAM-1 expression. (E) Pearson’s correlation analysis between the NID and VCAM-1 expression. *P < 0.05 compared with Sham, #P < 0.05 compared with m-AKI (n = 6 per group). AKI: acute kidney injury; NID: normalized intensity difference; VCAM-1: vascular cell adhesion molecule-1.
Figures 5-A-C show TUNEL staining for detecting apoptosis in the three groups. Further quantitative analysis showed that the number of apoptosis in the m-AKI and the s-AKI groups was significantly higher than that in the sham group, with statistical significance (P < 0.05), and the s-AKI group was higher than the m-AKI group, with statistical significance (P < 0.05) (Fig. 5-D).
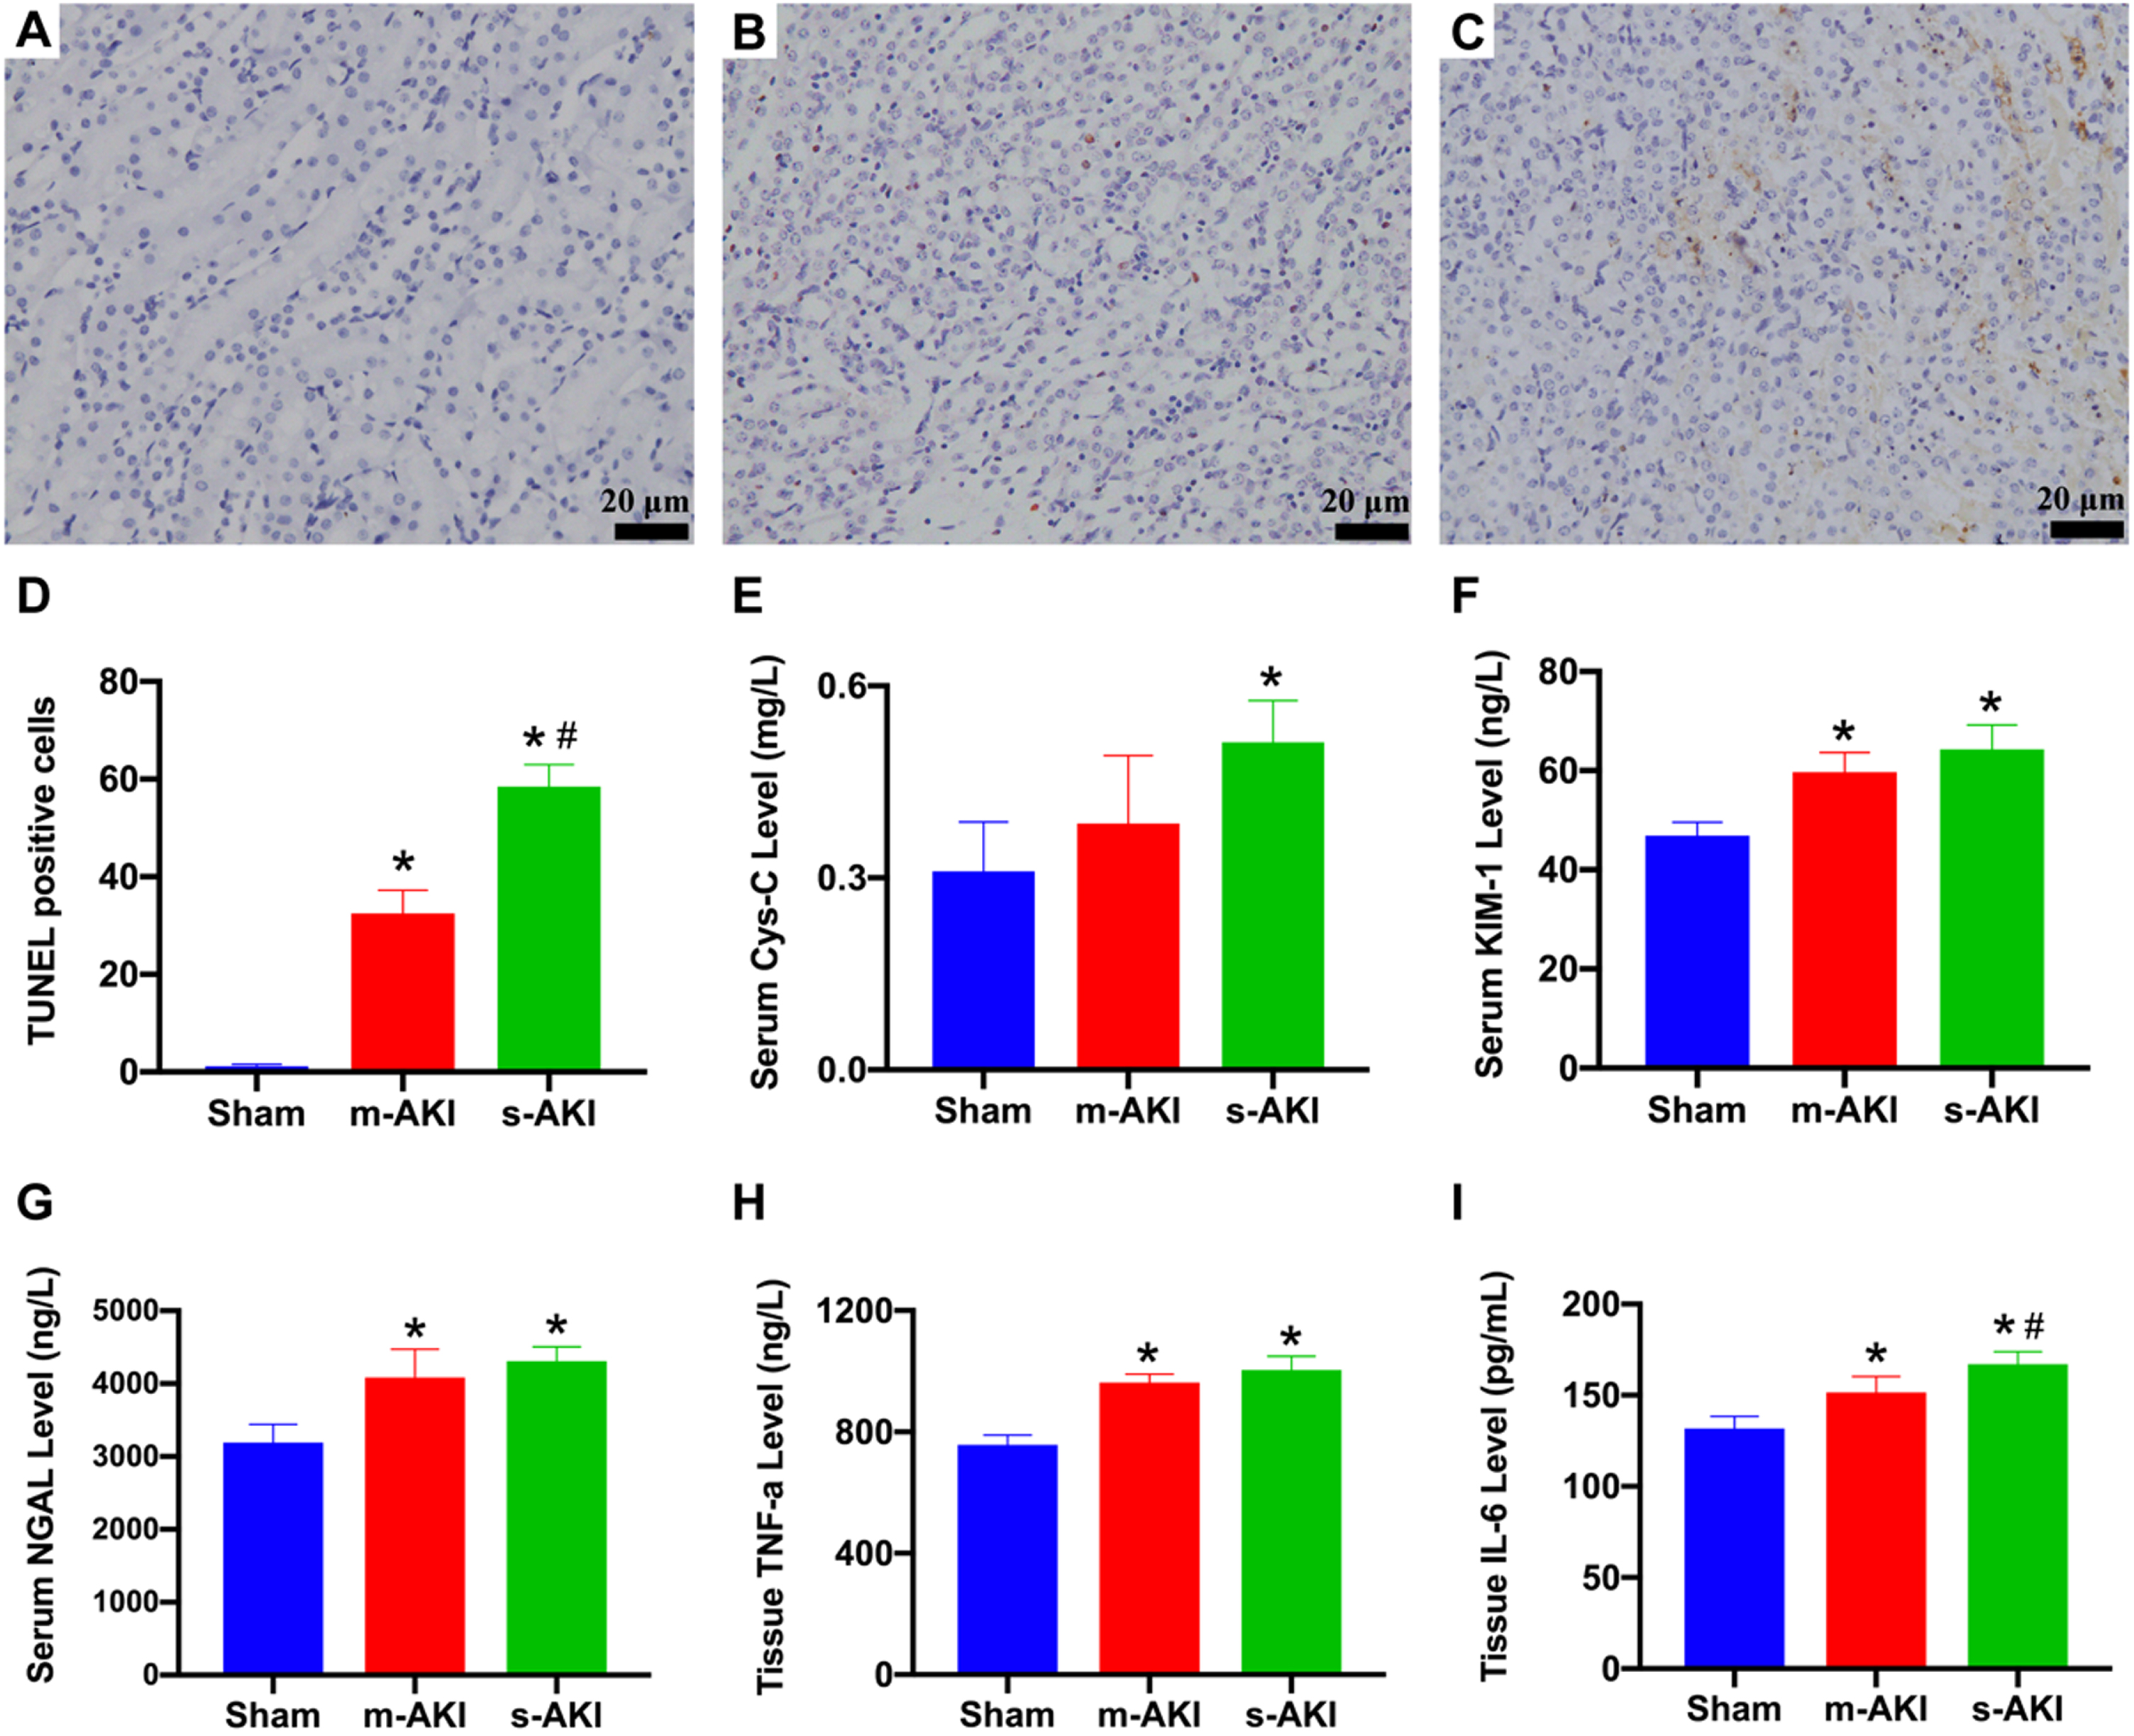
Comparison of other assessment indicators of AKI. (A-C) Images of TUNEL staining for the detection of cell apoptosis (A: Sham group; B: m-AKI group; C: s-AKI group); scale = 20μm. (D) Comparison of the number of apoptotic cells (400x). (E) Comparison of the serum Cys-C levels. (F) Comparison of the serum KIM-1 levels. (G) Comparison of the serum NGAL levels. (H) Comparison of the tissue TNF-a levels. (I) Comparison of the tissue IL-6 levels. *P < 0.05 compared with Sham, #P < 0.05 compared with m-AKI (n = 6 per group). AKI: acute kidney injury; Cys-C: Cystatin C; IL-6: interleukin-6; KIM-1: kidney injury molecule-1; NGAL: neutrophil gelatinase-associated lipocalin; TNF-a: tumor necrosis factor-alpha.
Cys-C, KIM-1, and NGAL were early biomarkers of AKI. The detection results showed that the level of Cys-C in the s-AKI group was significantly higher than in the sham group (P < 0.05). At the same time, there was no statistical significance in the m-AKI group compared with the sham group and s-AKI group (P > 0.05) (Fig. 5-E). In addition, compared with the sham group, KIM-1 and NGAL levels in the m-AKI group and s-AKI group were significantly increased, with statistical significance (P < 0.05). At the same time, there was no statistical significance between the s-AKI group and the m-AKI group (P > 0.05) (Figs. 5-F-G).
The comparison of pro-inflammatory factors showed that the levels of TNF-α and IL-6 in the m-AKI group and s-AKI group were higher than those in the sham group, with statistical significance (P < 0.05), and the levels of IL-6 in s-AKI group were higher than those in m-AKI group, with statistical significance (P < 0.05). However, there was no significant difference in TNF-α level between the s-AKI group and the m-AKI group (P > 0.05) (Figs. 5-H-I).
Pearson’s correlation analysis showed that NID in the three groups was linearly positively correlated with TNF-α and IL-6 levels in kidney tissue (P < 0.05) (Figs. 6-A-B). And AUC was negatively associated with TNF-α and IL-6 levels (P < 0.05) (Figs. 6-C-D).
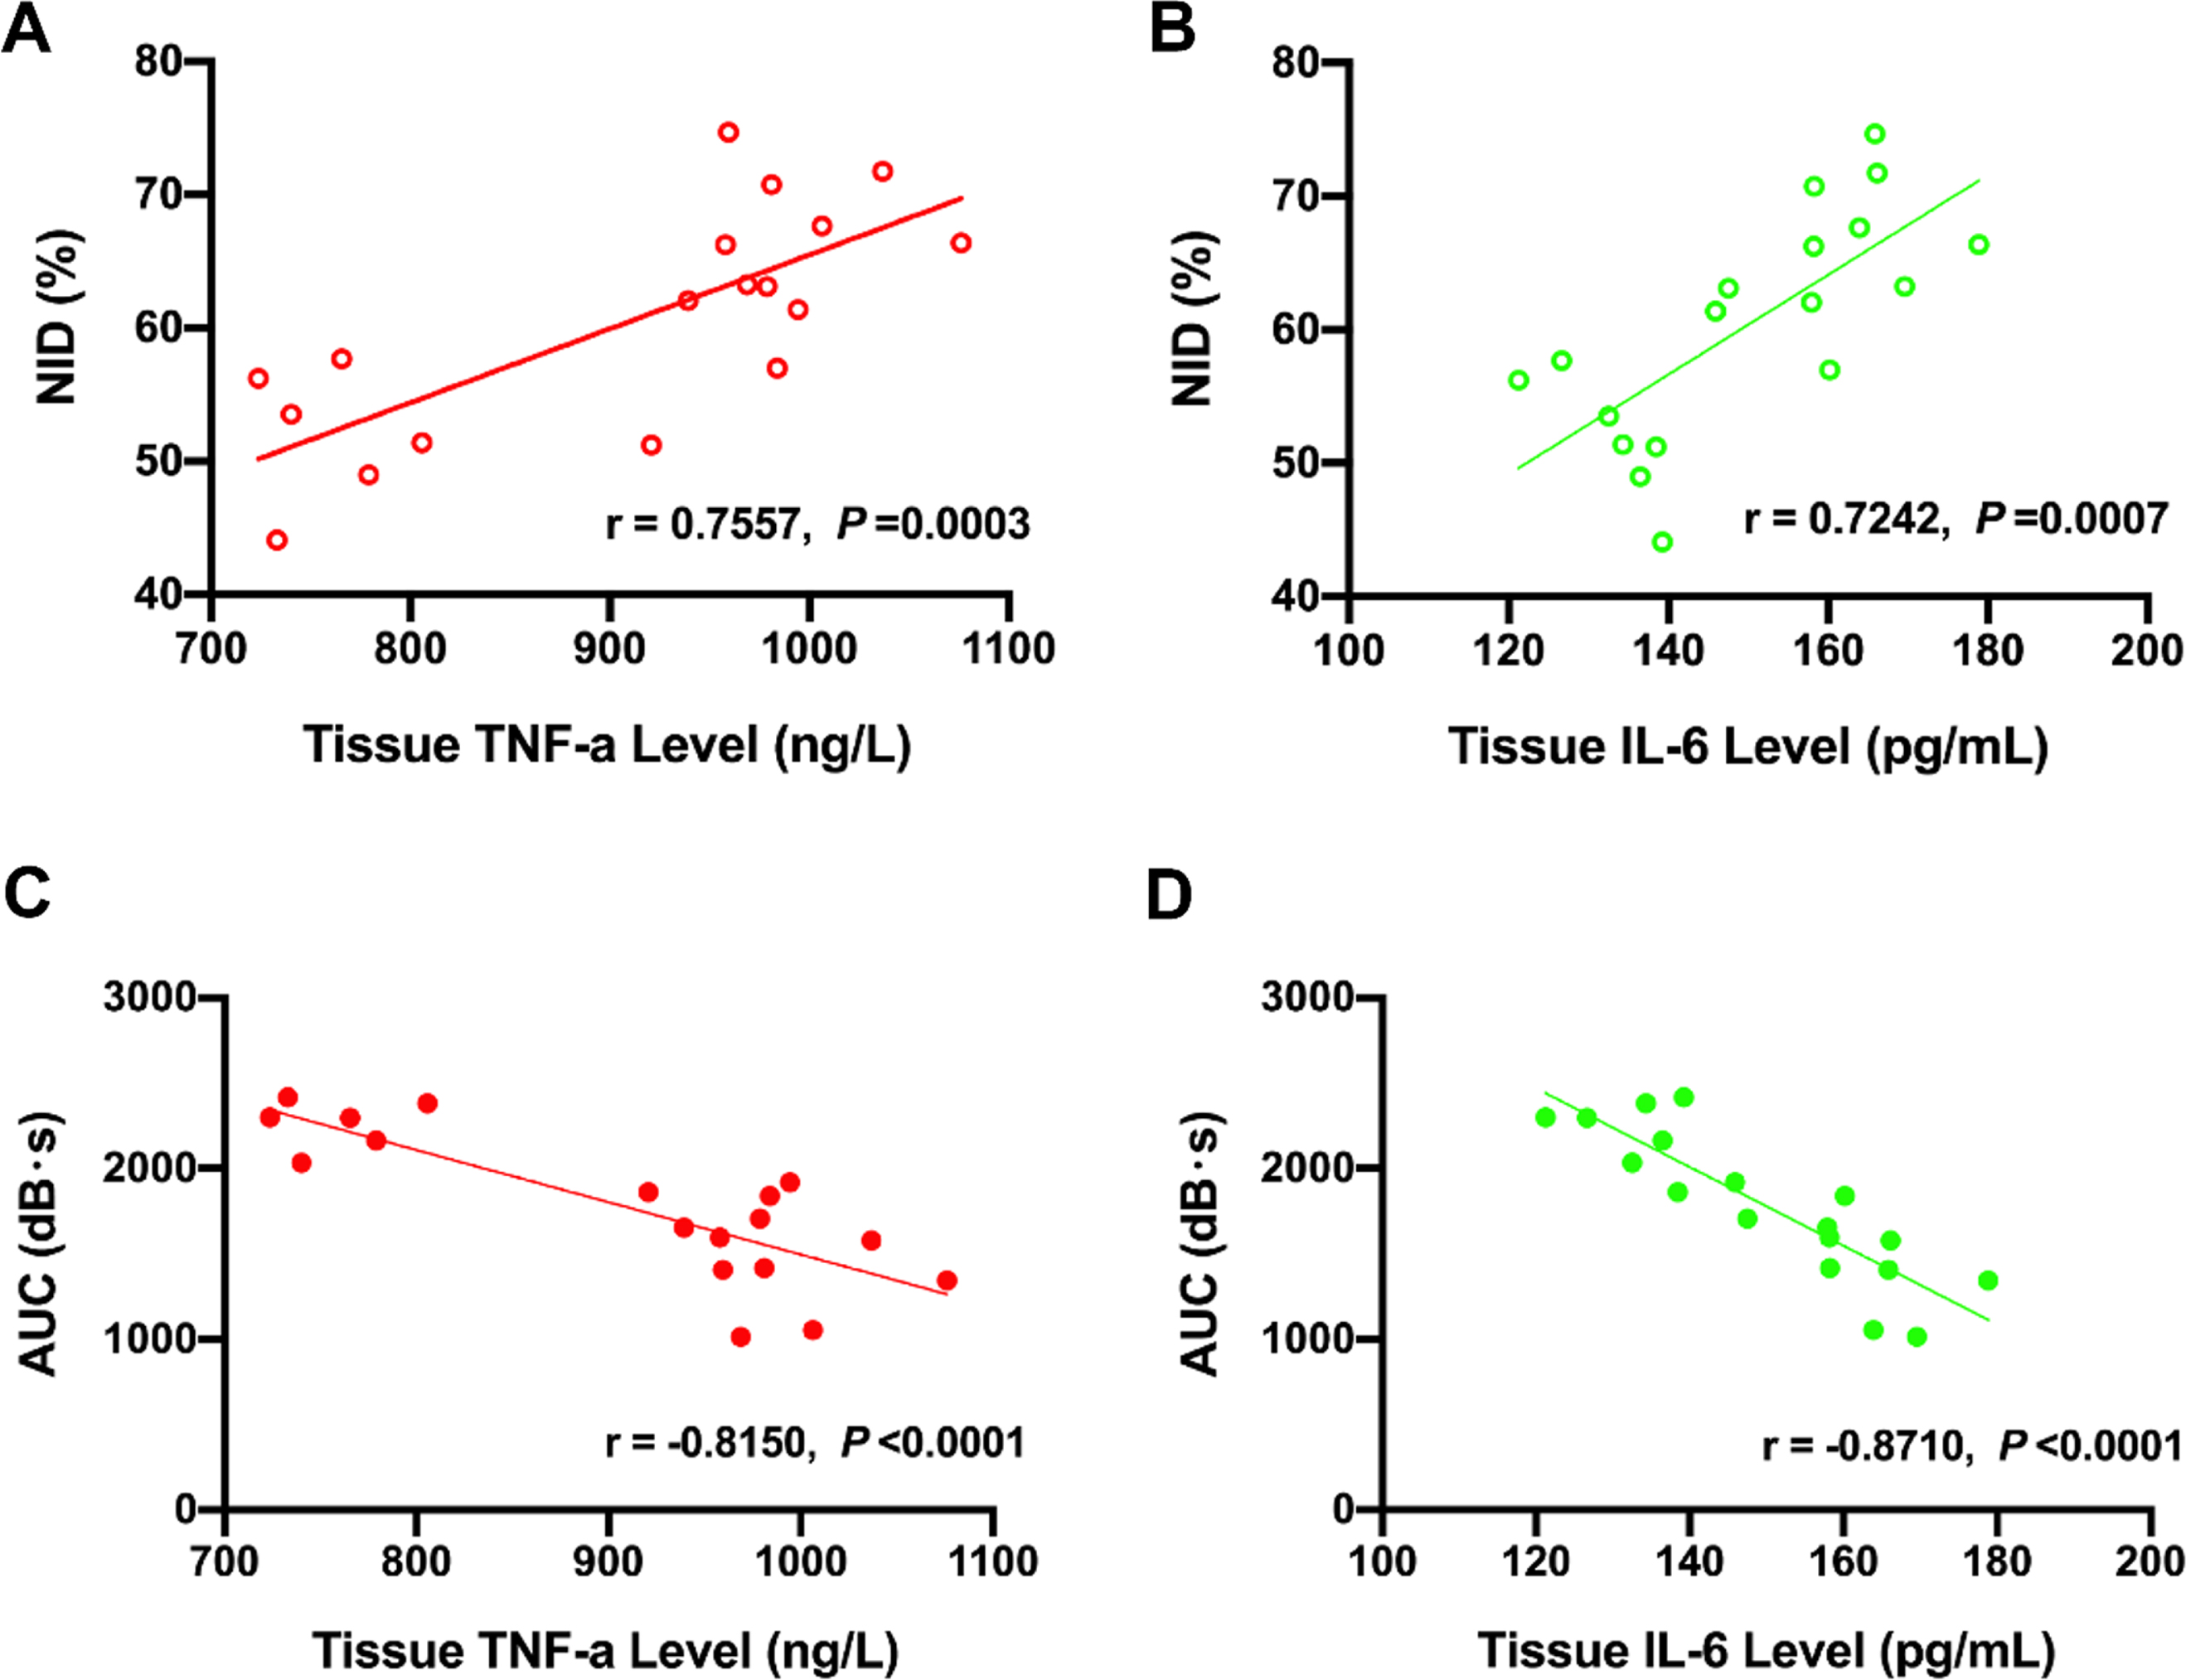
Correlation between ultrasound variables and pro-inflammatory factors. (A-B) The correlation between the NID and tissue TNF-a level, tissue IL-6 level. (C-D) The correlation between the AUC and tissue TNF-a level, tissue IL-6 level. AUC: area under the curve; IL-6: interleukin-6; NID: normalized intensity difference; TNF-a: tumor necrosis factor-alpha.
Hemodynamic disorder and inflammatory response are essential links in the occurrence and development of AKI. This study established bilateral renal mild and severe IRI-AKI models in mice. We evaluated the renal microcirculation hemodynamic changes and inflammatory response of AKI using CEUS based on VCAM-1 TM. The value of CEUS based on VCAM-1 TM in evaluating the severity of AKI was explored. The results showed that the AUC in the s-AKI group was significantly lower than that in the m-AKI group, and the NID in the s-AKI group was substantially higher than that in the m-AKI group. Moreover, AUC and NID showed a linear correlation with pro-inflammatory factors (TNF-α and IL-6). In addition, compared with early AKI biomarkers (Cys-C, KIM-1, and NGAL), CEUS based on VCAM-1 TM has higher sensitivity in assessing the severity of AKI. All these results indicate that CEUS based on VCAM-1 TM has a good value in evaluating the severity of AKI.
Previous studies have reported that IRI-AKI models with different injury degrees can be established by varying the renal ischemia time [14]. In our study, the bilateral renal ischemia time of mice in the m-AKI group was 22 min, the ischemia time of mice in the s-AKI group was 35 min, and the reperfusion time of both groups was 12 h. The results showed that the levels of Scr and BUN in both groups were increased to varying degrees, which was consistent with the diagnosis of mild and severe IRI-AKI according to the AKI staging criteria proposed by the KDIGO definition. In addition, the PAS staining results in the AKI groups suggested that tubular injury occurred, which was consistent with the pathological changes of IRI-AKI.
CEUS is a pure-blood pool imaging technology that can display real-time blood flow perfusion of organs and tissues [15–17]. Studies have confirmed that the microbubbles did not influence renal microcirculation [18]. Since the blood flow of the renal cortex accounts for more than 90% of the total blood flow of the kidney, which can reflect the blood flow perfusion of the renal parenchyma [9], the renal cortical ROI was taken as the observation area to focus on the analysis in this study. In addition, based on the quantitative analysis indicators proposed in previous studies, most studies have suggested that AUC has a certain value in evaluating blood flow perfusion, and AUC reflects the cumulative effect of contrast enhancement within a specific ROI over a certain period [19]. Therefore, the AUC was compared and analyzed in our study. The results showed that the AUC in the m-AKI group and the s-AKI group was lower than that in the sham group, and the AUC in the s-AKI group was lower than that in the m-AKI group, which was consistent with previous research results, indicating that with the aggravation of AKI, renal microcirculation perfusion also decreased [20].
Inflammatory response plays a crucial role in the occurrence and development of AKI. IRI leads to renal synthesis of pro-inflammatory cytokines such as IL-6 and TNF-α [21, 22]. In the present study, both IL-6 and TNF-α levels were significantly elevated in renal tissues of the m-AKI and s-AKI groups, consistent with literature reports. Moreover, correlation analysis also showed that ultrasound variables (AUC and NID) were linearly correlated with IL-6 and TNF-α levels in kidney tissue. In addition, during early AKI injury, renal endothelial cell dysfunction leads to increased expression of adhesion molecules such as VCAM-1, increased vascular permeability, and thus promoting renal microcirculation perfusion changes and inflammatory response [23]. Ultrasonic molecular imaging based on VCAM-1 TM can reflect the changes of VCAM-1 molecular expression in tissues. In our study, NID in the m-AKI and s-AKI groups was higher than that in the sham group, and NID in the s-AKI group was higher than that in the m-AKI group, which was in good agreement with the immunohistochemical results. These results suggest that CEUS based on VCAM-1 TM can evaluate the inflammatory response of different severity of AKI.
Some scholars have proposed that Cys-C, KIM-1, and NGAL can be used for early monitoring of AKI [6, 7, 24]. However, in our study, there was no statistically significant difference in Cys-C levels between the m-AKI group and the sham group, and there was also no statistically significant difference between the m-AKI group and the s-AKI group. In addition, KIM-1 and NGAL levels in the m-AKI group and s-AKI group were increased to varying degrees. Still, the difference between the two groups was not statistically significant, indicating that neither Cys-C nor KIM-1 and NGAL could timely assess the severity of AKI.
There are some limitations in this study. Firstly, only one ischemia time point was evaluated in the m-AKI and s-AKI groups, and secondly, only 12 h of reperfusion time point was evaluated. In the future, more ischemia and reperfusion time points will be improved to further assess the value of CEUS based on VCAM-1 TM in evaluating the severity of AKI.
Conclusion
In summary, CEUS based on VCAM-1 targeting microbubbles can evaluate renal microcirculation perfusion and inflammatory response in different severity of AKI, which can provide helpful information for diagnosing and assessing AKI severity.
Funding
This study was supported by the National Natural Science Foundation of China (No. 82001817 and 81971635) and Project funded by the Logistics Support Department of the Military Commission (21BJZ13).