
Abstract
BACKGROUND:
This study aimed to construct an effective Nomogram for the differential diagnosis of cervical tuberculosis lymphadenitis (CTBL) and cervical metastatic lymph node (CMLN) based on ultrasound (US).
METHODS:
Retrospectively analyzed 227 patients with CTBL and CMLN who attended Hangzhou Red Cross Hospital from January 2020 to October 2022, and were divided into a training set (n = 163) and a validation set (n = 64) according to the clinical data, US, and CEUS qualitative and quantitative analysis data were recorded to establish the prediction model and perform validation. The area under curve (AUC) of the receiver operating characteristic curve (ROC) was used to assess the discrimination of the model; the calibration curve and brier coefficient were used to assess the calibration of the model; and a Nomogram prediction model was constructed to visualize the results nomogram prediction model was constructed to visualize the results.
RESULTS:
Gender (OR = 0.200, 95% CI:0.090–0.470, P < 0.001), age (OR = 0.170, 95% CI:0.070–0.410, P < 0.001), liquefaction necrosis (OR = 2.560, 95% CI:1.080–6.040, P = 0.033), perfusion defect (OR = 2.570, 95% CI:1.010–6.580, P = 0.048), and standard deviation (StdDev) (OR = 3.040, 95% CI:1.220–7.570, P = 0.017) were the independent predictors of the constructed model. The AUCs of the constructed predictive model in the training set and validation set were 0.844 and 0.927, respectively; from the calibration curves, it was observed that the predicted values of the model and the actual observed values fell near the 45° diagonal, and the brier scores were 0.145 and 0.109 in the training set and validation set, respectively.
CONCLUSION:
StdDev combined with gender, age, and the presence of liquefaction necrosis and perfusion defects are important features to identify CTBL and CMLN, and the constructed visual nomogram is intuitive and convenient to improve the efficiency of clinical work.
Introduction
Tuberculosis (TB) is a specific infectious disease caused by mycobacterium tuberculosis (MTB), and the Global Tuberculosis Report 2023 shows that TB remains the second most common single infectious cause of death globally after the COVID-19 [1]. Extrapulmonary tuberculosis (EPTB) is defined as TB at sites other than the lungs, of which cervical tuberculosis lymphadenitis (CTBL) is a common type of lesion in EPTB, accounting for approximately 20% of all EPTB cases [2, 3]. The clinical symptoms of CTBL are insidious, and early diagnosis is challenging. Some early TB patients can be effectively controlled by standardized anti-TB drug therapy. CTBL can form cold abscesses with the development of the disease, and even rupture to form sinus tracts, which makes the patients suffer from great pain physically and mentally, so the early diagnosis is of great significance for the treatment of CTBL. The occurrence of cervical metastatic lymph node (CMLN) is very common, and the sites of origin are most common in organs such as the oral cavity, nasopharynx, and thyroid gland [4–6]. Accurate diagnostic evaluation of CMLN is an important factor in staging the tumor, selecting the optimal treatment strategy, and evaluating the patient’s prognosis. There have been many previous studies on the differential diagnosis of benign and malignant lymph nodes [7, 8], but there have been difficulties in the differential diagnosis of CTBL and CMLN [8–10], and the treatment modalities of CTBL and CMLN are distinctly different, so accurate identification of the two is crucial for the development of subsequent treatment strategies.
Conventional ultrasound (US) examination is a commonly used imaging technique for the evaluation of cervical lymph nodes, which can be analyzed by observing the size, morphology, internal echoes, and their color doppler flow imaging (CDFI) characteristics. Due to the high overlap between the morphology, internal echo characteristics and CDFI blood flow distribution type of CTBL and CMLN [11–14], so that there is a degree of difficulty in identifying both CTBL and CMLN using US.
Contrast-enhanced ultrasound (CEUS) is able to show the microvascular perfusion of the lesion in real time [15]. CEUS combined with US examination can significantly improve the diagnostic accuracy of benign and malignant diseases in lymph nodes, with a sensitivity and specificity of 92% and 91%, respectively [16]. In the qualitative analysis of CEUS, CTBL and CMLN have similar manifestations such as inhomogeneous enhancement, perfusion defects, and centripetal enhancement [17–19], which makes it difficult to differentiate between the two. CEUS quantitative analysis is performed by software to delineate the region of interest (ROI) and plot the time-intensity curve (TIC), Cui et al. [20] reported that CEUS quantitative analysis has high diagnostic value in distinguishing CTBL from CMLN. However, studies on CEUS quantitative analysis in the differential diagnosis between CTBL and CMLN are still limited.
Logistic regression model is one of the most commonly used statistical models in medical journals [21]. Nomogram quickly gives the probability of diagnostic outcome based on the results of multifactorial logistic regression analysis by transforming complex mathematical formulas into forms such as visual graphs or links, which facilitates clinical work [22]. In view of this, in this study, a binary logistic regression model was established to draw a nomogram by analyzing the qualitative and quantitative features of US as well as CEUS of CTBL and CMLN, so as to allow for a more intuitive clinical differential diagnosis of CTBL and CMLN, and to improve the efficacy of the differential diagnosis of both CTBL and CMLN.
Materials and methods
Patients
The study protocol was approved by the Human Research Ethics Committee of Hangzhou Red Cross Hospital (approval number 2022KY173). The study was in accordance with the Declaration of Helsinki, and all patients signed an informed consent form. CTBL and CMLN cases treated at Hangzhou Red Cross Hospital between January 2020 and October 2022 were analyzed retrospectively. All patients were examined by US and CEUS in our hospital. The study was approved by the Medical Ethics Committee of Hangzhou Red Cross Hospital. Inclusion criteria: (1) CTBL patients who were positive by pathogenetic testing (antacid bacillus smear, mycobacterial culture, GeneXpert MTB/RIF or second-generation sequencing); (2) CMLN patients who were diagnosed pathologically; (3) all the patients had complete clinical data, US sonograms, and CEUS motion picture videos. Exclusion criteria: (1) poor quality of US and CEUS images, retained CEUS video of too short a duration or video images not consistently focused on the target lymph nodes; (2) lymph nodes that appeared to have rupture phenomenon or were too large to be shown completely; (3) patients who had already received relevant tuberculosis treatment, chemotherapy and radiotherapy; (4) patients under the age of 18 years. The diagnostic criteria of CTBL and CMLN are shown in Table 1.
Diagnostic criteria for CTBL and CMLN
Diagnostic criteria for CTBL and CMLN
Depending on the examination time of the included cases, 163 CTBL and CMLN cases from January 2020 to December 2021 were used as the training set for the training model, while 64 CTBL and CMLN cases from January 2022 to October 2022 were used as the validation set for the validation model. The flowchart of the case screening process and the division of the training and validation sets are shown in Fig. 1.
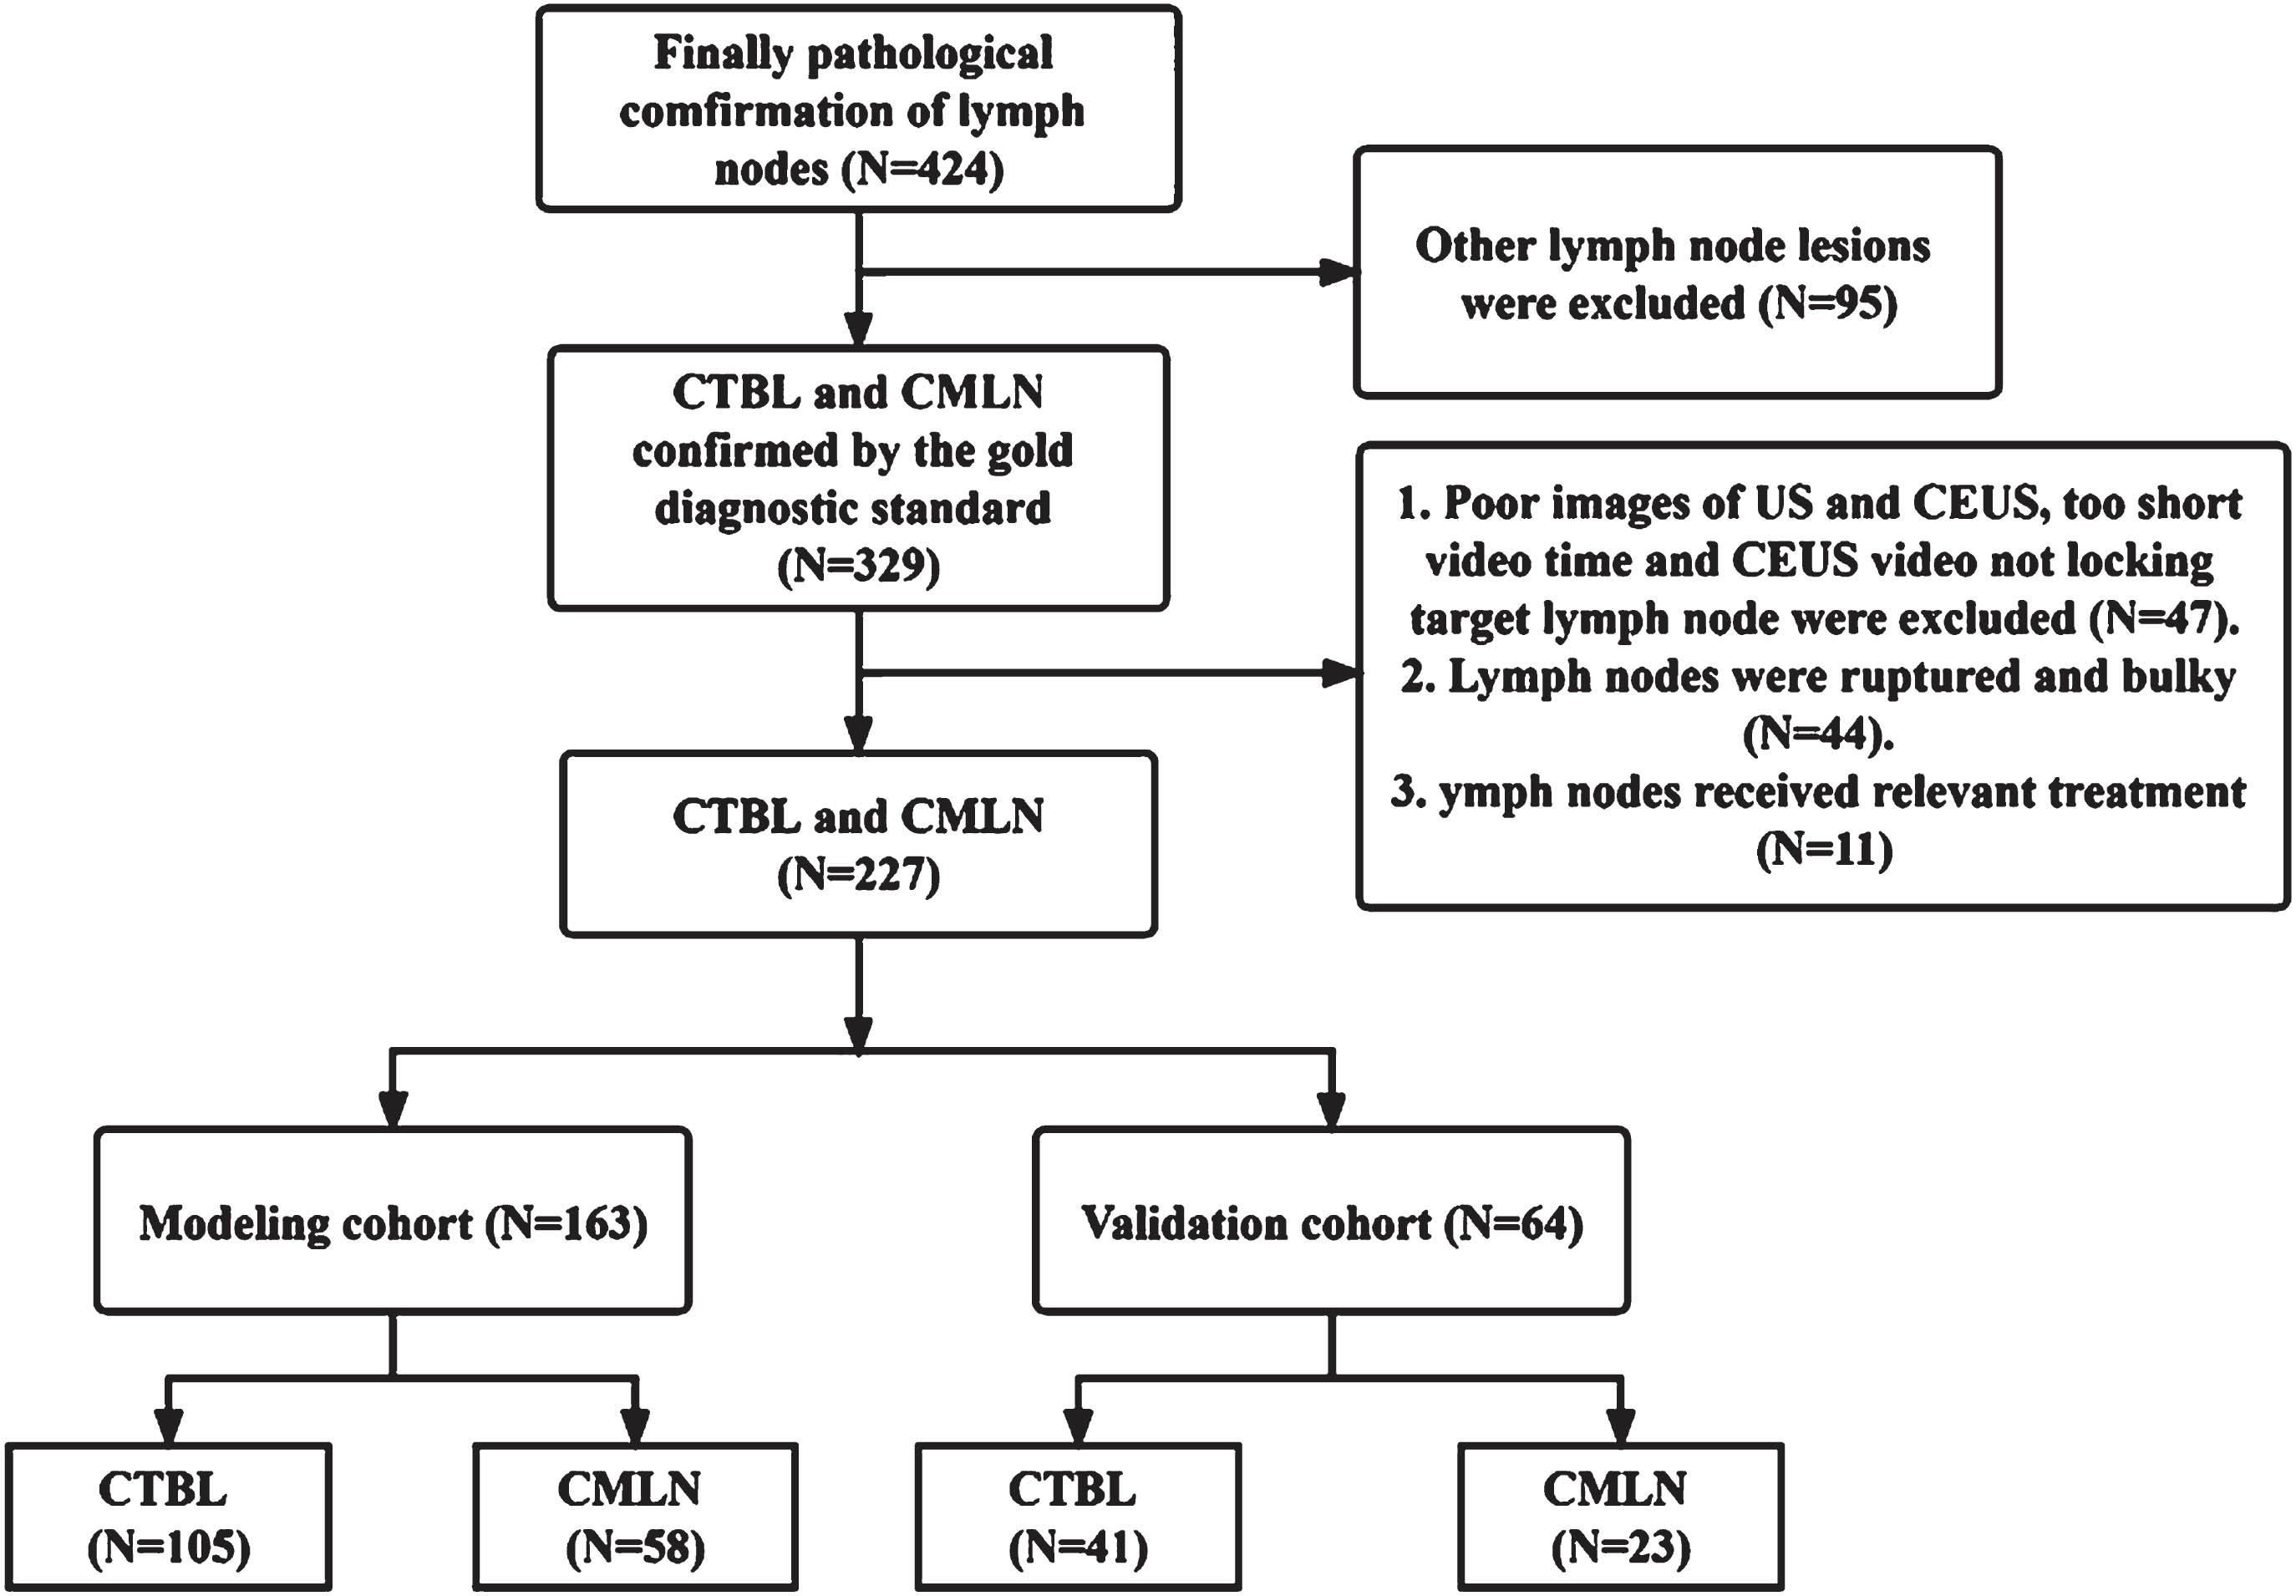
Study subject screening process and allocation of modeling and validation sets.
All CEUS examinations were performed by radiologists with more than 15 years of experience in CEUS examinations. US examinations were performed using a Philips iU-Elite ultrasound system (Washington, D.C., USA) with L12-5 linear array probes (frequency range, 5–12 MHz) and L9-3 linear array probes (frequency range, 3–9 MHz) and a Mindray Resona 7S ultrasound system (Shenzhen, China) with L14-5WU linear array probe (frequency range, 5–14 MHz) and L9-3U linear array probe (frequency range, 3–9 MHz). CEUS contrast agent was used with SonoVue (Bracco SpA, Milan, Italy), which was diluted with 5 mL of saline (NS) and shaken well before use. After routine ultrasonography, 2.4 mL of contrast agent was injected through the anterior vein of the elbow fossa, followed by a 5 mL saline flush. The dynamic process of contrast agent entry and elution in the target lymph node was observed continuously for 2 min, and the CEUS video was stored in the hard disk for subsequent analysis.
US features, including size, border, lymphatic gates, internal echoes, calcification, liquefaction necrosis, and CDFI flow type, were recorded according to previous studies. Qualitative CEUS features included in this study for qualitative analysis included: enhancement homogeneity (homogeneous or inhomogeneous), presence of a perfusion defect, presence of circumferential enhancement, and direction of enhancement (centrifugal, centripetal, or mixed enhancement). The stored CEUS videos were analyzed offline using QontraXt software (version V3.06), and the ROIs outlined the entire lymph node on the contrast images. The ROIs were outlined three times, and the TIC curves were plotted, and then the average of the three CEUS quantitative parameters was calculated and recorded. The TIC quantitative indexes included peak intensity (PI), time to peak (TTP), and time to peak (TTP), sharpness, area under curve (AUC), Standard deviation (StdDev).
All images and videos were reviewed independently by two radiologists who had no knowledge of the clinical history and pathologic findings. In cases of disagreement between the two radiologists, a consensus was reached after further data analysis to make the final decision.
Statistical analysis
Data analysis was conducted using SPSS (version 25.0, IBM Corp., Armonk, NY, USA) and R 4.1.2 software (R Foundation for Statistical Computing, Vienna, Austria). Measures conforming to normal distribution were expressed as mean±standard deviation; non-normally distributed measures were expressed as median (quartiles) [M(Q1, Q3)], Whereas categorical data are expressed in terms of sample size (N) and percentage (%). Comparisons between groups were performed using Student’s t-test for continuous data and Pearson’s χ2 test or Fisher’s exact test for categorical data. One-way and multifactor logistic regression analyses were performed to determine the final independent predictors for the general information and US and CEUS qualitative and quantitative analysis characteristics of the training set. The performance of the predictive model was assessed using the validation set by plotting the Receiver operating characteristic curve (ROC), whose AUC can be used as an evaluation index of model differentiation. To assess the calibration of the model, the degree of agreement between the predicted risk and the actual occurrence risk of the model was reflected by plotting the calibration curve, and the calibration curve was plotted according to the actual and predicted occurrence rates.
Results
Participant characteristics
This part of the study collected 146 patients with CTBL and 81 patients with CMLN from January 2020 to October 2022 after screening with strict inclusion and exclusion criteria. Of the 146 CTBL patients, 51 were male and 95 were female, with an age range of 18–94 years and a mean age of (39.3±16.1) years, and of the 81 CMLN patients, 59 were male and 22 were female, with an age range of 20–88 years and a mean age of (57.9±16.0) years. The 81 cases of CMLN were originated from 18 nasopharyngeal cancers, 15 lung cancers, 14 thyroid cancers, 8 gastric cancers, 5 cases each of esophageal and intestinal cancer, 4 cases of salivary adenocarcinoma, 3 cases each of breast and airway cancer, 2 cases of cholangiocarcinoma, and 1 case each of bladder, ureteral, tonsil, and thymic cancer.
Comparison of clinical data, US, CEUS qualitative and quantitative analyses of the training and validation sets
In this study, continuous variables were converted to dichotomous variables by selecting the mean and median as cutoff values, respectively. Comparison of clinical data as well as ultrasound characteristics between the training and validation sets is shown in Table 1, and the four items of short diameter ≥1.3, Lymphatic hilar absence, sharpness ≥0.183, and AUC ≥6.15 were statistically different between the training and validation sets (P < 0.05) (Table 2).
Comparison of clinical data, US, CEUS qualitative and quantitative analysis of the training and validation sets
Comparison of clinical data, US, CEUS qualitative and quantitative analysis of the training and validation sets
Comparison of clinical data, US and CEUS qualitative and quantitative analysis data between CTBL and CMLN are shown in Table 3 gender, age, short diameter, L/S, presence of liquefaction necrosis, CDFI flow type, enhancement homogeneity, presence of perfusion defect and presence of rim enhancement, and the StdDev, were statistically different between CTBL and CMLN (P < 0.05). The US and CEUS images of CTBL and CMLN cases are analyzed in Fig. 2.
Comparison of general information, US, CEUS qualitative as well as quantitative characteristics between CTBL and CMLN
Comparison of general information, US, CEUS qualitative as well as quantitative characteristics between CTBL and CMLN
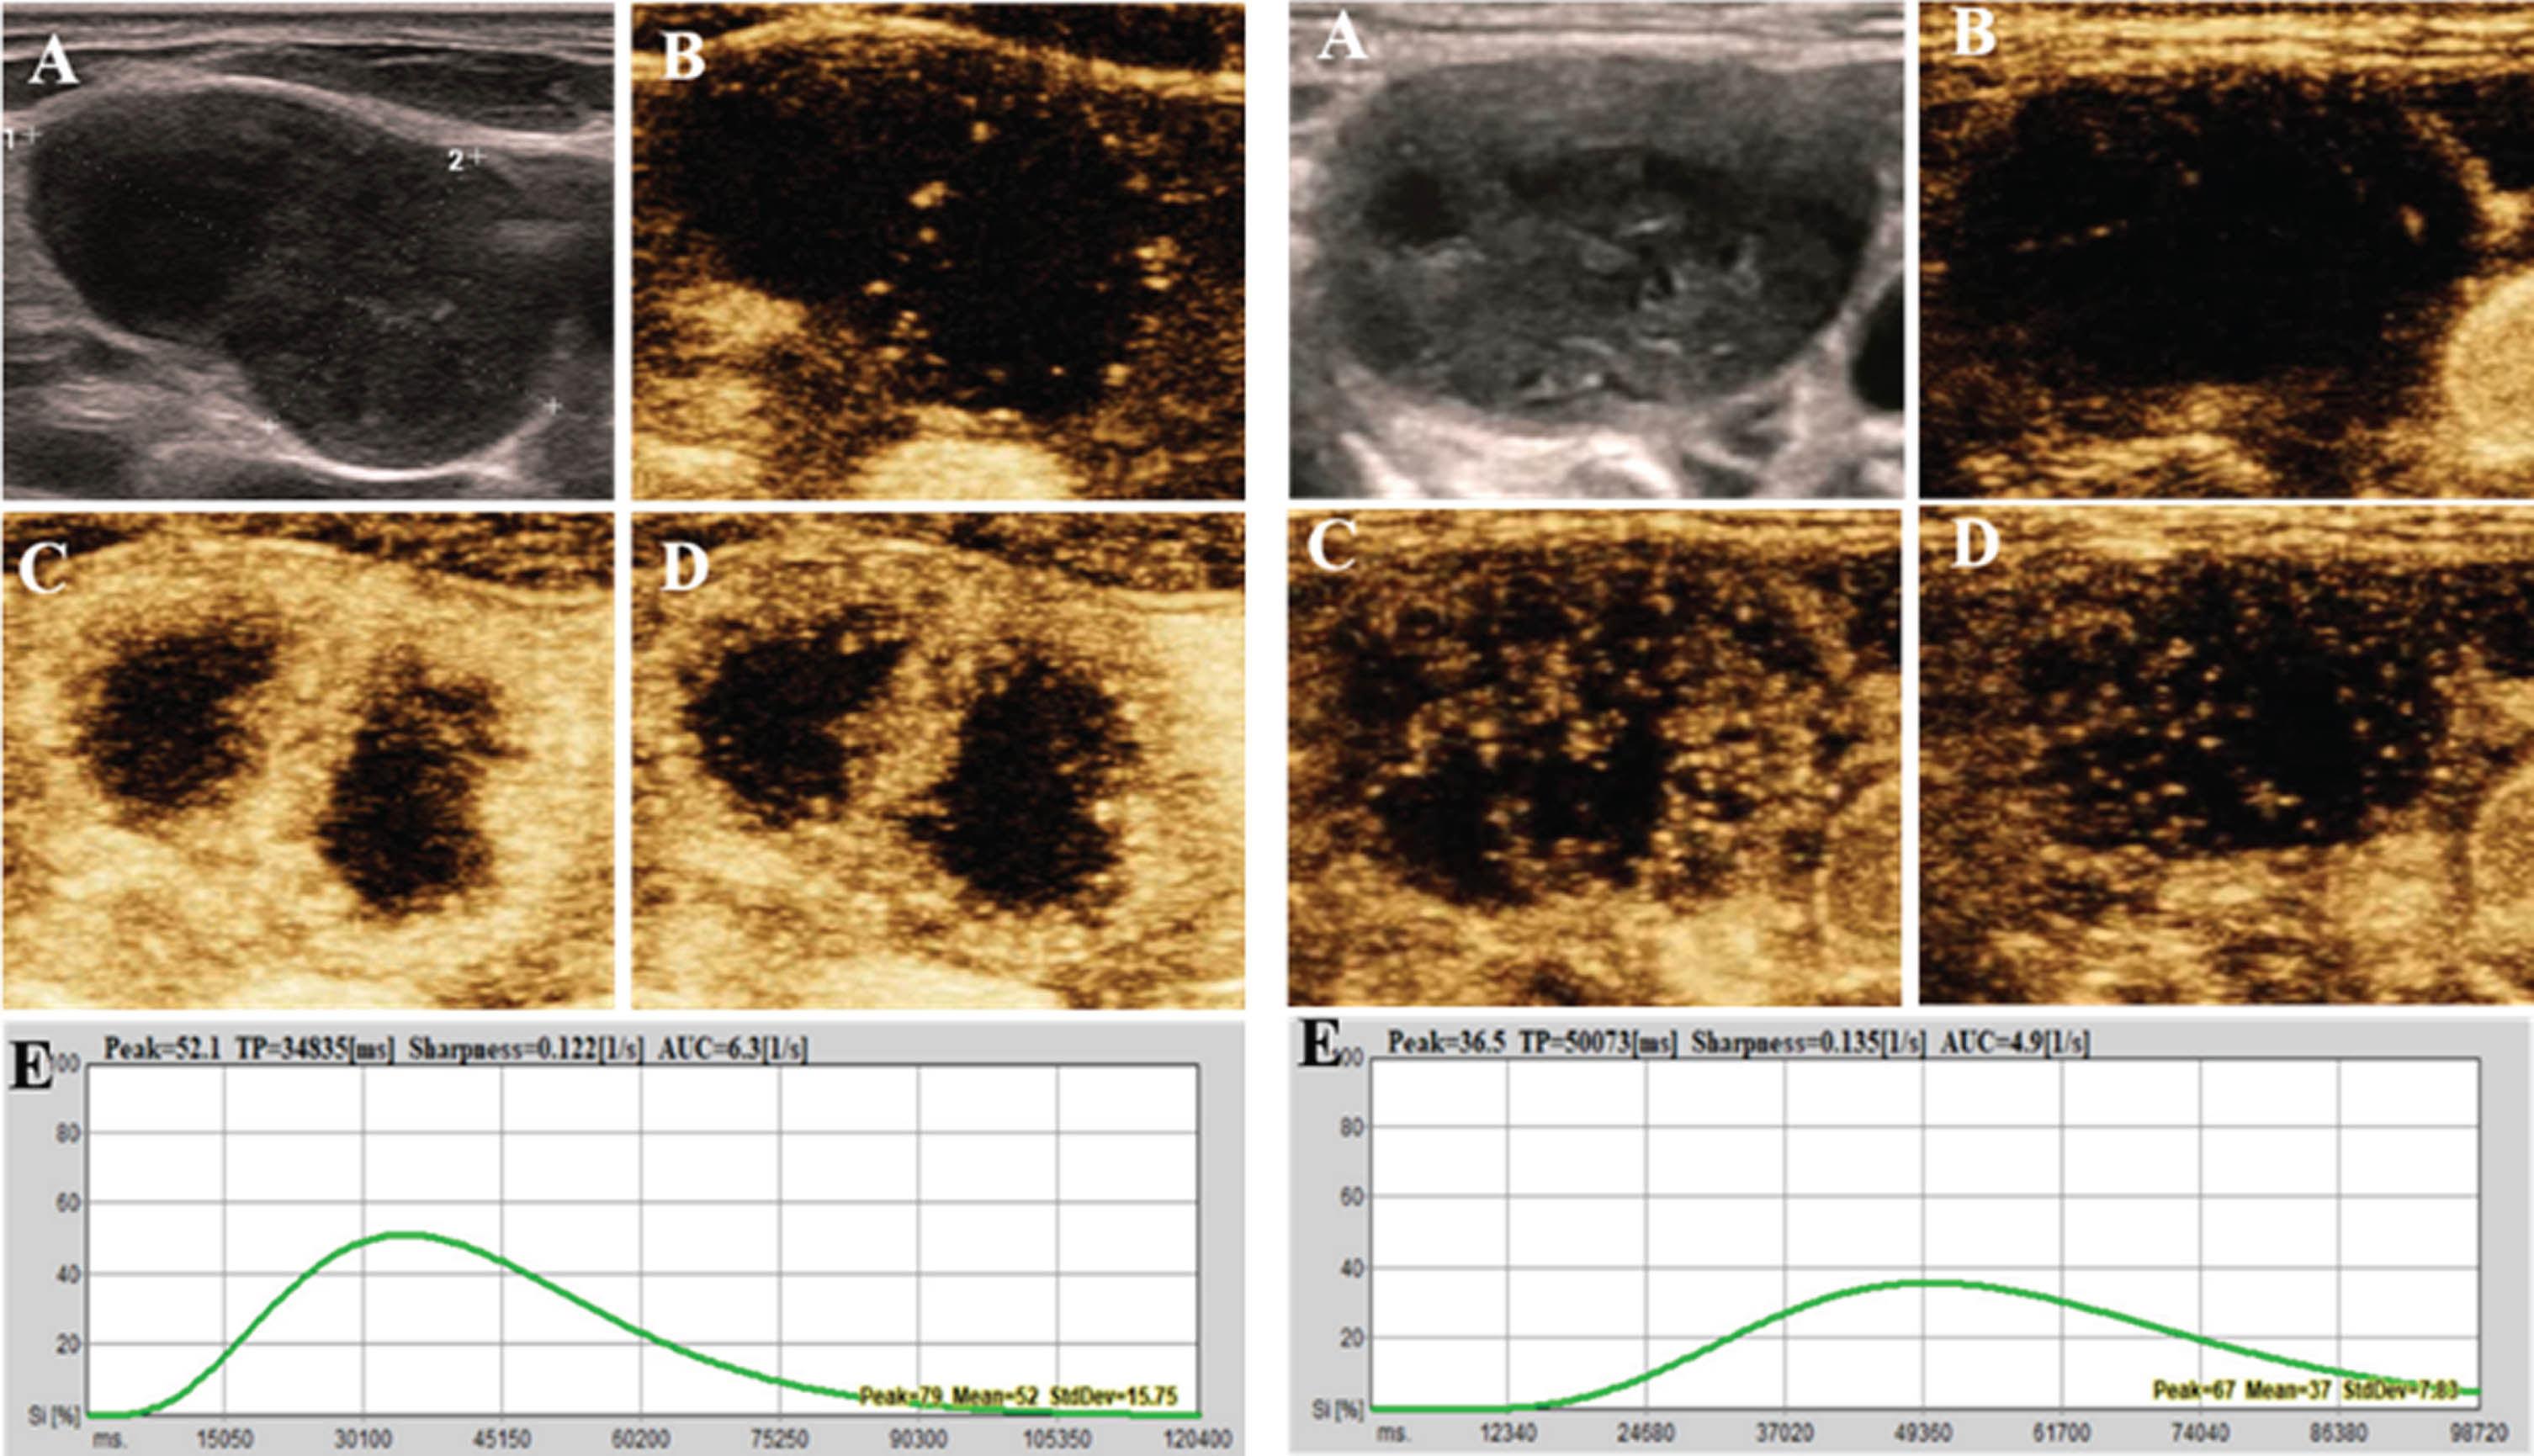
US, CEUS images of CTBL and CMLN case. A case of CTBL is shown on the left. A. US shows a hyperechoic lymph node with liquefied necrosis seen within and unclear lymphatic portal structure; B. The lymph node is enhancing from the periphery at 11s of contrast injection; C. The lymph node is segregated and hyper-enhanced at 24s of contrast injection; D. The contrast subsides in the area of enhancement of the lymph node at 31s of contrast injection; E. TIC curve corresponding to the ROI of the outline of this lymph node with StdDev = 15.75. The patient’s pathologic findings were chronic granulomatous inflammation with coagulative necrosis, Xpert and mycobacterial cultures were positive, and the clinical diagnosis was CTBL. The figure on the right shows a case of CMLN with past history of tuberculosis. A. US shows a hyperechoic lymph node with heterogeneous internal echogenicity and unclear lymphatic portal structure; B. The peripheral tissues of the lymph node begin to enhance at 18s of contrast injection; C. Enhancement is seen in the periphery and center of the lymph node at 36s of contrast injection, and a perfusion defect is seen in the lymph node; D. The contrast subsides in the area of enhancement of the lymph node at 49s of contrast injection; E. TIC corresponding to the ROI of the outline of this lymph node curve, StdDev = 7.83. Pathology suggests metastasis or infiltration of highly differentiated squamous carcinoma.
Gender, age, liquefaction necrosis, perfusion defect, and StdDev were the risk factors for this model, and the results of the univariate as well as multivariate logistic regression modeling are shown in Table 4 liquefaction necrosis (OR = 2.560, 95% CI:1.080–6.040, P = 0.033), the presence of a perfusion defect (OR = 2.570, 95% CI:1.010–6.580, P = 0.048), and StdDev ≥11.51 (OR = 3.040, 95% CI:1.220–7.570, P = 0.017) were positively correlated with CTBL, whereas males (OR = 0.200, 95% CI:0.090–0.470, P < 0.001), age ≥45 (OR = 0.170, the 95% CI:0.070–0.410, P < 0.001) were negatively associated with CTBL.
Logistic regression analysis of clinical data, US, CEUS qualitative and quantitative analysis in CTBL and CMLN
Logistic regression analysis of clinical data, US, CEUS qualitative and quantitative analysis in CTBL and CMLN
Figure 3 shows the ROC curves and calibration curves for the training and validation sets, respectively. The AUC of this prediction model in the training and validation sets are 0.844 (95% CI:0.780–0.909) and 0.927 (95% CI:0.861–0.994), with a sensitivity of 72.4% and specificity of 84.8% in the training set, and 95.7% in the validation set. 85.4% specificity for the validation set. The calibration curve observations yielded that the model predictions and actual observations fell near the diagonal, with training set and validation set P-values of 0.871 and 0.196, and Brier scores of 0.145 and 0.106, respectively, in the Hosmer-Lemeshow goodness-of-fit test.
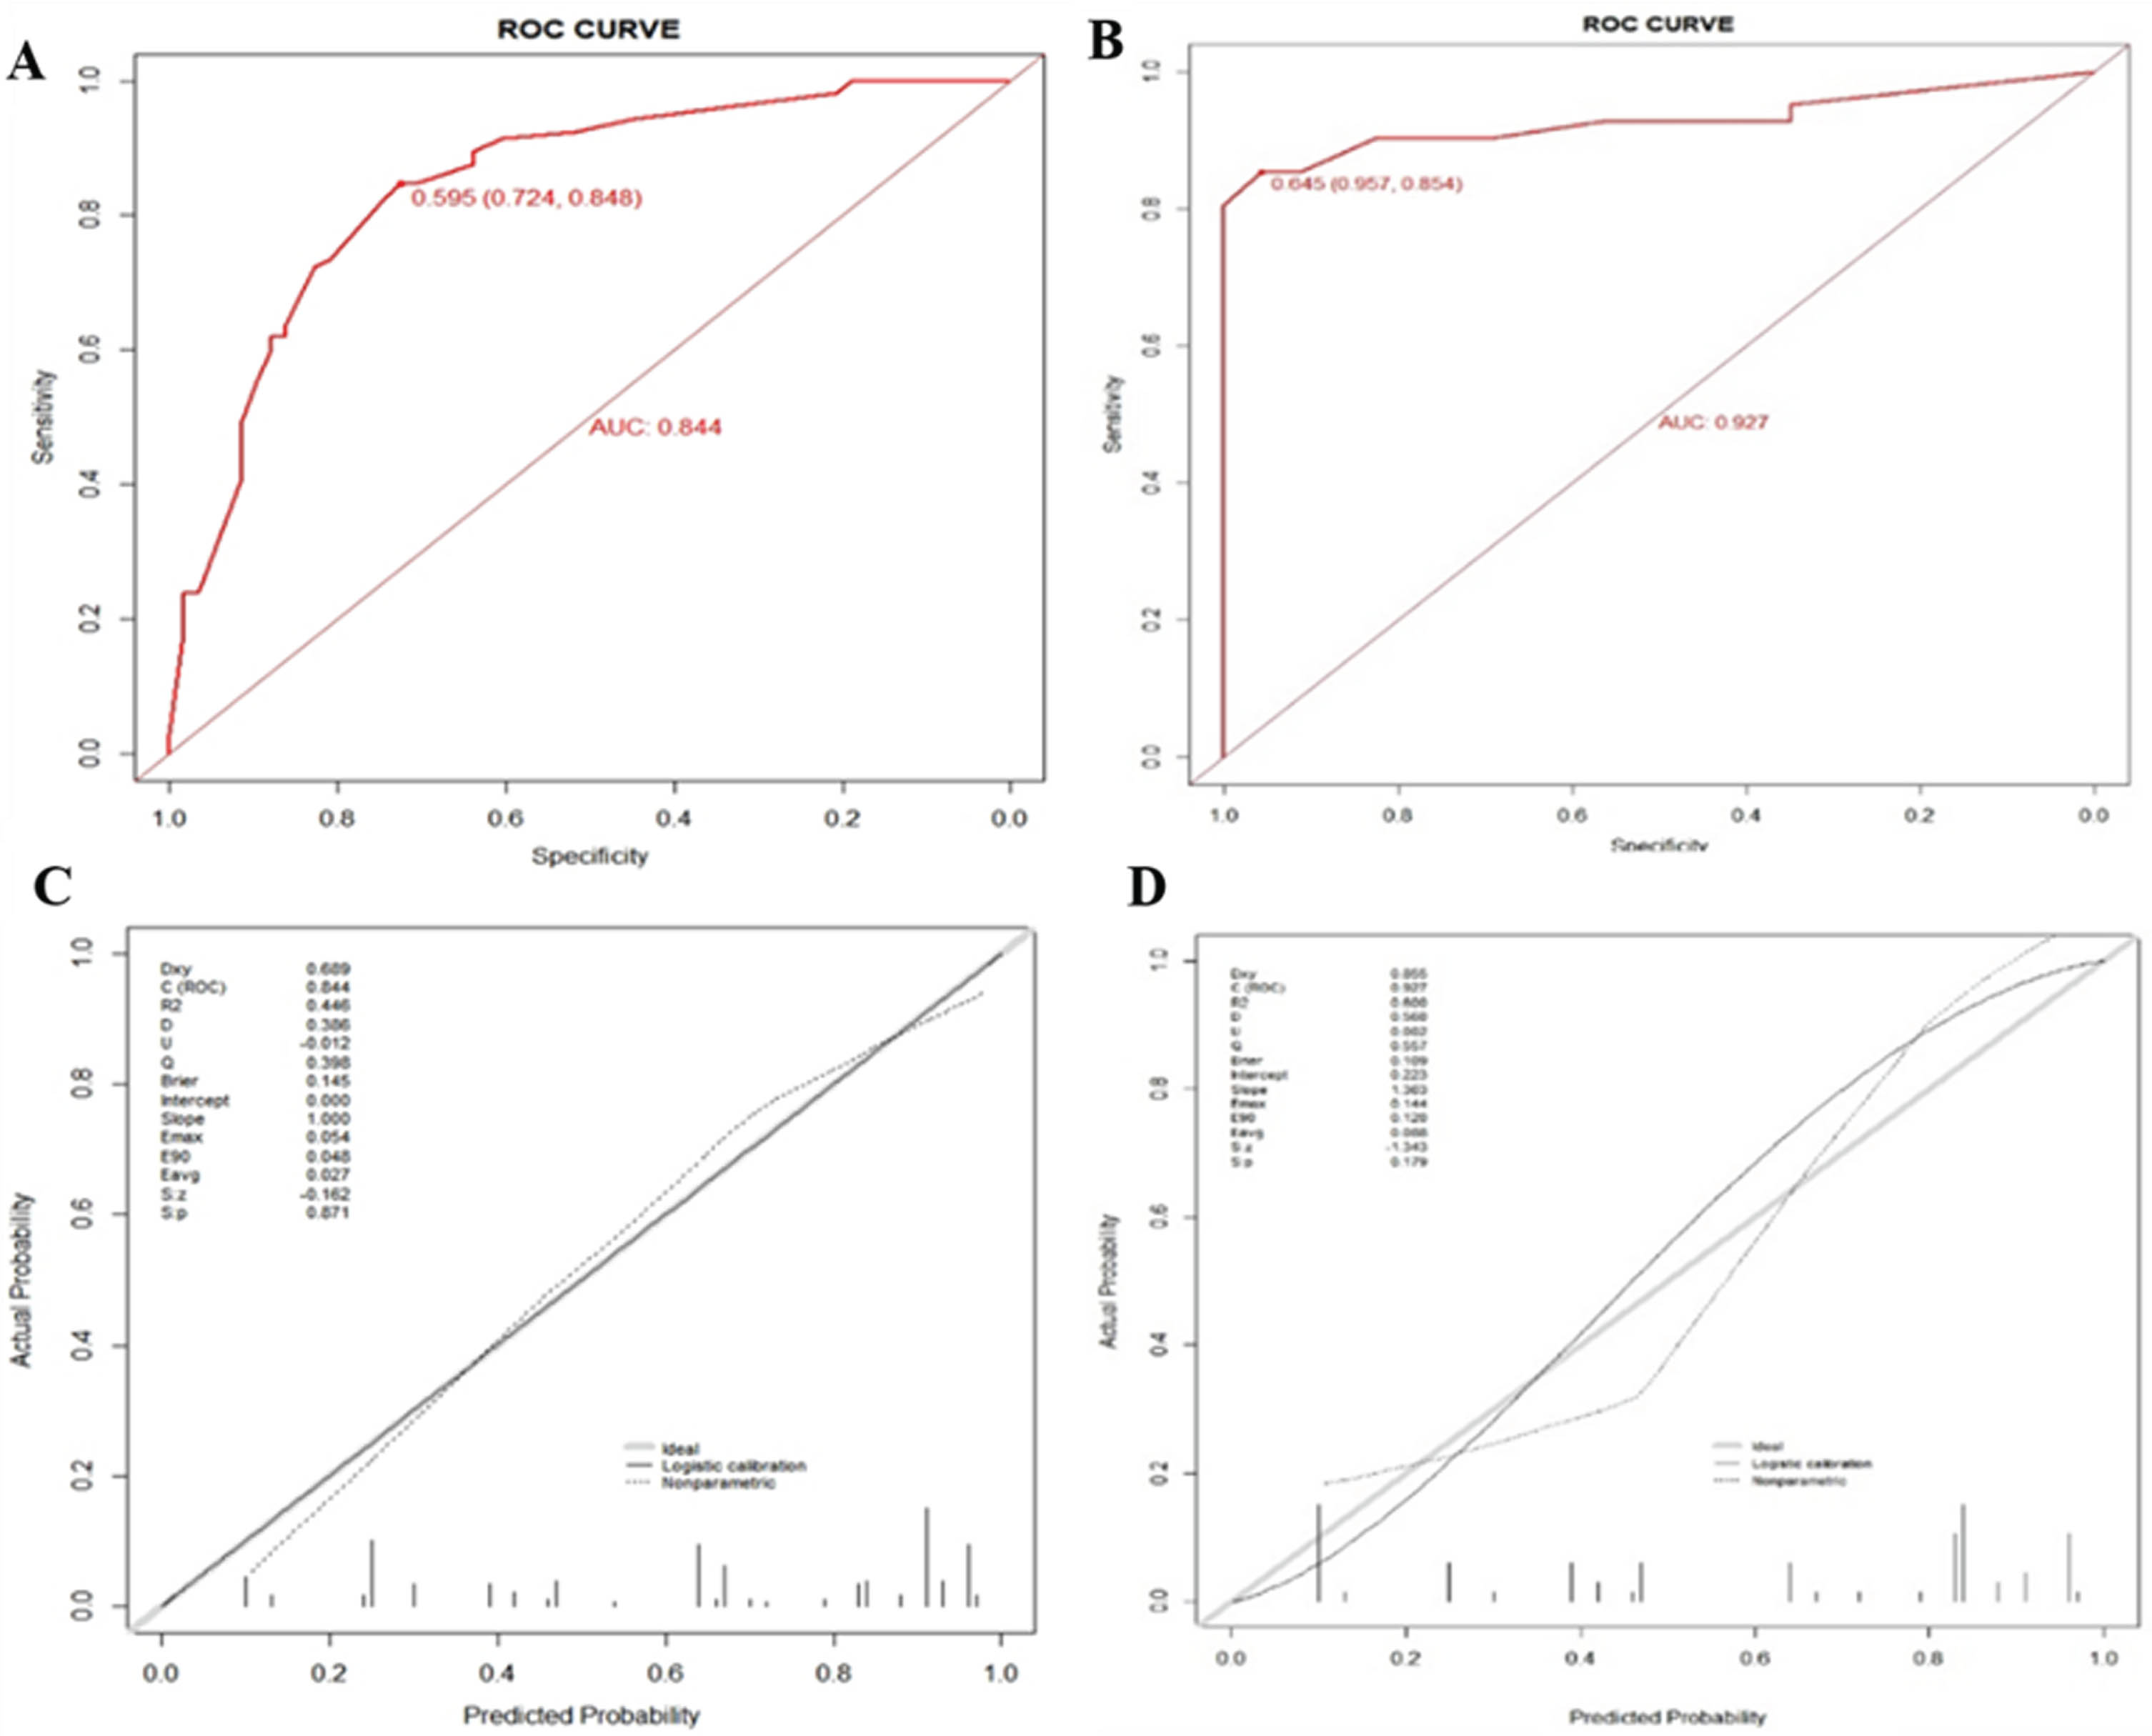
ROCs and calibration curves of the prediction model for the training and validation sets. (A) ROC for the training set. (B) ROC for the validation set. (C) calibration curve of the prediction model in the training set. (D) calibration curve of the prediction model in the validation set.
After the results of binary logistic multifactorial regression analysis, the nomogram for differential diagnosis of CTBL and CMLN was plotted and is shown in Fig. 4. By analyzing the Nomogram, the scores of the individual predictors could be inferred: female (score: 93.5), age <45 years (score: 100), presence of liquefaction necrosis (score: 49), presence of perfusion defect (score: 50), and StdDev ≥11.51 (score: 63). For patients with difficulties in determining CTBL and CMLN, the scores corresponding to each predictor on the Nomogram were superimposed to calculate the total score, and the probability corresponding to the total score on the Nomogram was the probability of CTBL occurrence.
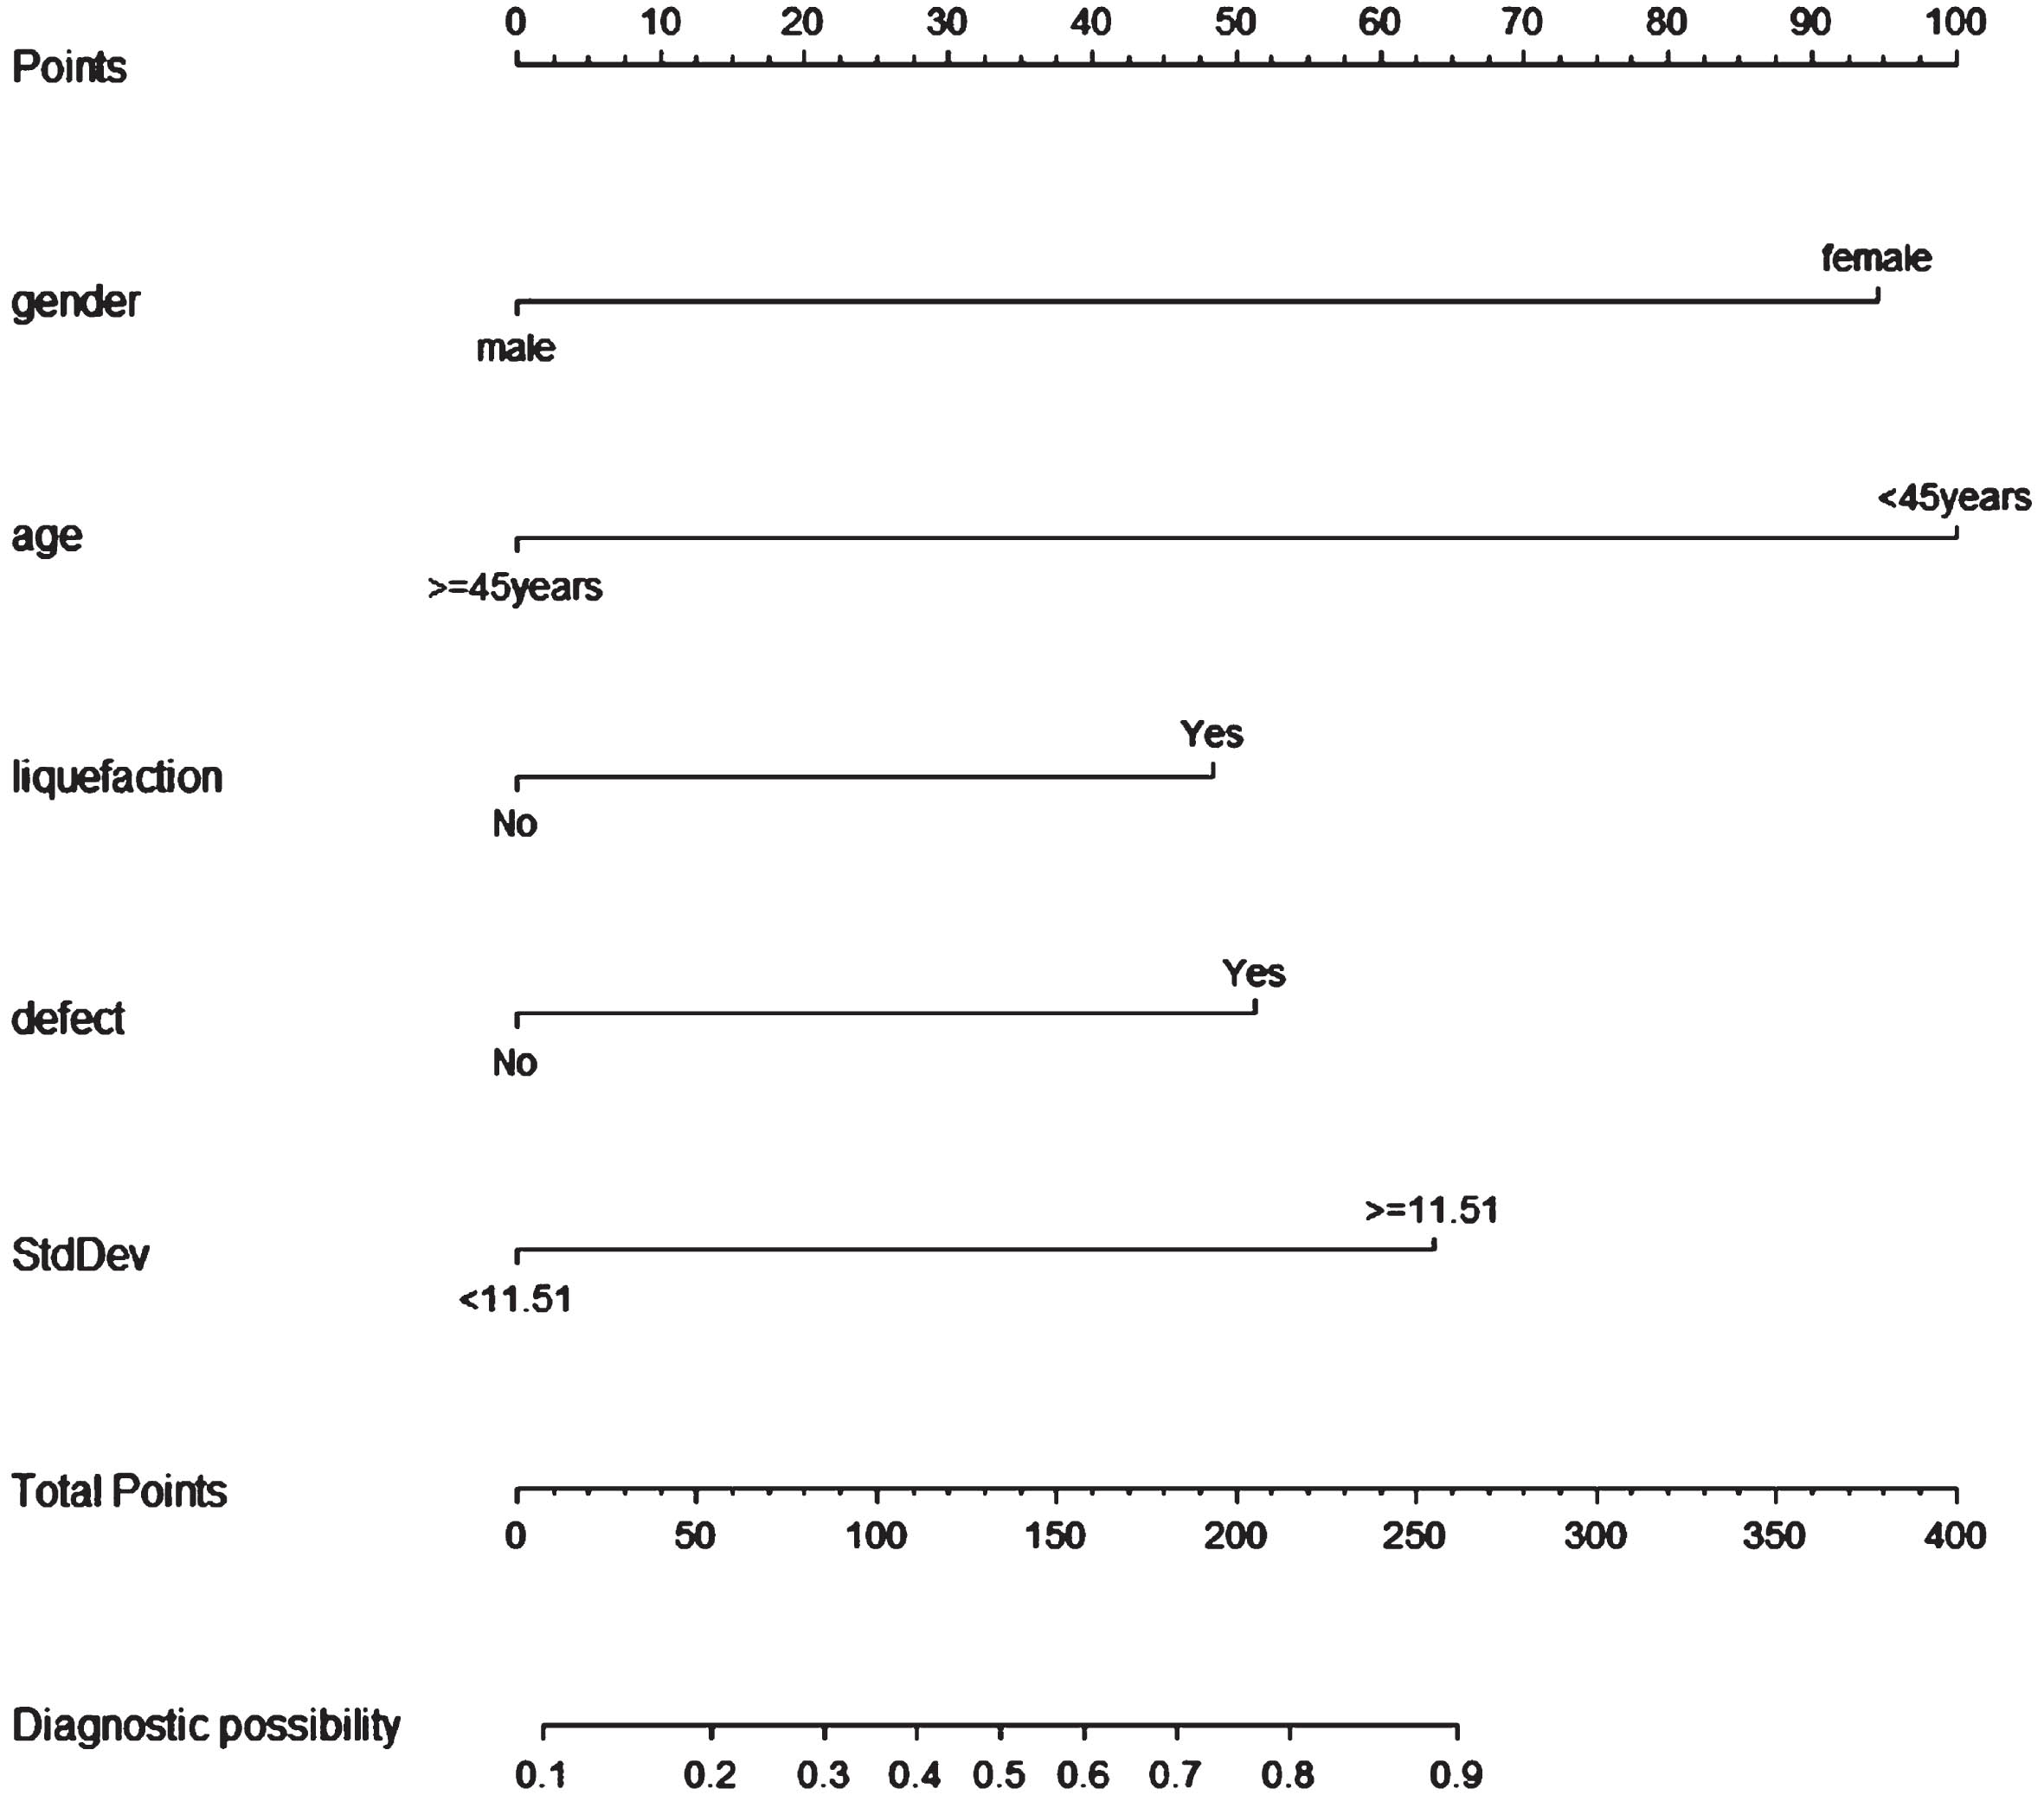
Nomogram for differential diagnosis of CTBL and CMLN.
Among the predictors in the logistic regression prediction model, The CEUS quantitative analysis model was constructed with five factors: gender, age, liquefaction necrosis, perfusion defect, and StdDev. The CEUS qualitative analysis model was constructed with four factors: gender, age, liquefaction necrosis and perfusion defects. The AUCs of the CEUS qualitative model and quantitative model were 0.907 and 0.927, respectively. but there was no statistically significant difference in the AUC values between the two models (P = 0.176), and the ROC of the two models are shown in Fig. 5.
Plotting the DCA curves of this predictive model for differential diagnosis of CTBL and CMLN (Fig. 5), the thresholds were in the intervals of 0.25–0.50 as well as 0.70–1.00, and the net benefit of the CEUS quantitative analysis model was higher than that of the CEUS qualitative analysis model. Since the epidemiologic prevalence of CTBL is approximately 20%, this suggests that the StdDev parameter has a greater significance in contributing to this predictive model and improving the differential diagnostic efficacy of this model.
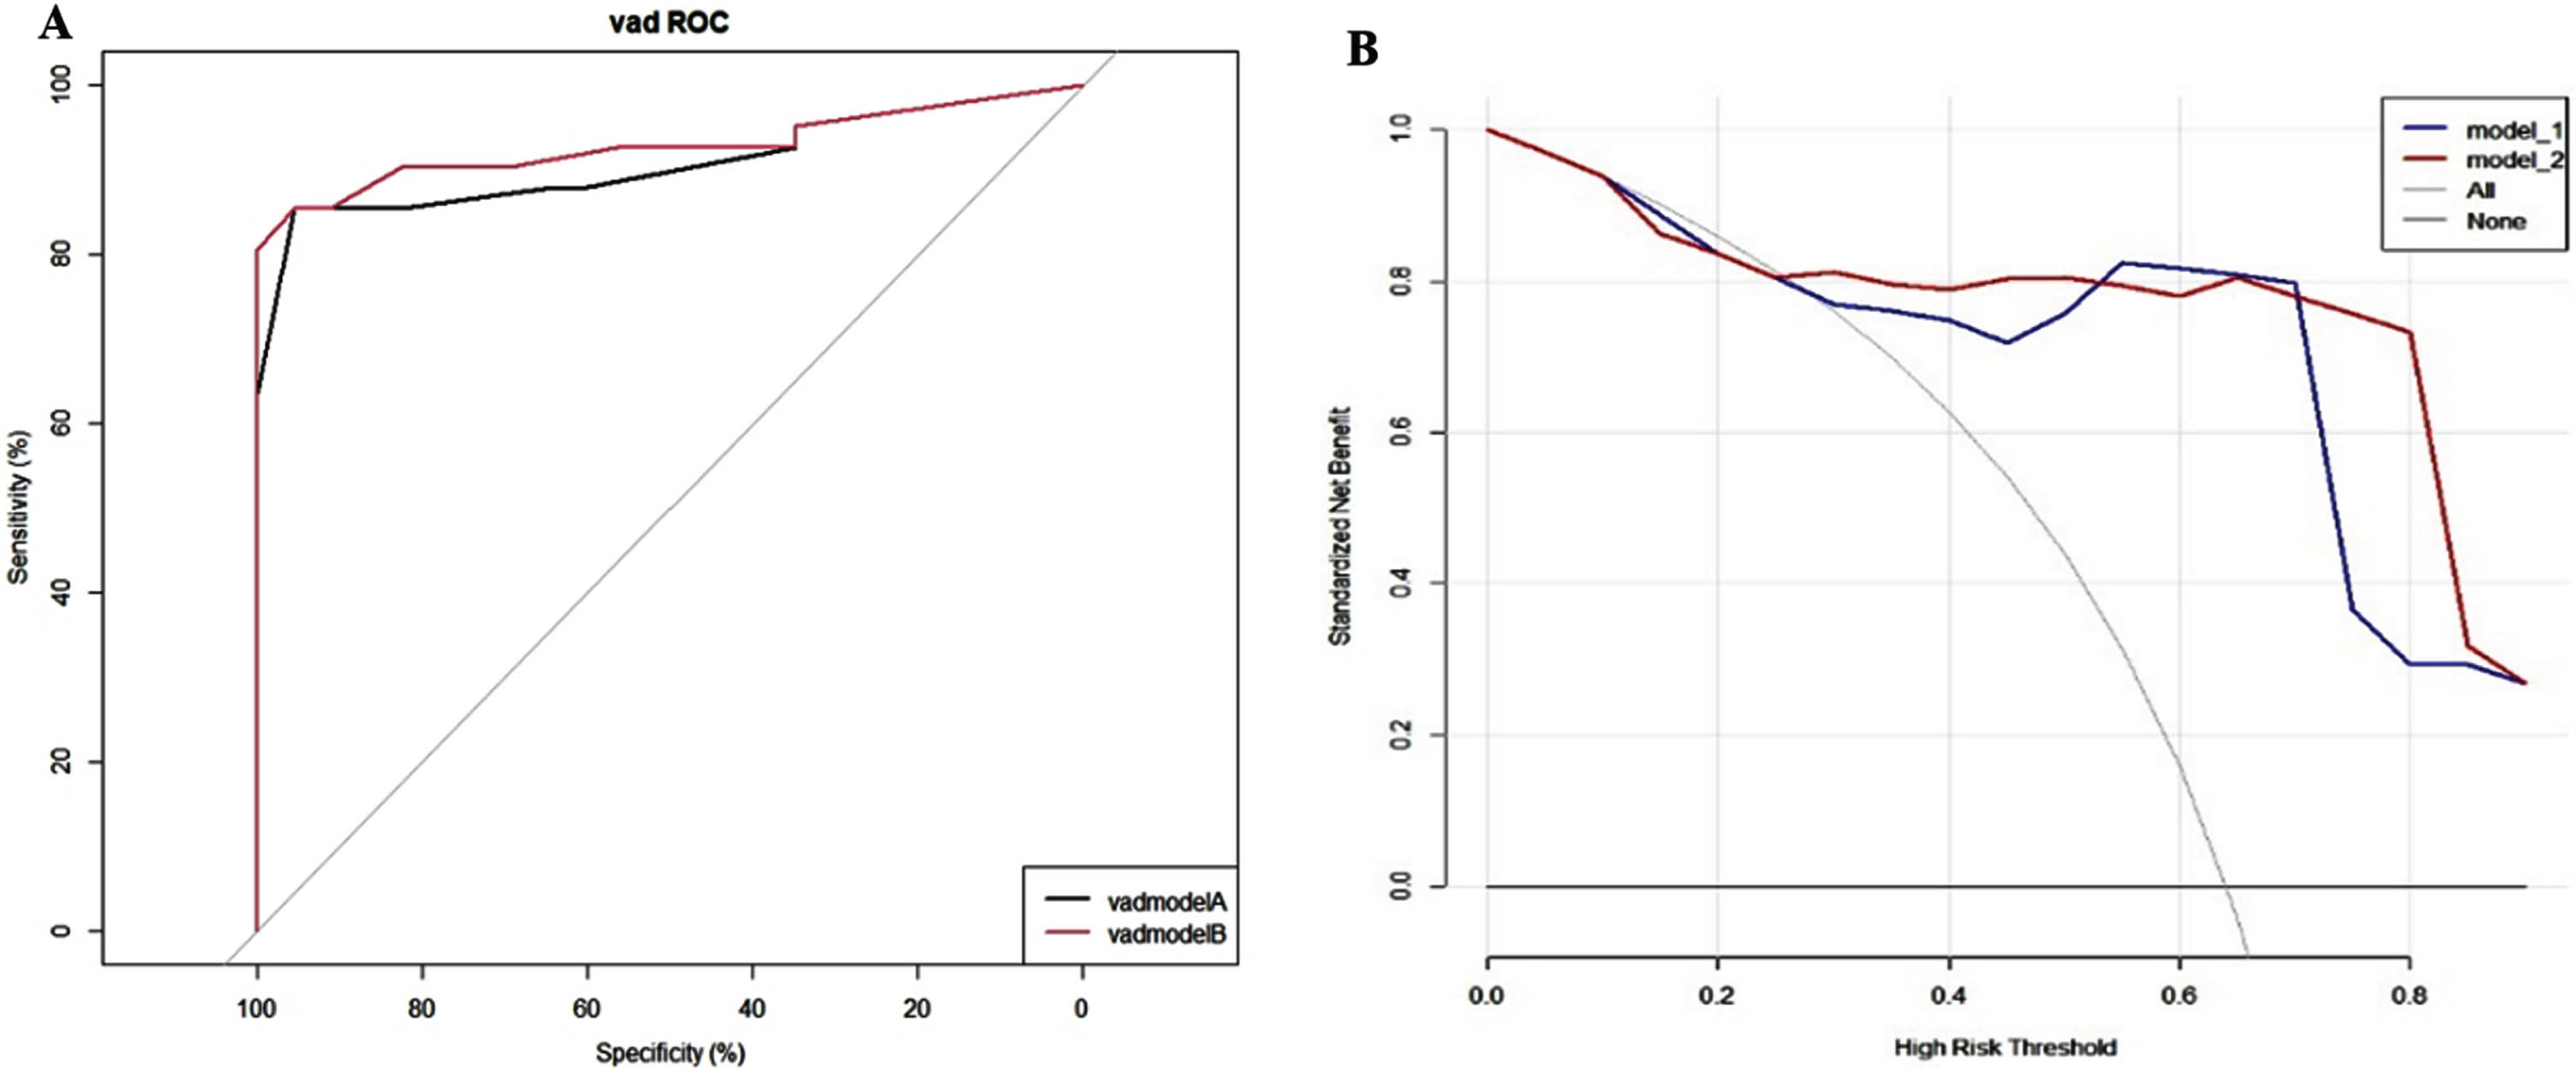
ROC and DCA plots for both CEUS quantitative and qualitative analysis models. (A) ROCs of CEUS quantitative and qualitative analysis models. red curve: CEUS quantitative model, black curve: CEUS qualitative analysis model. (B) DCA curves of CEUS quantitative and qualitative analysis models. red curve: CEUS quantitative model, blue curve: CEUS qualitative analysis model.
The risk of the probability of CTBL occurrence was partitioned into three groups according to low risk <20%, medium risk 20–50%, and high risk ≥50%. The result obtained was NRI = 14.0% for both groups, P = 0.070, suggesting that the predictive ability of the CEUS quantitative analysis model was enhanced with the addition of StdDev, which increased the correct classification rate by 14.0%. The calculated IDI = 2.6%, P = 0.062, suggests that the predictive ability of the CEUS quantitative analysis model is improved by 2.6% compared to the CEUS qualitative analysis model due to the addition of StdDev.
CTBL and CMLN are common causes of cervical lymph node enlargement, which can easily lead to confusion due to the similarity in clinical symptoms and imaging features. CTBL may exhibit varying degrees of necrosis and calcification at different stages of the disease, while the heterogeneity of different tumor sources leads to complex imaging manifestations of CMLN. The variety of enhancement patterns and densities further complicates differentiation. On CT images, both CTBL and CMLN can appear as low-density areas with annular enhancement [23]. Similarly, on PET-CT, both conditions demonstrate increased FDG uptake, which adds to the diagnostic challenge [24]. But there are significant differences between the two in terms of their biological behaviors and therapeutic strategies. CTBL is a chronic, infectious disease, which is mainly treated with anti-tuberculosis drugs, but in the case of abscesses or sinus tracts forming surgical intervention may be required; whereas CMLN is caused by the metastasis of cancer cells from the primary malignant tumor to peripheral or distant lymph nodes through the lymphatic system. The presence of CMLN is an important indicator of clinical treatment options and prognostic assessment of cancer patients [25]. The diagnosis of CMLN helps determine the surgical strategy in patients with resectable cancers. The diagnosis of CMLN in patients with radically resectable cancers affects the choice of chemotherapy and local radiotherapy. In addition, postoperative monitoring of lymph node metastasis relies on an accurate diagnosis of CMLN.
Traditional detection methods for LNTB include acid-fast bacillus smear and mycobacterium culture, etc., but the positive detection rate of both is low and the culture time is longer [26]. Currently applied molecular biology technologies Gene Xpert MTB/RIF and Second-generation sequencing have the advantages of high efficiency and speed for diagnosing LNTB. However, the above operation requirements are high, the cost is high, the regional popularity is poor, and the lymph node sample collection is usually invasive operation, etc., which limits its use [27, 28].
Therefore, this study observed lymph node perfusion and microvascular conditions through CEUS, providing a new basis for the differential diagnosis of LNTB and CMLN. In this study, compared with CTBL, CMLN had larger short diameters and smaller L/S, and the morphology tended to be rounder or similarly rounded. Liquefaction necrosis was present in 55.5% of CTBL, which was higher than that in 32.1% of CMLN. In terms of blood flow distribution, peripheral (51.4%) and avascular (21.2%) types were predominant in CTBL, whereas peripheral (40.8%) and mixed (32.1%) types were more common in CMLN. With the progression of CTBL, advanced abscess formation can lead to US signs of large sheets of liquefied necrosis and lack of blood supply on CDFI. On the other hand, in CMLN, with large amount of neovascularization and heterogeneous distribution, liquefaction necrosis is less common and the area of necrosis is smaller, and a mixed type is more common in CDFI [11, 30]. The US manifestations of CTBL and CMLN at different disease stages may overlap, making it difficult to accurately differentiate them by US.
In the CEUS qualitative analysis results of this study, there were significant differences between CTBL and CMLN in terms of enhanced homogeneity, perfusion defect, and rim enhancement (P < 0.05). The percentage of CTBL that showed inhomogeneous enhancement was 82.9%, which was higher than that of CMLN, which was 67.9%; and the percentages of perfusion defects and rim enhancement were 83.6% and 47.3%, respectively, for CTBL cases, while the percentages for 54.3% and 18.5% in CMLN. Although these features are specific signs for the diagnosis of CMLN, CTBL is equally likely to exhibit them. In quantitative analysis, only StdDev was significantly different between CTBL and CMLN, with 52.7% of CTBL having StdDev ≥11.51, which was greater than the 18.5% in CMLN.
Inhomogeneous enhancement and perfusion defect are specific signs for the diagnosis of CMLN in previous studies [18, 31]. However, CTBL also showed the same CEUS manifestations, and in this study, CTBL showed a significantly higher percentage of inhomogeneous enhancement and perfusion defects than CMLN. The CTBL perfusion defect area pathologically mainly showed caseous necrosis, which resulted in no vessel entry during enhancement due to the absence of vascularity, whereas the peripheral part of CTBL showed granulation tissue proliferation due to inflammatory reaction, which contained a higher number of capillary components leading to peripheral enhancement is obvious, thus showing rim-like enhancement [32]; in CMLN, metastatic cancer cells from different sources invade the lymph nodes through the input lymphatic vessels until they infiltrate the whole lymph node, the internal structure of the lymph node is compressed and displaced, and even the whole lymph node is destroyed, and a large number of neovascularization tends to concentrate in the marginal zone where the tumor tissue grows more actively, and the central area tends to become necrotic due to insufficient blood supply [33]. The number of necrotic areas is often greater than the number of vessels in CTBL, and there is still a small blood supply in the perfusion defect area of CMLN, while CTBL is more likely to form large patches of liquefied necrotic perfusion defect areas, which in turn form the characteristic rim enhancement. CTBL has a higher StdDev value compared with CMLN, which can quantify the uniformity of the distribution of the contrast agent in the ROI when it reaches the peak. This is consistent with the CEUS characterization that CTBL is more susceptible to inhomogeneous enhancement and perfusion defects than CMLN, and that the area of perfusion defects is larger in CTBL.
The established prediction model has high diagnostic efficacy in identifying CTBL and CMLN, with AUC values of 0.844 and 0.927 for the training and validation sets, respectively. The calibration curves for the training and validation sets of this diagnostic model demonstrate that the model predicted values and the actual observed values fall near the diagonal reference line, and the p-values are 0.871 and 0.196, which indicates that the calibration of the diagnostic model is good, and further quantitative assessment of calibration, the model obtained brier scores of 0.145 and 0.106, which reflects the good calibration ability of this model both in the training and validation sets. The two cases were analyzed by the nomogram model In Fig. 2, and the total score of patient 1 was 355.5, which corresponded to a CTBL probability of about 90% or more, while the total score of Patient 2 was 99, which corresponded to a CTBL probability of about 35%. In this study, there was an improvement in the diagnostic efficacy of the validation set compared with the training set, which may be related to the insufficient number of cases included in the validation set.
In addition, this study further distinguished between CTBL and CMLN by the StdDev value in the CEUS quantitative analysis. The AUC value of the CEUS quantitative analysis model was 0.927, which was higher than that of the CEUS qualitative analysis model of 0.907, although there was no significant difference between the two. This quantitative analysis method can more accurately reflect the distribution of microblood flow within the lymph nodes. The contribution of StdDev in the CEUS quantitative analysis model was significant as assessed by DCA, NRI, and IDI. The DCA curves showed that the net benefit of the CEUS quantitative analysis model was higher than that of the qualitative analysis model within the thresholds of 0.25–0.50 and 0.70–1.00. The NRI and IDI were 14.0% and 2.6%, respectively, indicating that StdDev significantly improved the discriminatory ability of the model.
Despite the important progress made in the differential diagnosis of CTBL and CMLN in this study, some limitations remain. First, the small sample size of the study and the single-center data may be subject to case selection bias. Second, there may be differences in US and CEUS manifestations between different disease stages of CTBL and different sources of CMLN, and the sample size limits the possibility of more finely grouped studies. Future studies should expand the sample size to cover more cases with different disease stages and different sources to further validate and optimize the value of CEUS in the differential diagnosis of CTBL and CMLN.
Conclusion
CEUS quantitative analysis of StdDev combined with gender, age, and the presence of liquefaction necrosis and perfusion defects are important features for differentiating CTBL and CMLN, and the constructed visualization nomogram has good differential diagnostic efficacy for differentiating CTBL and CMLN, which is an accurate and efficient auxiliary diagnostic tool. StdDev enhances the differential diagnostic efficacy of both CTBL and CMLN lymph node lesions. StdDev improves the differential diagnosis of CTBL and CMLN, and is expected to be utilized in practical clinical work.
Funding
This research was funded by the Natural Science Foundation of Zhejiang Province (LTGY23H180005), the Major Project of Hangzhou Health Technology Plan (Z20230098), and the Hangzhou Biomedical and Health Industry Development Support Technology Special Project (2022WJC046).
Conflict of interest
The authors declare that there is no conflict of interest.
Ethical approval
The study was approved by the Medical Ethics Committee of Hangzhou Red Cross Hospital, Hangzhou, China. The approval number was 2022KY173. Written informed consent was obtained from individual participants.