
Abstract
The Assessment of Language in Adults using Self-reported Skills (ALASS) is an online tool aimed at providing a rapid indication of language-related skills at two levels: basic performance and social use. In Study 1, we have developed and validated a new tool with two objective measures: a lexical decision test and a grammaticality judgement test, completed online by 280 participants (204 women, 69 men, 7 undisclosed, age: M = 24.4 years; SD = 11.1). Results show that ALASS is a good predictor of the outcomes for reaction times in the objective measures. In study 2, we have run further analyses with a subset of 209 adults (157 women, 47 men, 5 undisclosed; age: M = 20.9 years; SD = 5.8) to validate the social implications of ALASS with another online study, also showing a considerable explanatory power in this case, and strengthening the divergent nature of language when it is used with a social purpose against a more cognitive function (i.e. literacy and language production and comprehension). Considering its explanatory power for lexical performance, we believe that the scale has a potential applicability in the assessment of adults that could have missed a diagnosis of Developmental Language Disorder during childhood.
The online assessment of language performance has become a necessity in recent years. The need for new online tools is patent in the current COVID-19 pandemic scenario, since face to face assessment is obviously compromised. But this requirement for valid online evaluation also stems from recent advances in the field of language development. Since Developmental Language Disorder (DLD), a relatively new diagnosis, has come to be a construct of agreement across different fields of expertise (Bishop et al., 2017), both the number of cases early diagnosed and the interest in this condition have soared (Norbury et al., 2017; Sansavini et al., 2021). The term DLD was established in 2016 as a result of the CATALISE project (Bishop, 2017), as the previous label, Specific Language Impairment (SLI) (Leonard, 2014) did not fully describe the emotional and social challenges faced by children with language difficulties (Bishop et al., 2017, Llorenç et al., 2021). Less is known about the effects of early language problems during adulthood, though there is a growing body of research that highlights its persistent and pervasive nature (e.g. Conti-Ramsden et al., 2016, 2018; Howlin et al., 2000; Johnson et al., 2010). As such, investigating the everyday psychosocial implications of language disorder beyond childhood is still a fundamental part of the research agenda.
As more cases are accounted for in the early stages of education, a question to consider now is what proportion of adolescents and adults might have specifically missed a language related diagnosis (DLD has only been available for a few years) or have been mis-diagnosed ADHD, Dyslexia, or Autistic Spectrum Disorder, due to issues with terminology and co-morbidity (Bishop & Hayiou-Thomas, 2008; McGregor, 2020; Prelock, Hutchins, & Gascoe, 2008). A further issue is that most diagnostic criteria are fundamentally binary in practice: An individual is either diagnosed or not. As such, challenges faced by people seem to fit somewhere on a continuum between receiving a language-related diagnosis during childhood and not receiving one. Further insights regarding the experiences of adults on this continuum are important to shed light on the nature, development, and real-life impact of different levels of language skill in adulthood, consequently informing support that may not otherwise be provided due to the lack of appropriate assessment. Therefore, beyond knowing whether a particular adult should have been diagnosed with DLD or any other language-related condition, the question is now how individual differences in language skill can be associated with other aspects of social life. With this objective in mind, the current study presents the results of a recently developed online scale aimed at providing additional measures of language skills, as they are subjectively perceived by young adults, and to validate these measures with the scores obtained from other language tasks (Borovsky et al., 2021).
The Lexical and Syntactic Nature of Receptive and Expressive Skills
Research exploring the longitudinal course of language difficulties beyond adolescence is limited, though studies have found that expressive and receptive impairments frequently persist into later childhood (e.g. Conti-Ramsden et al., 2001, 2018), adolescence (e.g. Stothard et al., 1998, Suggate et al., 2018) and early adulthood (Dubois et al., 2020, for a systematic review; see also Johnson et al, 2010; McGregor et al., 2017; Poll, Betz, & Miller, 2010). A substantial body of literature documents syntactic impairments at both receptive and expressive levels in children (Lonigan & Milburn, 2017; van der Lely, 2005), such as deficits in understanding the meaning conveyed by sequence-specific word-orders (Hsu & Bishop, 2014) or in truly distinguishing grammatical sentences from sentences that are ungrammatical (Hall, Van Horne, & Farmer, 2019; Rice, Wexler, & Redmond, 1999; Roa-Rojas et al., 2021). Word finding difficulties and limited vocabulary are also evident for some children (Bishop et al., 2017; McGregor et al., 2013). Often this presents as ‘general all-purpose verb’ use, whereby many actions are described using the same verb (Kambanaros et al., 2014). Also, at a lexical level, language difficulties have been associated with assigning the correct tense and agreement markers (Bedore & Leonard, 2000; Rice & Wexler, 1996). This body of evidence indicates that a good assessment of language skills should include both lexical and grammatical components.
The Impact of Language Difficulties on Social and Educational Achievements Over the Lifespan
The impact of language difficulties during early childhood on other cognitive and educational domains has also received recent attention (Cronin et al., 2020; Dippold et al., 2021). Not being able to access speech and language therapy on time could have lifelong negative effects, as shown by Trembath et al. (2021). Behavioural difficulties, characterised by inattention and hyperactivity (McKean et al., 2017; St Clair et al., 2019) are seen in some children with low levels of language skill. For instance, a correlational study has shown that considering language scores during early childhood can explain over 47% of the variance in academic outputs at year 11 (Eadie et al., 2021). Similarly, through a 20-year prospective longitudinal study, Johnson et al. (2010) found that children with poorer language scores had negative cognitive and educational outcomes as young adults, including challenges in gaining full time employment (Clegg et al., 2005; Whitehouse et al., 2009) and increased likelihood of low skilled jobs (Clegg et al., 2005; Conti-Ramsden et al., 2018). These findings illustrate the barriers faced by young adults with low language skills for progressing into further education or work life. However, Conti-Ramsden et al (2018) highlights a somewhat improved picture finding that 10% of young adults with DLD obtained undergraduate degrees.
Thomas et al. (2019) interviewed Speech and Language Therapists (SLTs) to gain an understanding of the impact of poor language scores on children’s lives from the practitioner perspective. One main theme that emerged was the concern held by SLTs over future support for children with early language difficulties. All SLTs expressed worries about the potential detrimental effects in later life, in relation to academic, employment and relationship outcomes. These findings highlight that this is a current issue, critical in the eyes of the practitioner and important in the wider context of raising awareness and providing support across life stages, to improve outcomes in adulthood.
Aims and Research Questions
The issues and gaps identified in existing literature supported the development of two main aims for this study. First, to develop an online tool that identifies a typology of language difficulties without a formal diagnosis. And second, to provide insights related to adult language ability and social functioning in everyday life, that can inform future research for adults reporting low levels of language performance during adulthood, or a history of lower performance during childhood. To achieve these aims, two different studies have been run. In Study 1, the following research questions are posed: Are adult self-reported measures of language skills during childhood valid and reliable predictors of current scores in language competence? Are adult self-reported measures of language skills during adolescence and adulthood valid and reliable predictors of current scores in language competence? If the answers to the previous questions are affirmative, what are the main factors underlying language skills? How do these main factors correlate with objective measures of language competence?
Study 1
An initial set of results includes an exploration of the main components of the ALASS tool, as well as a validation with two objective measures: a lexical test and a grammatical test.
Method
Design
An online set of quantitative measures was partly developed by the researchers, comprising of three sections: a language test; a questionnaire assessing self-reported language skills (ALASS); and demographic data including level of income and academic achievement. Data was collected over three different time periods, from March –May 2019 (Time 1), January –March 2020 (Time 2) and January –March 2021 (Time 3), using Psytoolkit.org (Stoet, 2010a, 2010b), a tool allowing the collection of response times.
Participants
Participants were 280 adult English monolinguals (204 women, 69 men, 7 did not disclose gender) aged 18–73 years (M = 24.4 years; SD = 11.1). Most participants were students coursing BSc Psychology at a university in England (n = 192, 68.6% of the total). They did not receive an economic compensation for their participation.
Demographic Data
Since most of our participants were university students coursing a Psychology degree, the economic income reported by them was low, being “Less than £10,000 per year” the most common case (66.2% of the total), followed by “Between £10,000 and 20,000 per year” the second most common choice (8.2% of the total). We also asked them about the number of subjects achieved at grade C or above for their General Certificate of Secondary Education (GCSE) (equivalent to grades 4 to 9 in the current education system). There was a much higher variability across participants. We asked participants about the number of A-levels and scores achieved before starting their higher education. With this information, we produced a numerical estimation based on a simplified version of the scale adopted by the UCAS system (ucas.com, 2021), assigning the following values to grades (A/A* = 50, B = 40, C = 32, D = 24, E = 16) and averaging across all of them. Table 2 shows a breakdown of the scores for four percentile points. We then converted both factors (GCSE and A-levels) into z-scores and averaged them into a final factor that we have called Education Achievement, producing a grade from 1 (equivalent to E) to 5 (equivalent to A) for each participant.
Summary of Academic Achievement
Summary of Academic Achievement
Note: Breakup of scores for academic achievement.
The Language test had two components; a lexical one based on an adaptation of The Lexical Test for Advanced Learners of English (LexTALE) (Lemhöfer & Broersma, 2012) and a syntactic component developed by the researchers.
LexTALE is conceived as a measure of vocabulary and general proficiency for speakers of English as a second language. In its original version, participants are presented with a word (or non-word) and asked to decide whether it is a real English word by pressing a specified key on the keyboard. The original 63 items from LexTALE were embedded into a similar online tool. Since we recruited native speakers of English, and we expected that most of them would achieve very high scores, two small changes were introduced: words were presented randomly and we collected reaction times. The test was scored by marking each response as correct or incorrect, then calculating the proportion of correct scores. Reaction times were only computed for correct words, replacing all values 1.5 standard deviations above the mean (12 cases) by the 90th percentile (1231 ms).
The second task was developed for the purpose of this study to assess grammaticality judgment in sentence construction. This is a well-established technique used to assess grammatical knowledge for both first and second language learners (e.g., Blackwell, 1996; Ellis, 1993). Participants were presented with a series of sentences containing a non-word and asked to decide whether it made sense in English, by pressing a specified key on the keyboard. For example, in Athur grimps potatos, the participant is required to test the grammaticality of verbs in the sentence; although the verb is unknown, ‘grimps’ is correct as the ‘-s’ suffix agrees with a third person subject (‘Arthur’).
This test was made up of 21 items and was scored in the same way as the LexTALE test above, and reaction times were only considered for correct decisions, replacing scores 1.5 standard deviations above the mean (23 cases) by the 90th percentile (3223 ms).
Since, to our knowledge, the present study constitutes the first empirical attempt to develop an assessment tool for language competence based on self-reported skills using quantitative data, an initial pool of 49 items was elaborated on the basis of a set of skills reported to be relevant in higher education and workplace settings (Kemp & Seagraves, 1995, Schultz et al., 2021). This initial set of items tried to incorporate measures of perceived language ability, specifically in relation to academic and professional skills across the lifespan, but also capturing the validity of language assessment with interpretative arguments (Chapelle, 2012). With this purpose in mind, all 49 items were organised across three points in time: childhood, adolescence, and adulthood. During an initial stage of the study, 69 participants completed this preliminary version of the scale. The present study includes a simplified version with 31 items.
Participants were asked to rate skills from 1 to 10 (1=‘I am not very good’;10=‘I am very good’) within three blocks of items: childhood, adolescence, and adulthood. The whole list of sentences included in the scale is reproduced in Table 1. The instructions included for the first block of items was:
Items Used in the ALASS Scale
Items Used in the ALASS Scale
Note: The ALASS scale includes 31 items, organised across three different categories: childhood, adolescence, and adulthood.
“Do you recall having one of these difficulties as a child
The questionnaire was scored by collating ratings and computing an average perception score for each participant at each age point (< 6 years old; 6 < 18 years old; adulthood). Information regarding family history of language disorders, level of education, occupation, degree, and A-level subjects was also obtained. An additional narrative response question was included, allowing participants to describe the impact of any language difficulties mentioned.
A detailed information sheet was provided online prior to the commencement of the online questionnaire that explained: research aims; what the study involved; potential benefits and right to withdraw; ethical approval; complaints procedures if required; researcher’s contact information; consent and confidentiality measures. Participants were also told how to access research findings to ensure transparency. All participants were asked to provide consent by ticking a box on the online screen after reading the information sheet. The study received approval by the corresponding University Research Ethics Committee.
Results
Preliminary Analysis of the ALASS Scale
The ALASS scale has an excellent reliability (alpha = 0.97). All 31 items of the ALASS scale were entered into an exploratory factor analysis (EFA) in order to “arrive at a parsimonious representation of the associations among measured variables” (Fabrigar et al., 1999, p. 275), using principal axis as extraction method with oblique (‘oblimin’) rotation. Based on parallel analysis (Schmitt, 2011), four factors (accounting for 73.4% of the variance), would have a better fit than three factors (accounting for 68.4% of the whole variance). But three factors have a very high overall sampling adequacy at 0.94, and all thirty-one Kaiser-Meyer-Olkin values are above the 0.9 value; Bartlett’s test is also significant: χ2 = 10089.35, df = 465, p < 0.001, see also the corresponding scree plot in Fig. 1 , where the explanatory power of three and four factors is visually compared. A summary of the EFA is included in Table 3, indicating that all three main factors adopted a clear pattern across items. Component 1, from now on named Language Performance (LP), correlates highly with items associated with performance (e.g. “Producing sentences”, r = 0.72; or “Understanding verbal instructions”, r = 0.86), and literacy skills (e.g. “Writing a long piece of text”, r = 0.85). Component 2 shows that participants had a unique pattern of responses when they were asked about their skills during childhood (from now on named Childhood Skills, CS). Component 3 represents the Social Use of Language (SUL), correlating highly with items like “Talking on the phone” (r = 0.82). An illustration of the uniqueness of these components can be shown in the difference between “Talking on the phone with someone you know well”, which correlates better with LP (r = 0.58), and “Talking on the phone with a stranger”, which correlates better with SUL (r = 0.80). As mentioned above, an EFA with four factors instead of three would only increase the cumulative variance explained by the model in three percentual units (up to a total value of 73.4%). This fourth factor would correlate highly with “Spelling” in childhood (r = 0.48), adolescence (r = 0.49), and adulthood (r = 0.40) so it will not have sufficient explanatory power, and hence, it is not considered here (as supported by recent interpretations of the parallel analysis approach, where viable candidates and interpretational validity are sufficient for adding or removing one of the factors, Lim & Jahng, 2019).
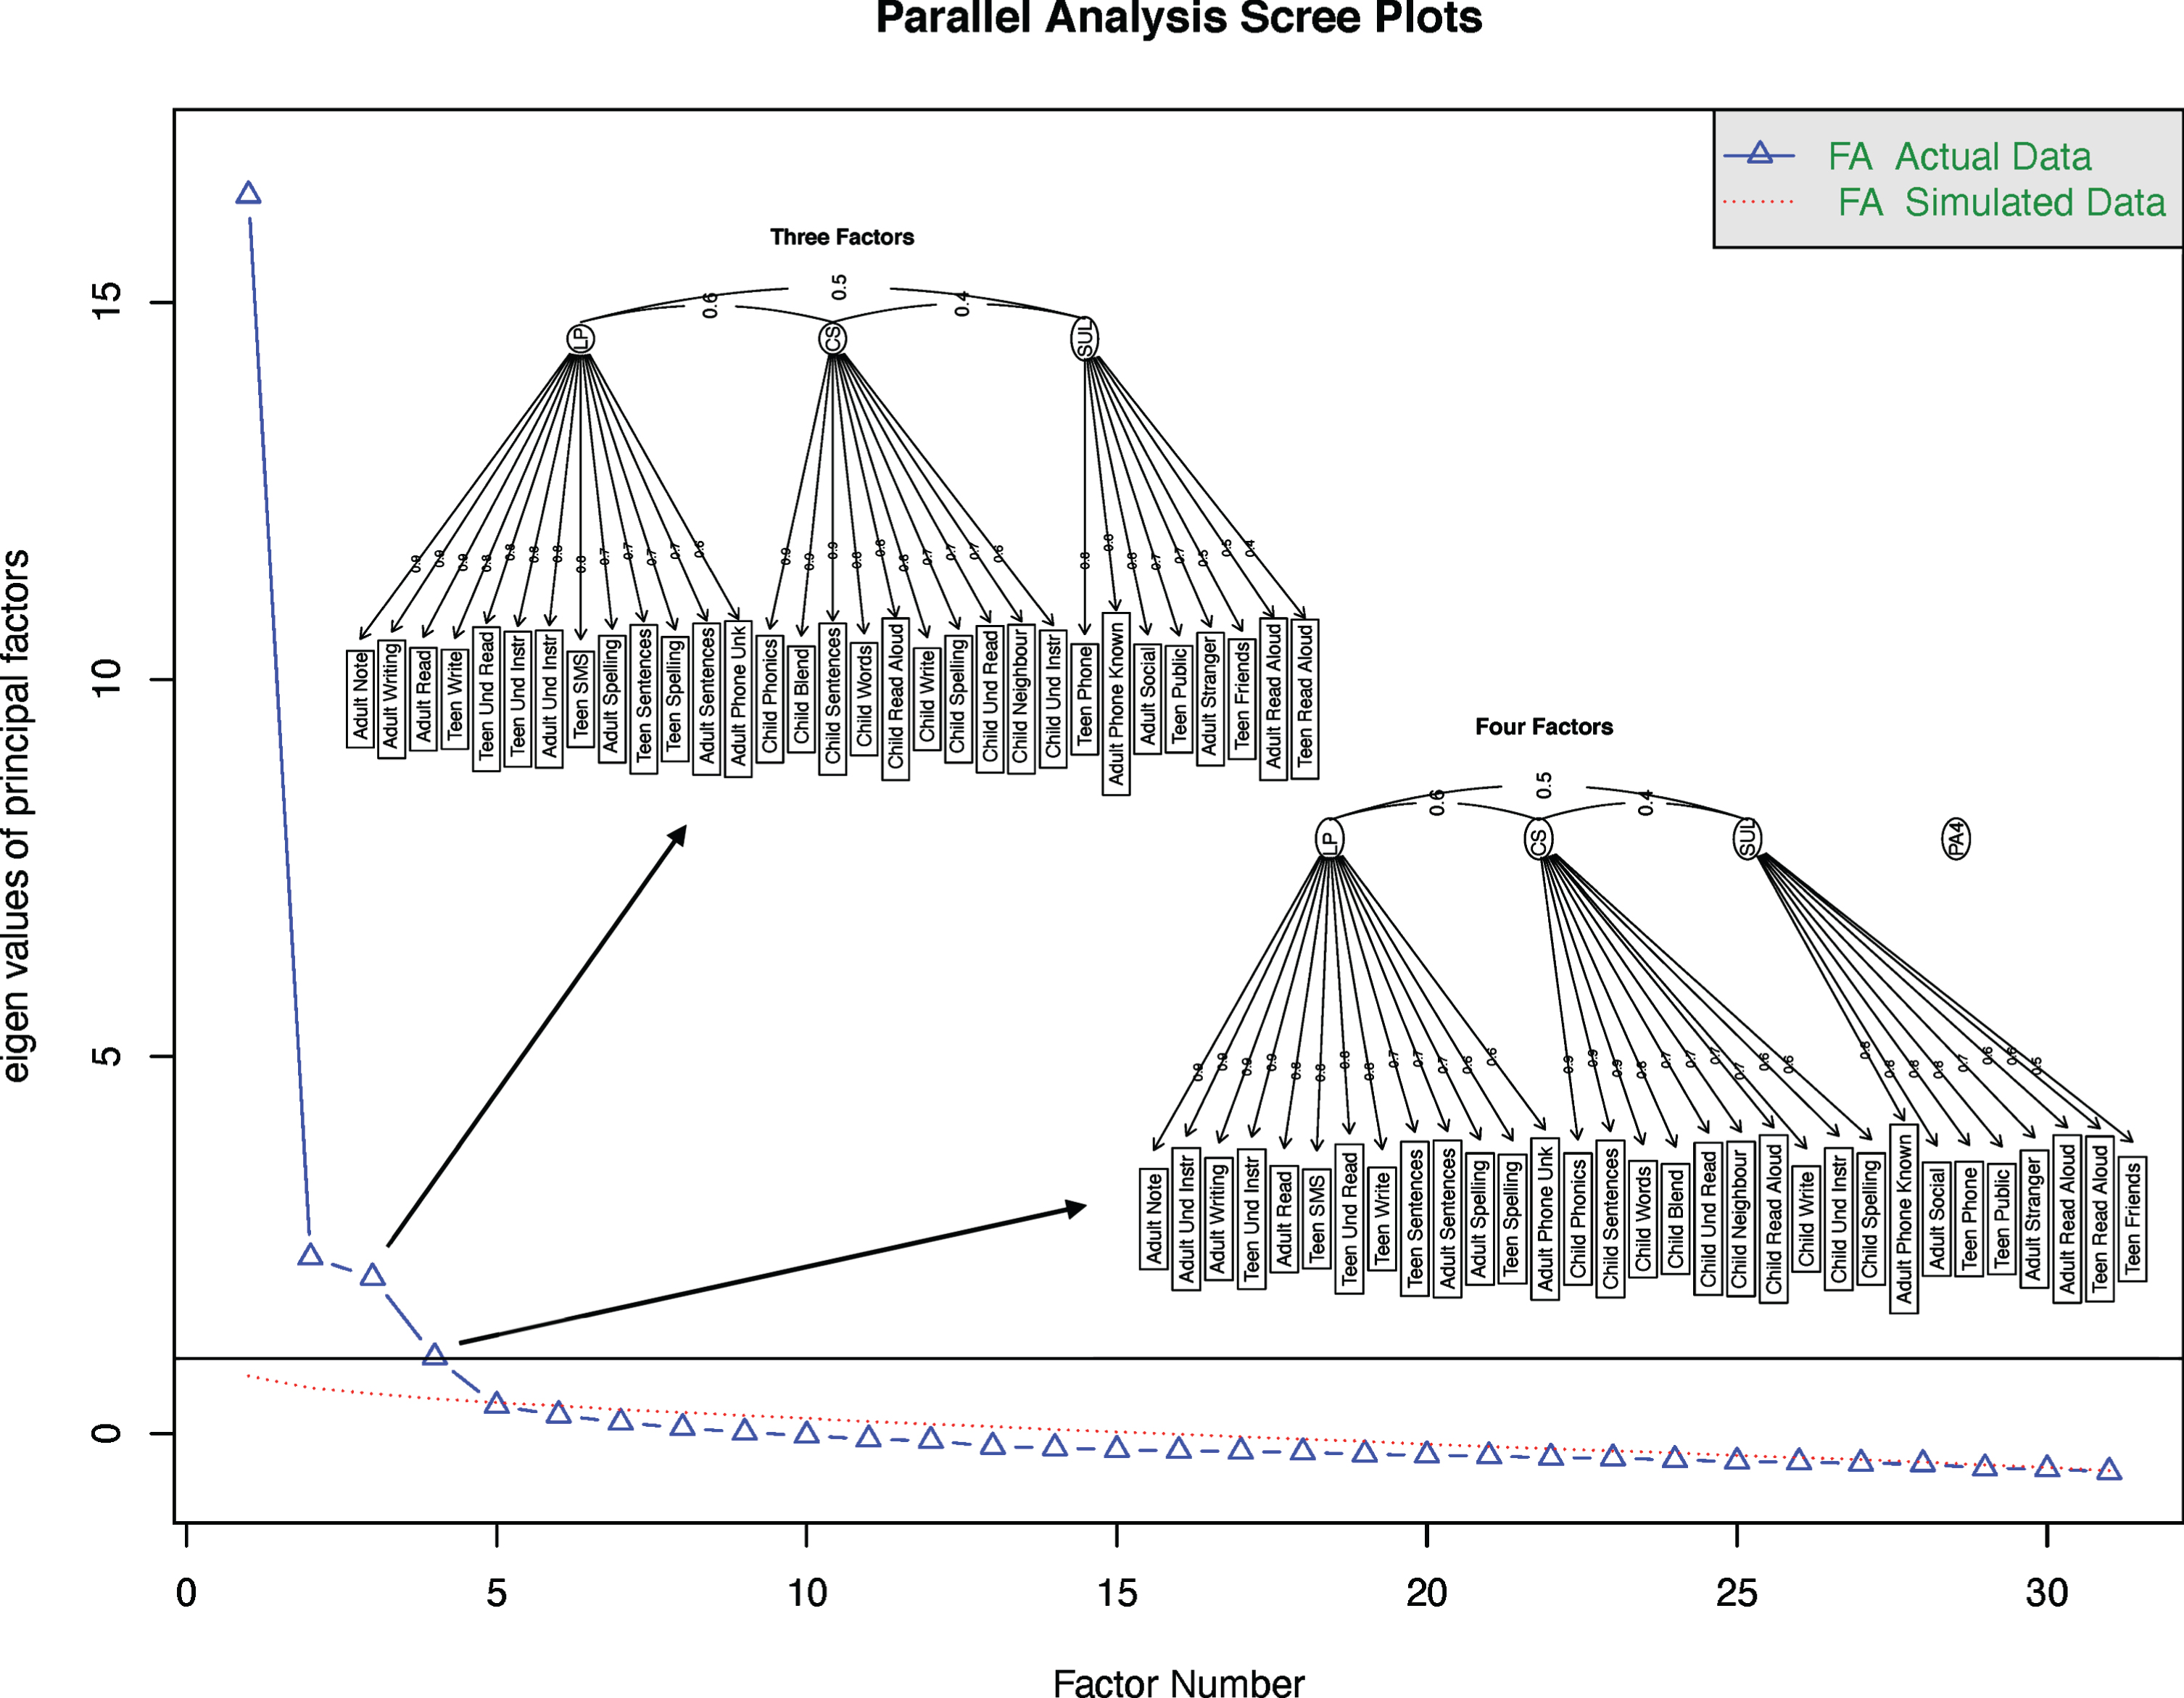
Scree Plot for the EFA using Parallel Analysis. The results of selecting either three factors has been superimposed in the picture, indicating how a four-factors analysis would have not have enough explanatory power.
Summary of the Exploratory Factor Analysis for ALASS
Notes. (1) Language Performance, (2) Childhood Skills, (3) Social Use of Language. The table is only showing correlation values equal or above 0.4. Root Mean Square of Residuals (RMSR) = 0.05, Fit based upon off diagonal values = 0.99.
Following these results from the EFA, scores from the 31 items were averaged per participant into the three new factors (LP, CS, and SUL). The next analyses are aimed at assessing the validity of these measures comparing them, first, with the objective scores collected across participants, and second, against the social intelligence scale.
We collected four main measures of language performance: proportion of correct words in our adaptation of the LexTALE test, reaction time for correct words, proportion of correct sentences in a grammaticality judgment test (GJT), and reaction time for correct sentences in the GJT. The average number of correct words was high (M = 0.91, SD = 0.07), as well as the proportion of correct sentences (M = 0.82, SD = 0.09) indicating that the task was relatively easy for participants as we expected, and that they completed it successfully. The correlation between both scores is small (r = 0.12, p = 0.2). To estimate the explanatory value of the three ALASS factors over the proportion of correct words and sentences, two initial linear regression models were fitted. The first one was estimated using ordinary least squares (OLS), to predict the proportion of correct words achieved by participants with Childhood skills, Language Performance and Social Use of Language (Correct Words ∼ CS + LP + SUL). The model explains a statistically significant proportion of variance, that is in fact rather weak (R2 = 0.04, F(3, 198) = 3.06, p = 0.029, adj. R2 = 0.03). The model’s intercept (corresponding to all CS, LP and SUL equal to 0) is at 0.85 (95% CI [0.80, 0.88], t(198) = 37.04, p < 0.001). All three coefficients of the linear regression are positive but none of them significant (BetaCS = 7.46e-04, 95% CI [–5.59e-03, 7.08e-03], t(198) = 0.23, p = 0.82; BetaLP = 5.31e-03, 95% CI [–2.92e-03, 0.01], t(198) = 1.27, p = 0.205; BetaSUL = 2.31e-03, 95% CI [–4.78e-03, 9.39e-03], t(198) = 0.64, p = 0.521). In summary, although the ALASS scale can capture the variability observed in the proportion of correct words, none of its three factors are strong in the model. A second model was also estimated to predict the proportion of correct sentences with all three ALASS factors (Correct Sentences ∼ CS + LP + SUL). The proportion of variance explained is very weak too and in this case non-significant (R2 = 4.82e-03, F(3, 276) = 0.45, p = 0.721, adj. R2 = –6.00e-03). This result is not unexpected, because these language tasks were too easy for native speakers of English, and we were mainly interested in reaction times when participants made the correct choice.
Regarding reaction times, participants required on average almost a second to decide if the presented word was correct or not (M = 996 ms, SD = 163) and over two seconds to make a decision for sentences (M = 2326 ms, SD = 582). Both measures share a large similarity across participants (r = 0.49, p < 0.001). Because of this, z-scores were computed for each of the two measures of reaction times (i.e. for correct words and for correct sentences), and then averaged into a second dependant variable called Reaction Time (M = 0.04, Median = –0.03, SD = 0.87).
A more realistic estimation of the explanatory power of the ALASS scale is how quickly participants reacted during the language tests. A second linear regression was fitted using OLS to predict Reaction Time with all three ALASS factors (Reaction Time ∼ CS + LP + SUL). Although this model explains a weak proportion of variance, it is significant (R2 = 0.04, F(3, 198) = 2.80, p = 0.041, adj. R2 = 0.03). The model’s intercept (recall that we are using z-scores) is at 0.34 (95% CI [–0.20, 0.89], t(198) = 1.24, p = 0.216). Figure 2 provides a visual summary of the model, plotting the regression lines for all three predictors. CS is not a good predictor of the changes in reaction time (BetaCS = –0.02, 95% CI [–0.09, 0.06], t(198) = –0.42, p = 0.673). In turn, the effect of Language Performance (LP) is statistically significant and negative (BetaLP = –0.12, 95% CI [–0.22, –0.02], t(198) = –2.33, p < 0.05), indicating that high scores in LP predict smaller reaction times, as expected. Finally, the effect of Social Use of Language (SUL) is also significant, but in this case it is positive (BetaSUL = 0.11, 95% CI [0.02, 0.20], t(198) = 2.52, p < 0.05). We think that this positive relationship (participants scoring high for SUL provided slower responses) is particularly interesting because it indicates that ALASS can clearly differentiate across authentic elements of language, and the relationships found cannot be simplified in terms of participants tiredness or mood during the test.
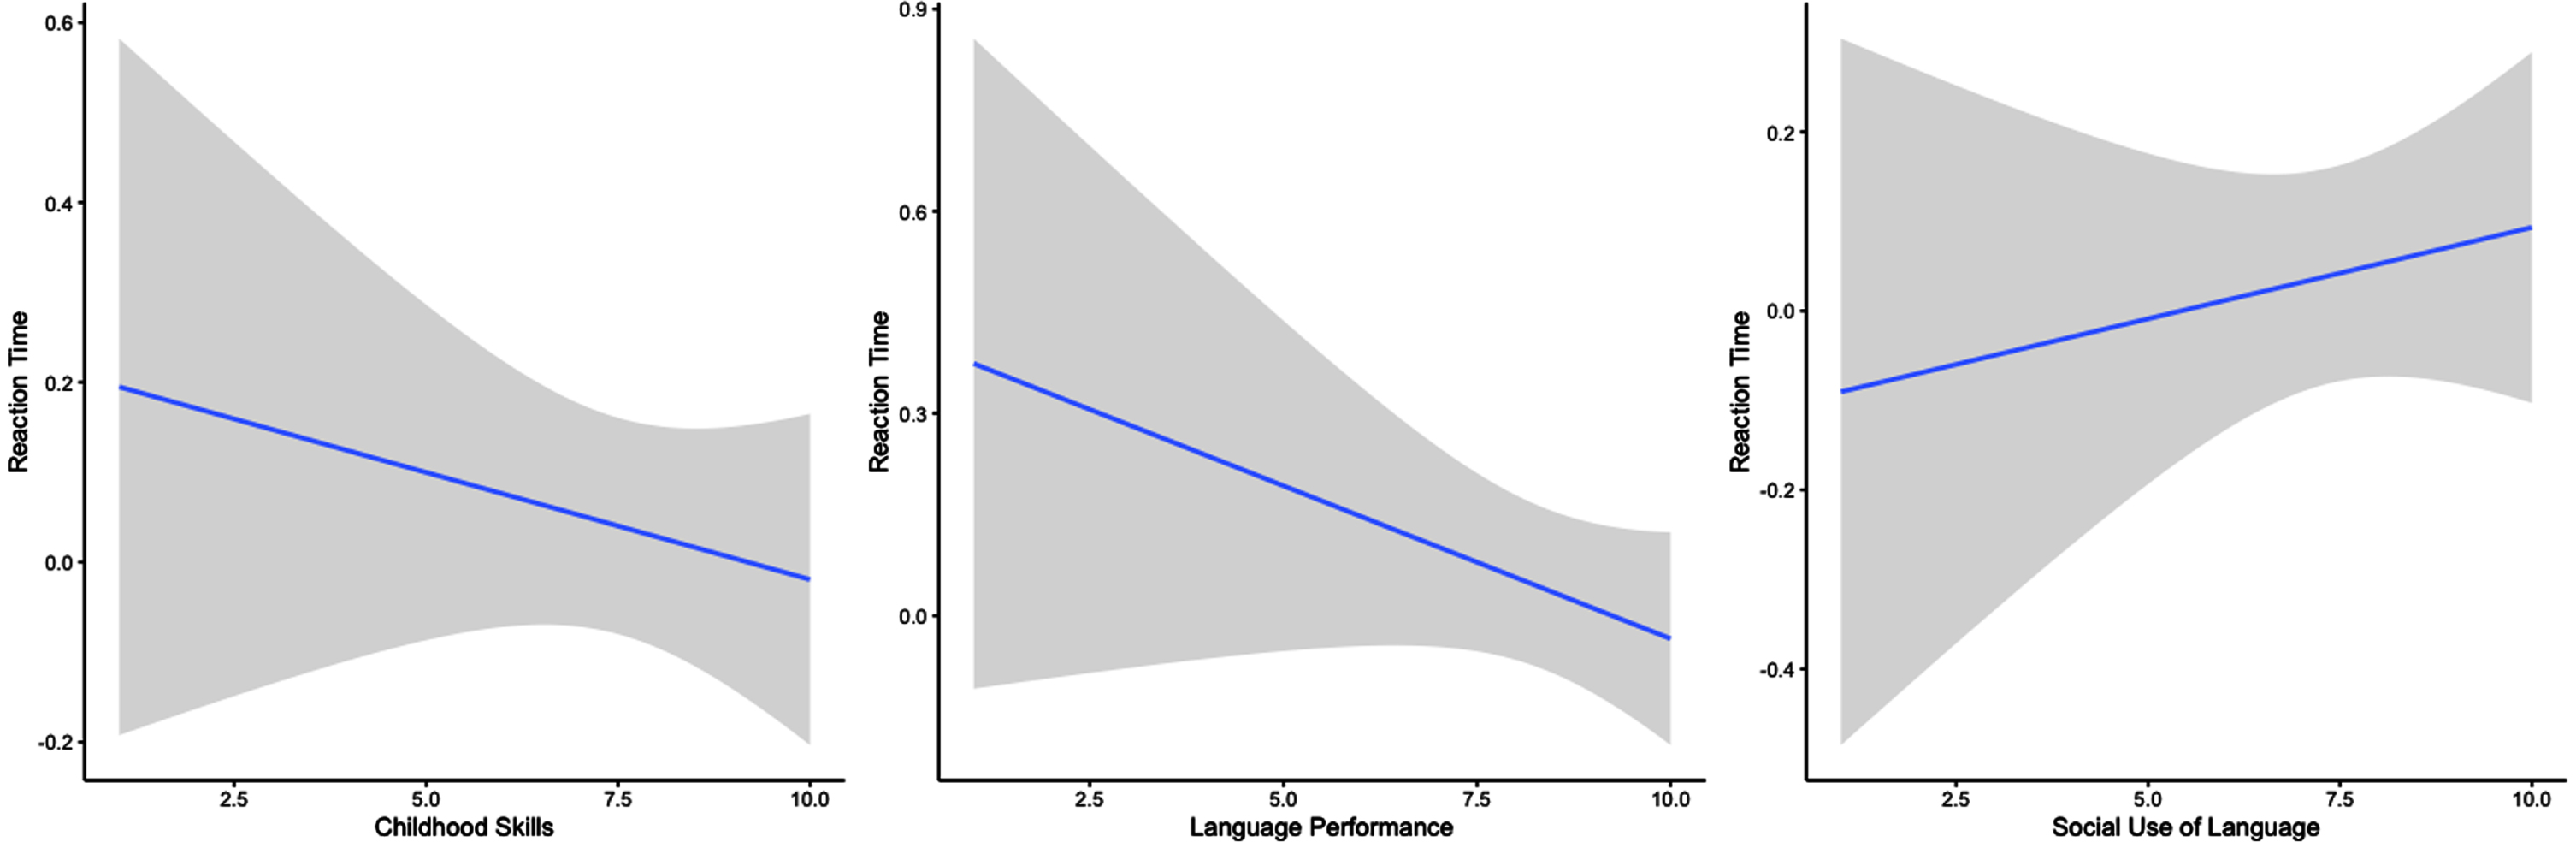
Summary of the effects of all three ALASS factors over the reaction times in the language test (Childhood Skills did not show a significant effect, but both Language Performance and Social Use of Language are significant).
Exploratory factor analysis has shown that participants seem to organise ALASS scores around three main factors. First, they produce a dense set of responses when they are asked to reflect upon their language-related ability before adolescence, named here as Childhood Skills (CS). The informative significance of this factor is limited because this study has not been able to establish numerical relations between CS and other objective measures. Consequently, our first research question remains unanswered with the current empirical evidence, because it is not possible to determine the extent to what low scores in self-perceived CS correlate with low scores in the language test at adulthood. The second factor of the ALASS scale corresponds to a relatively broad set of basic skills, that we have labelled Language Performance (LP). It includes both items in direct relation with literacy (e.g., “writing a long piece of text”) and with basic processing skills (e.g., “understanding instructions”). Although we were expecting a unique factor for both types of functions, the results of the EFA are sufficiently clear to believe that this factor can explain a large proportion of the observed variance in ALASS. Interestingly, LP can predict faster correct responses in the language test, indicating that those participants with a positive self-perception of language skills, do actually provide faster correct responses. A third factor of the ALASS scale is what we have called here Social Use of Language (SUL), resulting from the convergence of items like “Talking on the telephone with someone you don’t know well”, “Speaking in public”, or “Speaking in social events” (see Table 3 for a complete list of items). This factor can predict longer reaction times in the language test. At first sight, this could seem a counterintuitive effect, but it is important to remember that we are not considering here how accurately participants responded, but only the time required to provide the correct answer. In effect, this apparently contradictory result (high scores in the self-report scale associated with poorer scores in the objective test) also highlights the genuine cognitive nature of the three factors (CS, LP and SUL) further increasing the validity of the scale. In essence, it is indicating that participants who felt more confident with their social use of language, required more time in this computer-based task, with the opposite also proving to be true.
Study 2
The effects observed for SUL indicate that language is a primary tool for interacting with others. Language difficulties are associated with greater difficulties in developing and maintaining friendships for DLD children and adolescents (Conti-Ramsden et al., 2013; Durkin et al., 2017; Eadie et al., 2018; Forrest et al., 2018, Mok et al., 2014). Language is also a key skill in the development of emotion regulation (Bendezú et al., 2018), so it is not surprising that individuals with deficient language show vulnerability with regards to developing emotional and behavioural problems (Kladouchou, 2021; Yew & O’Kearney, 2013).
However, research is still limited when examining the links between adult language skills and social intelligence (see Janik Blaskova & Gibson, 2021, for a recent review). Voci et al. (2006) found that the incidence of social phobia, defined by fear of interacting with others, speaking to small or large groups, and being observed, was more than twice as high in young adults with language impairment than in peers who did not have difficulties with language. The language impairment group had one of the highest reported rates of social phobia in epidemiological literature. Similar findings are reported in Kladouchou (2021), where only the DLD children receiving support reached wellbeing levels equivalent to typically developing children.
Durkin et al. (2017) suggest that Social Self Efficacy (Smith & Betz, 2000) has the potential to be a revealing measure of perceived confidence in managing the everyday social demands of adult life. In their study, they found a direct association between language ability in adolescence and self-esteem in adulthood, with the language impairment group scoring lower in measures of self-esteem and self-efficacy and higher in shyness than the control group of age matched peers. Durkin et al.’s conclusion is striking; young people with history of language impairments are entering adult life less socially confident than their peers with typical language development. Typically, intervention and support are focused on children and adolescents and less attention is given to the broader impact of language difficulties across the lifespan.
An influential study by Roever and McNamara (2006) highlights the importance of considering the social dimensions of language assessment, an idea defended historically by proponents of psychometric measures, like Cronbach and Meehl (1955), or Messick (1989), for instance. However, Roever and McNamara specifically defend that grasping the social dimensions of language through assessments constitutes a central challenge, where a great deal of further work is needed, to reliably measure social aspects of language in a holistic way.
Study 1 (see above) has validated the explanatory power of ALASS at both language processing and social use levels. It has been shown to be a good predictor of performance-based scores in two different directions: high scores in LP correlate with low reactions times, whereas low scores in SUL correlate with high reaction times. In order to provide a deeper understanding of the social implications of ALASS, one further element was added to the questionnaire in the 2020 and 2021 data collection periods, the Tromsø Social Intelligence Scale (Silvera, Martinusen, & Dahl, 2001). This scale measures three components with 21 items: social information processing, social skills, and social awareness. It was selected because it is particularly transparent for language, as the items shown in 2 a) and b) illustrate: Other people become angry with me without me being able to explain why I can often understand what others are trying to accomplish without the need for them to say anything.
This second study aims to respond to two further questions: Are the main factors of ALASS a good predictor of scores in social intelligence? Do the main factors of ALASS correlate highly with academic achievement?
Method
Design
As in Study 1, the scores in the three ALASS factors (CP, LP and SUL) are entered as predicting variables, and the scores in the main components of the Tromsø scale (social information processing, social skills, and social awareness) are considered criteria.
Participants
This sample is a subset of Study 1, since social information was not collected in all cases. Participants were 209 English monolingual adults (157 women, 47 men, 5 did not disclose gender) aged 18–47 years (M = 20.9 years; SD = 5.8). Most participants were students coursing BSc Psychology at a university in England (n = 191, 91.0% of the total). They did not receive an economic compensation for their participation.
Materials and Procedure
The materials and procedure were substantially identical to the ones reported in Study 1. A version of the Tromsø scale was embedded into the same online survey. Participants were presented with the items corresponding to this scale immediately after the lexical and grammatical tests, and before completing the ALASS items. More details on the Tromsø Social Intelligence Scale can be found in Silvera et al., (2001).
Results
The descriptive values observed for all three main components of the scale are summarised in Table 4.
Descriptive Values for the Tromsø Scale
Descriptive Values for the Tromsø Scale
The table of correlations between the three Tromsø components and the two main dependent variables considered in the previous section, Language Accuracy and Reaction Times, (see Table 5) shows that no strong relationships can be found between the measures, indicating that, in principle, social intelligence is not related to language. This is actually an expected result, since this scale is not intended to measure language skills.
Pearson Correlation Values Between all Three Tromsø Components and the Language Scores
In line with the results presented in the previous section, since we want to establish the predictive value of ALASS for social intelligence, three additional models were fitted for each dependent variable. All three ALASS factors were entered as predicting variables and each one of the three Tromsø components as a dependent variable. A first linear regression model was fitted to estimate the predictive power of ALASS for Tromsø’s Social Information Processing (Social Information Processing ∼ CS + LP + SUL). Results are not statistically significant and explain very little variance (R2 = 5.29e-03, F(3, 205) = 0.36, p = 0.780, adj. R2 = –9.27e-03). The model’s intercept is at 37.02 (95% CI [33.42, 40.62], t(205) = 20.30, p < 0.001) (recall that the range for this component is 7–49). The pattern of results is clearly different for the linear regression fitted for the prediction of Social Skills, the second component of the Tromsø scale (Social Skills ∼ CS + LP + SUL). It now accounts for a statistically significant and moderate proportion of variance (R2 = 0.17, F(3, 205) = 14.34, p < 0.001, adj. R2 = 0.16). The model’s intercept is at 26.60 points in the Tromsø scale (95% CI [21.78, 31.42], t(205) = 10.88, p < 0.001). The effect of Childhood Skills is not significant (BetaCS = 0.34, 95% CI [–0.37, 1.06], t(205) = 0.95, p = 0.342). The effect of Language Processing is statistically significant and negative (BetaLP = –1.38, 95% CI [–2.22, –0.54], t(205) = -3.24, p < 0.01; Std. beta = –0.32, 95% CI [–0.51, –0.12]), indicating that those participants reporting a higher degree of confidence on their language performance (e.g. items like “Understanding verbal instructions” or “Writing a text message (SMS)”, scored lower in Social Skills (e.g. items like “I am good at entering new situations and meeting people for the first time”). Social Use of Language (SUL) (i.e. items like “Talking on the telephone with someone you don’t know well”) is also statistically significant and positive (BetaSUL = 1.93, 95% CI [1.30, 2.56], t(205) = 6.04, p < 0.001; Std. beta = 0.51, 95% CI [0.34, 0.67]). Given the significance of this model, the results are plotted in Fig. 3 .
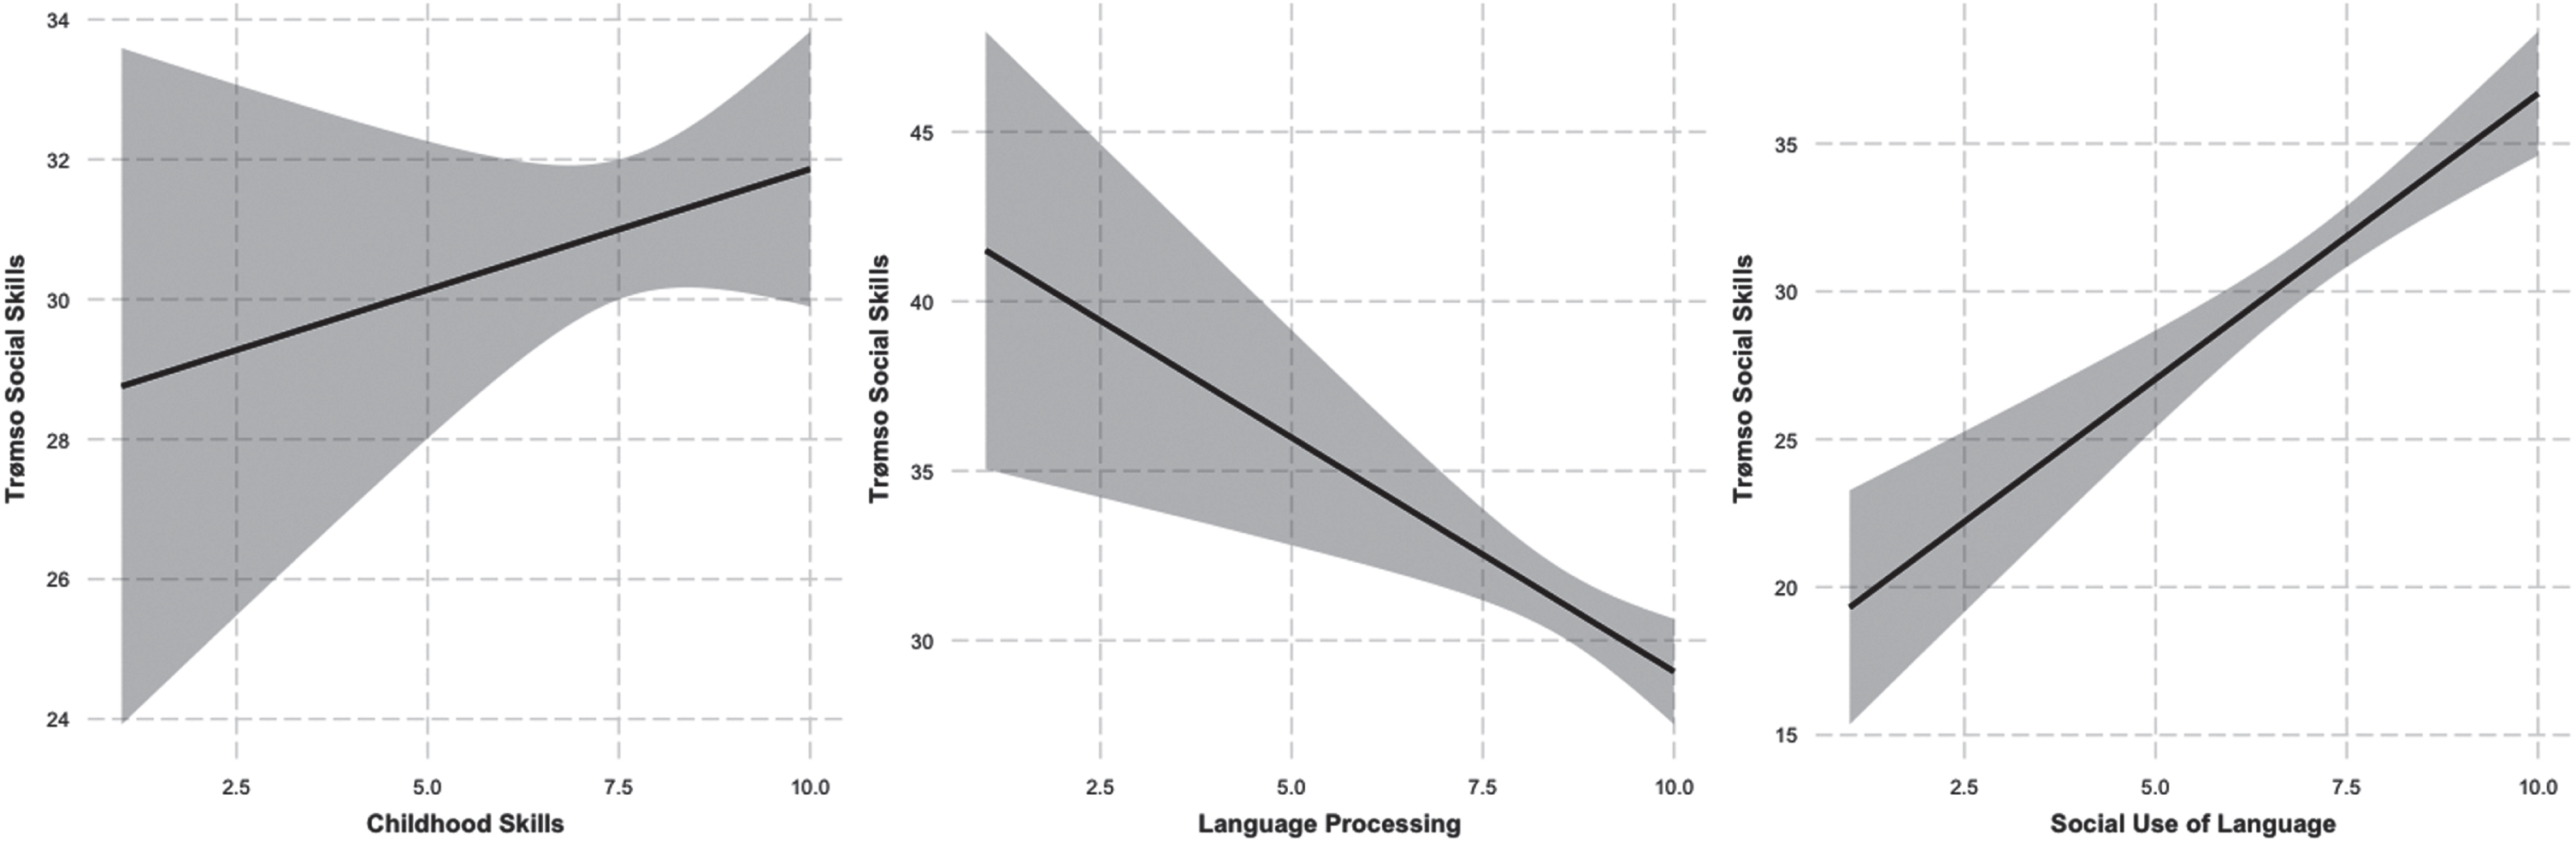
Summary of the effects of all three ALASS factors over Tromsø’s social skills component (Childhood Skills did not show a significant effect, but both Language Performance and Social Use of Language are significant).
A third final regression model was fitted to evaluate the predicting power of ALASS for Social Awareness (formula: Social Awareness ∼ CS + LP + SUL). It is not significant, with a very weak proportion of variance (R2 = 0.01, F(3, 205) = 0.89, p = 0.447, adj. R2 = –1.57e-03). The model’s intercept is at 31.41 (95% CI [26.80, 36.01], t(205) = 13.46, p < 0.001).
We fitted a final linear model (estimated using OLS) to predict the scores of Academic Achievement with all three ALASS factors (Academic Achievement ∼ CS + LP + SUL). The model does not explain a statistically significant proportion of variance (R2 < 0.001, F(3, 245) = 0.25, p = 0.862, adj. R2 < 0.001). The model’s intercept is at 3.15 (95% CI [2.28, 4.02], t(245) = 7.10, p < 0.001). Therefore, we cannot conclude that scores in the ALASS scale are a good predictor of our measure of academic achievement.
Discussion for Study 2
In summary, the ALASS scale has shown a strong predictive power over only one of the three components of the Tromsø scale, the component related to social skills. This result mimics the findings reported for study 1: Scoring high in SUL, but also low in LP, would result in higher scores in items where participants indicated that they feel confident in situations requiring social skills. This bidirectional effect of SUL and LP is discussed in further detail in the next section. It is, however, not possible to estimate the level of academic achievement with ALASS.
General Discussion
Easier methods to identify language difficulties should have a helpful effect not only at academic and professional levels, but also for the general wellbeing of children, adolescents and adults. As DLD and other childhood conditions seem to have life-span effects (e.g., Botting, 2020), complementary types of assessment can provide additional information about the nature and extent of language difficulties (Langbecker et al., 2020). With this purpose in mind, a new scale based on online self-reports has been developed in this study. It aligns with other attempts adopting, for instance, machine learning mechanisms (Borovsky et al., 2021). The present study uncovers two important features of the ALASS scale. Firstly, its ease of use: being a relatively brief online instrument based on self-reports, it becomes an uncomplicated method for collecting data with adult participants (all 31 items were completed in between 5 and 10 minutes of time). Secondly, its process of validation: the reflective information provided by over 200 participants has been contrasted with more objective data, based on language tests including reaction times, and hence, assumed to work at a much smaller level of awareness. It has not been possible to establish links between CS and the scores of the Tromsø scale, as well as our measure of academic achievement. Although this is an obvious challenge to the validity of the ALASS scale, it is important to remember that we have not recruited adults with a history of language difficulties. It would be very interesting to see if the scores in CS reported by adult participants with language-related conditions are more informative in this regard than the scores achieved by the typically developing adults recruited in this study.
The second ALASS factor, LP, can predict faster correct responses in the language test. This result could be in line with the memory perspective defended by Montgomery, Gillam and Evans (2021) since they found that basic cognitive processes, like working memory and attention, had a determining factor in sentence comprehension for DLD children, but less so for typically developing children. The other key finding in relation to the predictive power of LP is more puzzling, because high scores in LP correspond with lower scores in the Social Skills component of the Tromsø scale. Therefore, participants scoring high in LP are not only expected to respond faster in the language test, but also to score lower in items like “I fit in easily in social situations” and higher in items like “I have a hard time getting along with other people”. The combination of these two effects completes an interesting three-fold phenomenon, indicating that the strong link assumed between language competence and social skills (e.g., Dubois et al., 2020), has authentic cognitive implications, because a high level of self-perception in literacy or performance-based items correlates with lower confidence in social scenarios.
The evidence presented here sheds light into the implications of using language with two distinct functions: a social purpose on the one hand, and a purpose related to functioning, including literacy-related skills, on the other. This finding has direct implications for the relation observed between language disorders and academic achievement (Wren et al., 2021), as well as psycholinguistic proficiency and socioemotional implications, like offending (Winstanley et al., 2019). The complex interaction observed between the effects of LP and SUL also have implications at a more theoretical level. Karmiloff-Smith (2009) summarised several central questions on the nativism vs constructivism debate in relation to language disorders that are directly relevant in this case, because the intricate relation observed in this study between different skills, with effects in seemingly opposite directions, are indicative that domain-specific outcomes are the result of a complex process of development, that can no longer be understood as encapsulated functions, as van der Lely (2005) had defended. The effects observed with the LP factor also empower arguments defending the role of executive functioning (e.g. Henry et al., 2012) or working memory (e.g. Lum et al., 2012; Montgomery et al., 2010).
Future use and development of this scale could go in two different directions. First, it could be adapted for younger populations, as an early assessment tool in educational contexts for children, in a similar way to the measures achieved by Ebert et al. (2020), Gough Kenyon et al. (2020), Lonigan and Miburn (2017) and Matov et al. (2018, 2020), or for adolescents (Mathrick et al., 2017). Additionally, Kenyon et al. (2021) have also looked at the potential consistency between parental and self-reported adolescent wellbeing, suggesting that ALASS could be used by both parents (reporting about their children skills) and adolescents (reporting about their own skills). In addition, Sedgwick and Stothard (2019) have identified that the perceptions of educational psychologists in relation to language and communication needs have to be further informed, so we believe that ALASS could be a valuable tool in this sense. A second direction could involve deepening the validation of the scale with further language tests, exploring other grammatical features or adapting them to multilingual contexts (Karem et al., 2019).
Author Note
Data, headlines, and additional online materials are openly available at the project’s Open Science Framework page (https://osf.io/6m7gd/). We have no conflicts of interest to disclose.
Footnotes
Acknowledgements
We are grateful with all the people participating in this study. We also want to acknowledge the contribution of Layla Yilmaz, Shanae Bell, Rachel Mitchell, Jess Firman, Liv Henderson, Bronwyn Cheeseman, Leah Martin, Elishah Afzaal, Zaynah Mahmmod and Aleksandra Olbinska during the data collection. We are grateful with the comments received by the peer reviewers and the editor.
Bio Sketches
Hannah Joyce, MSc, BSc, MBPsS. PhD candidate Doctorate in Applied Educational Psychology (University of Nottingham). She has previously completed a BSc in Speech and Language Sciences (University of Sheffield, 2018) and a MSc in Psychology (Sheffield Hallam University, 2019). She is interested in child language development, the impact of language and communication difficulties across the lifespan, and effective support that can be provided to help children and young people to be confident language users.
Javier Aguado-Orea, PhD. Senior Lecturer in Psychology. He is mainly interested in the study of learning mechanisms involved in the acquisition of language. He completed his doctoral studies in 2004 (University of Nottingham) and since then has worked in higher education institutions in Spain (mainly at Zaragoza and Complutense Universities) and in England (Sheffield Hallam University).