
Abstract
Previous research indicates that understanding the state of learning motivation enables researchers to deeply understand students’ learning processes. Studies have shown that visual programming languages use graphical code, enabling learners to learn effectively, improve learning effectiveness, increase learning fun, and offering various other advantages. This study is a counterbalanced experiment on the students of a class, conducted in three stages. The first stage examines the students’ initial motivation states. In the second stage, students use a traditional programming language before a visual programming language to learn a specific data structure topic. Finally, in the third stage, students use a visual programming language before a traditional programming language to learn another specific data structure topic. After collecting the experimental data, we cross analyzed questionnaire results to observe whether there was any correlation between them. We found that the motivation state at stages two and three were significantly higher than at stage one. It can be deduced that the use of a visual programming language in a data structure course has a significant effect on improving learning motivation.
Introduction
Earlier research on digital learning shows that teachers focus mainly on results instead of the self-efficacy and motivation of students [1]. Understanding the motivation of students can enhance the process of learning. With proper encouragement, teachers can increase the motivation of students, effecting better engagement. In recent years, the learner-centered approach has been adopted widely in higher education in Taiwan. This approach is not only used in computer science education but also in various subjects. The emphasize on learning engagement and cooperative learning is essential for teachers in Taiwan.
Data structure is a core competence and basic course in the area of Computer Science. Data structure is used to organize and arrange original data in computers. It can utilize memory space effectively, speed up the CPU, and boost the operating performance of a computer [2, 3]. In the computer science area, data are acquired by using programs. Having an efficient data structure and algorithm will enhance the effectiveness and performance of a program [4, 5]. Therefore, Data structure is a required subject in fields related to computer science, such as Information Engineering, Information Management, and Computer Information and Network Engineering.
The research of Chen and Sobh [6] indicates the need of scaffolding from teachers in data structure visualization and related algorithm animation. However, due to time constraints, a massive amount of knowledge is often given to the student in a short period. Most teachers use a traditional programming language such as Java or C to teach Data structure courses. Thus, it is difficult for students to put learning into practice.
In class, teachers can detect errors in a student’s coding promptly. However, it is challenging to locate the errors made by the students during the process of programming [7]. Due to insufficient software designing experience, students experienced hardship in learning data structure, which led to a lack of learning motivation. Therefore, it is crucial to offer data structure courses that combine programming theory and practice in a limited period.
Given the research background, this study aims to understand the alteration of students’ motivation during the two approaches used to teach data structure. By designing experimental lessons using the traditional teaching method and the visual programming language teaching method, we will detect the shift in student motivation while learning. In accordance with the investigation we carried out, this research further aims to examine the difference in student motivation during data structure courses conducted with visual programming language and Java.
Literature review
Teaching data structure
In computer science, data structure is a method for organizing and assembling atomic data. The data could be a character string or binary data, based on how the materials were collated. The organization of data is according to the collation of materials. Data structure can determine the method, process, and algorithm of a program. The data can be distributed across various locations of the computer memory and systematized efficiently by particular methods or formats. Data structure is important for a computer scientist in much the same way that a librarian’s filing system is; the librarian organizes his books (data) into a particular form (data structure) to efficiently perform a task (find a book). Data structure, which is considerably difficult not only to learn but also to teach, is the core course for students majoring in Computer Science and Information Technology.
Data structure is used to design an efficient algorithm, to organize data access, and to economize the execution time of programs. Furthermore, data structure is vastly used in operation systems, database management systems, statistical software, and display cards. It is also used in compiler design, numerical analysis, and artificial intelligence simulations. Data structure has played a significant role in the computer science domain. In the USA, data structure is an important subject in the Advanced Placement Computer Science (APCS) courses [8]. APCS classes are divided into level A (CS-A) and level AB (CS-AB). CS-A introduces the basic data type, such as byte and character string, and presents collective data types, such as structures and arrays. CS-A mainly focuses on programming methodologies, problem solving strategies, and algorithm development. CS-AB includes the topics under CS-A and further complex data structure, such as linked lists, stacks, queues, trees, heaps, and priority queues.
Since the academic year of 1998, data structure has been given an independent chapter in the senior high school computer science textbooks in Taiwan. The courses are intended to strengthen student knowledge in basic concepts and principles of computer science and to cultivate students’ abilities for problem solving with a computer. By learning how to write heap and queue routines, learners could solve actual problems in programming [9]. Compared to the concept-orientated senior high school data structure courses, the courses in college concentrate on the practical aspects. Data structure has become a required course in information-related fields in Taiwan.
Visual programming languages (VPL)
Learners commonly use text-based programming language, such as C++, Java, and C#, in data structure courses. The students are required to memorize text-based programming language commands, algorithm, and logic. This creates a high cognitive load for learners; therefore, it is relatively challenging for beginners to learn. While the optical system of a human being is multidimensional, programming languages are considered unidimensional. It is therefore difficult for the human brain to exploit and use this knowledge [10]. To overcome this limitation, program developers transformed text-based programming into object-oriented programming and gradually established visual programming languages (VPL).
Scratch, AgentSheet, and LabVIEW are visual programming languages that can be presented visually. They can provide effective learning and sensory experience for the students. Learners can develop dynamic internal representation to understand abstract concepts [11]. VPL offers a graphical user interface (GUI) so that learners need not memorize specific commands and logic. Programming can be done by utilizing the graphics in the user interface. Concreteness, directness, explicitness, and immediate visual feedback are the characteristics of VPL [12]. VPL can be used to engage learners in constructing their own input data sets, making predictions regarding future visualization states, programming the target algorithm, answering strategic questions about the visualization, and constructing their own visualizations [13].
VPL is also known as graphical programming language. Users arrange meaningful graphic blocks to complete a program. VPL can reduce fear and enhance clarity for programming beginners. In VPL, iteration is referred to scoping visualized blocks. Visualized scoping is suitable for training learners in understanding methods of programming. The visualized blocks are categorized by color and shape. Take Scratch, for example; the Scratch blocks are classified into nine colors. The nine categories are motion, looks, sound, pen, data, events, control, sensing, and operators. By the categorization, it is easier for learners to distinguish when and how use the Scratch blocks. Scratch would therefore be suitable for beginners.
Simões et al. [14] pointed out that VPL Scratch can make learning more pleasurable and promote students from intermediate to high level. Sáez-López et al. [15]have shown that VPL software such as Scratch is easier and more efficient to learn than visual basic programming languages. When Booth and Stumpf [16] compared VPL and text-based programming languages, they figured VPL could create a better learning environment for the student. Although improvements can be made, VPL provides a positive learning experience that is suitable for beginners.
Motivation
Motivation is defined as an internalized procedure in psychology. It is what prompts and supports a human being’s action. Several elements can inspire human motivation, such as need, desire, curiosity, exploration, and expectation [17]. Motivation is an urge that triggers human beings toward their goals and generates expectation for the future [18, 19]. It is evident from the common expression of students concerning their lack of motivation for learning that motivation is crucial to students’ academic achievements. If a student were motivated to study, the fruitful academic results would satisfy the student greatly. The positive reinforcement would trigger the student’s motivation constantly. According to Maslow’s hierarchy of needs, it indicated that that action is the result of demand. Human beings will meet basic needs before fulfilling self-actualization, and that motivation is an internal force and would not be controlled by external forces [20]. Deci and Ryan [21] assume that when a learner accomplishes something voluntarily, the student is intrinsically motivated. To elaborate, actions are fueled by motivation. The degree of motivation will influence the motion. If the motivation discontinues, the action will end accordingly. Therefore, low motivation would result in unsatisfying learning results. Motivation is the key that affects learning.
This research is based on Keller’s Attention, Relevance, Confidence and Satisfaction (ARCS) model of motivational design to measure the motivation levels of students before and after learning VPL. John Keller presented ARCS in 1983; it incorporated the physiological theories of the motivation and instructional design models. Unlike the traditional course designing views, ARCS emphasizes the importance of student interest towards the learning materials and enthusiasm towards learning. It also pays attention to the affective domain of learning [22]. There are four steps in Keller’s ARCS model of motivational design:
Attention: Attention means to gain a student’s interest and attraction. There are three ways of doing so:
Variability – Use different examples, activities, and modules. Inquiry arousal – Ask questions; challenge the students to difficult problems. Perceptual arousal – Inspire students to learn; create novelty and uncertainty in learning. Relevance: To satisfy a student’s needs and goals through forming relevance.
Familiarity – Encourage learners to utilize knowledge learned in the past to explore new studies. Goal orientation – Present objectives and provide learner-centered teaching. Motive matching – Design lessons according to different students’ needs. Confidence: Teachers should assist students in building confidence.
Learning requirements – Provide assessment criteria for the students to accomplish. Personal responsibility – Link learning to students’ effort and ability by giving them autonomy in learning. Successful opportunities – Provide the students with chances for success. Provide opportunities for the students to present what they have learned. Satisfaction: Through the process of learning, students can get satisfaction by internal and external elements.
Equity – Provide a fair grading system for the students. Intrinsic reinforcement – Encourage self-assessment and support intrinsic enjoyment of the learning experience. Extrinsic rewards – Give positive reinforcement or moderate praise to the students.
Although a revised ARCS-V model [23] was proposed, the volitional strength (i.e. V dimension) refers to the degree of commitment the students have toward achieving the learning requirements. However, the volitional strength may be affected by stress and anxiety. Moreover, Huang et al. [24] captured the ARCS model by the following equation: Satisfaction
Attention: Am I excited about this learning experience, and how I can make it interesting? Are the learners going to be interested? What tactics will stimulate their curiosity and interest? Relevance: Do I believe that this learning experience will be valuable for my learners? Will learners believe it is valuable? What can I do to help them believe it is important? Confidence: Am I confident in my ability to lead this learning experience effectively and interestingly? Will the learners feel confident about their ability to learn this? What do I need to do to help them be confident? Satisfaction: Do I expect to have positive feelings about this learning experience? What can I do to help the learners feel good about their experience and desire to continue learning? Volition: Will I provide effective supervision and support to the learners throughout this learning event? What can I do to help the learners maintain their goal orientation and task focus throughout this learning event?
For this study, a lesson in the data structures course was a targeted instructional program designed with the Scratch visual programming language. An objective of the experimental VPL programming activities is to promote student attention by providing different data structure examples written in Scratch. First, we illustrate the process of basic data structure (i.e. stack and queue), and then we discuss the VPL codes (Scratch) in addition to Java codes in the textbook. Some studies show that Scratch has positively affected student engagement [25, 26]. In contrast to Java data structures, this experiment benefits students by presenting them with simpler information. If instructors instead begin their courses with a short, simplified introduction by Scratch material, learners can intuitively create basic knowledge and confidence about the concept of the data structure topic. Then they can be prepared to acquire a sophisticated understanding of the more complex material (i.e. implemented by Java) to the data structure topic.
Since the 1960s, a large number of programming languages and systems targeted at novice users have been created [27]. Visual programming environments are believed to support the understanding and adoption of the control flow structures because these environments contain visual elements to reduce unnecessary syntax difficulties and assist novices in visualizing the effects of the adopted control flow structures [28, 29]. VPL has the advantages of clarifying complicated ideas and providing hooks for learners. It can increase learner comprehension and allows instructors to explain more material in a shorter period of time. Because comparisons of the learning effects of VPL and the text-based approach have been widely discussed in other research, the focus of our project is on simplifying the mechanics of programming and on elevating students’ learning motivation in traditional data structure courses with text-based programming languages.
Visualized stack and queue
The stack is an ordered list. The insertion and deletion of data happens at the top of the stack. When operating data in a stack, push always comes before pop. If the user inserts a subject onto the stack, it is called push. If the user deletes an item, it is called pop. Take the left panel of Fig. 1 for example; the newly added data follows the order 17, 18, 19, 20. Further, when the data is deleted, it follows the order in reverse: 20, 19, 18, 17. The queue is also an ordered list. The side where the data is inserted is called the rear, and the side where the data is deleted is called the front. When operating data in a queue, the data entered first is always deleted first. In other words, the data will be deleted in the order 17, 18, 19, 20 (the same as the input order of elements) in the queue.
Illustrations of stack and queue data structure.
Take the visualized queue in Fig. 2 for example; the software simulates the insertion and deletion of data using left and right arrows. The list simulates the limited memory. Because the memory is limited, the last space for the data is programmed to be null data. As shown in Fig. 2, numnull is set to one. The left arrow is used to insert data and the right arrow is used to delete data. There are two or more blank spaces when the value of numnull is more than one. The numnull should not be one when entering data. The head variable in Fig. 2 is to indicate the location of the designated list. The right side of the visualized queue is the Enpueue. The Enpueue is used to determine whether the variable in the numnull is larger than one. If so, users could continue to input data.
Visualized queue & push queues (right arrow).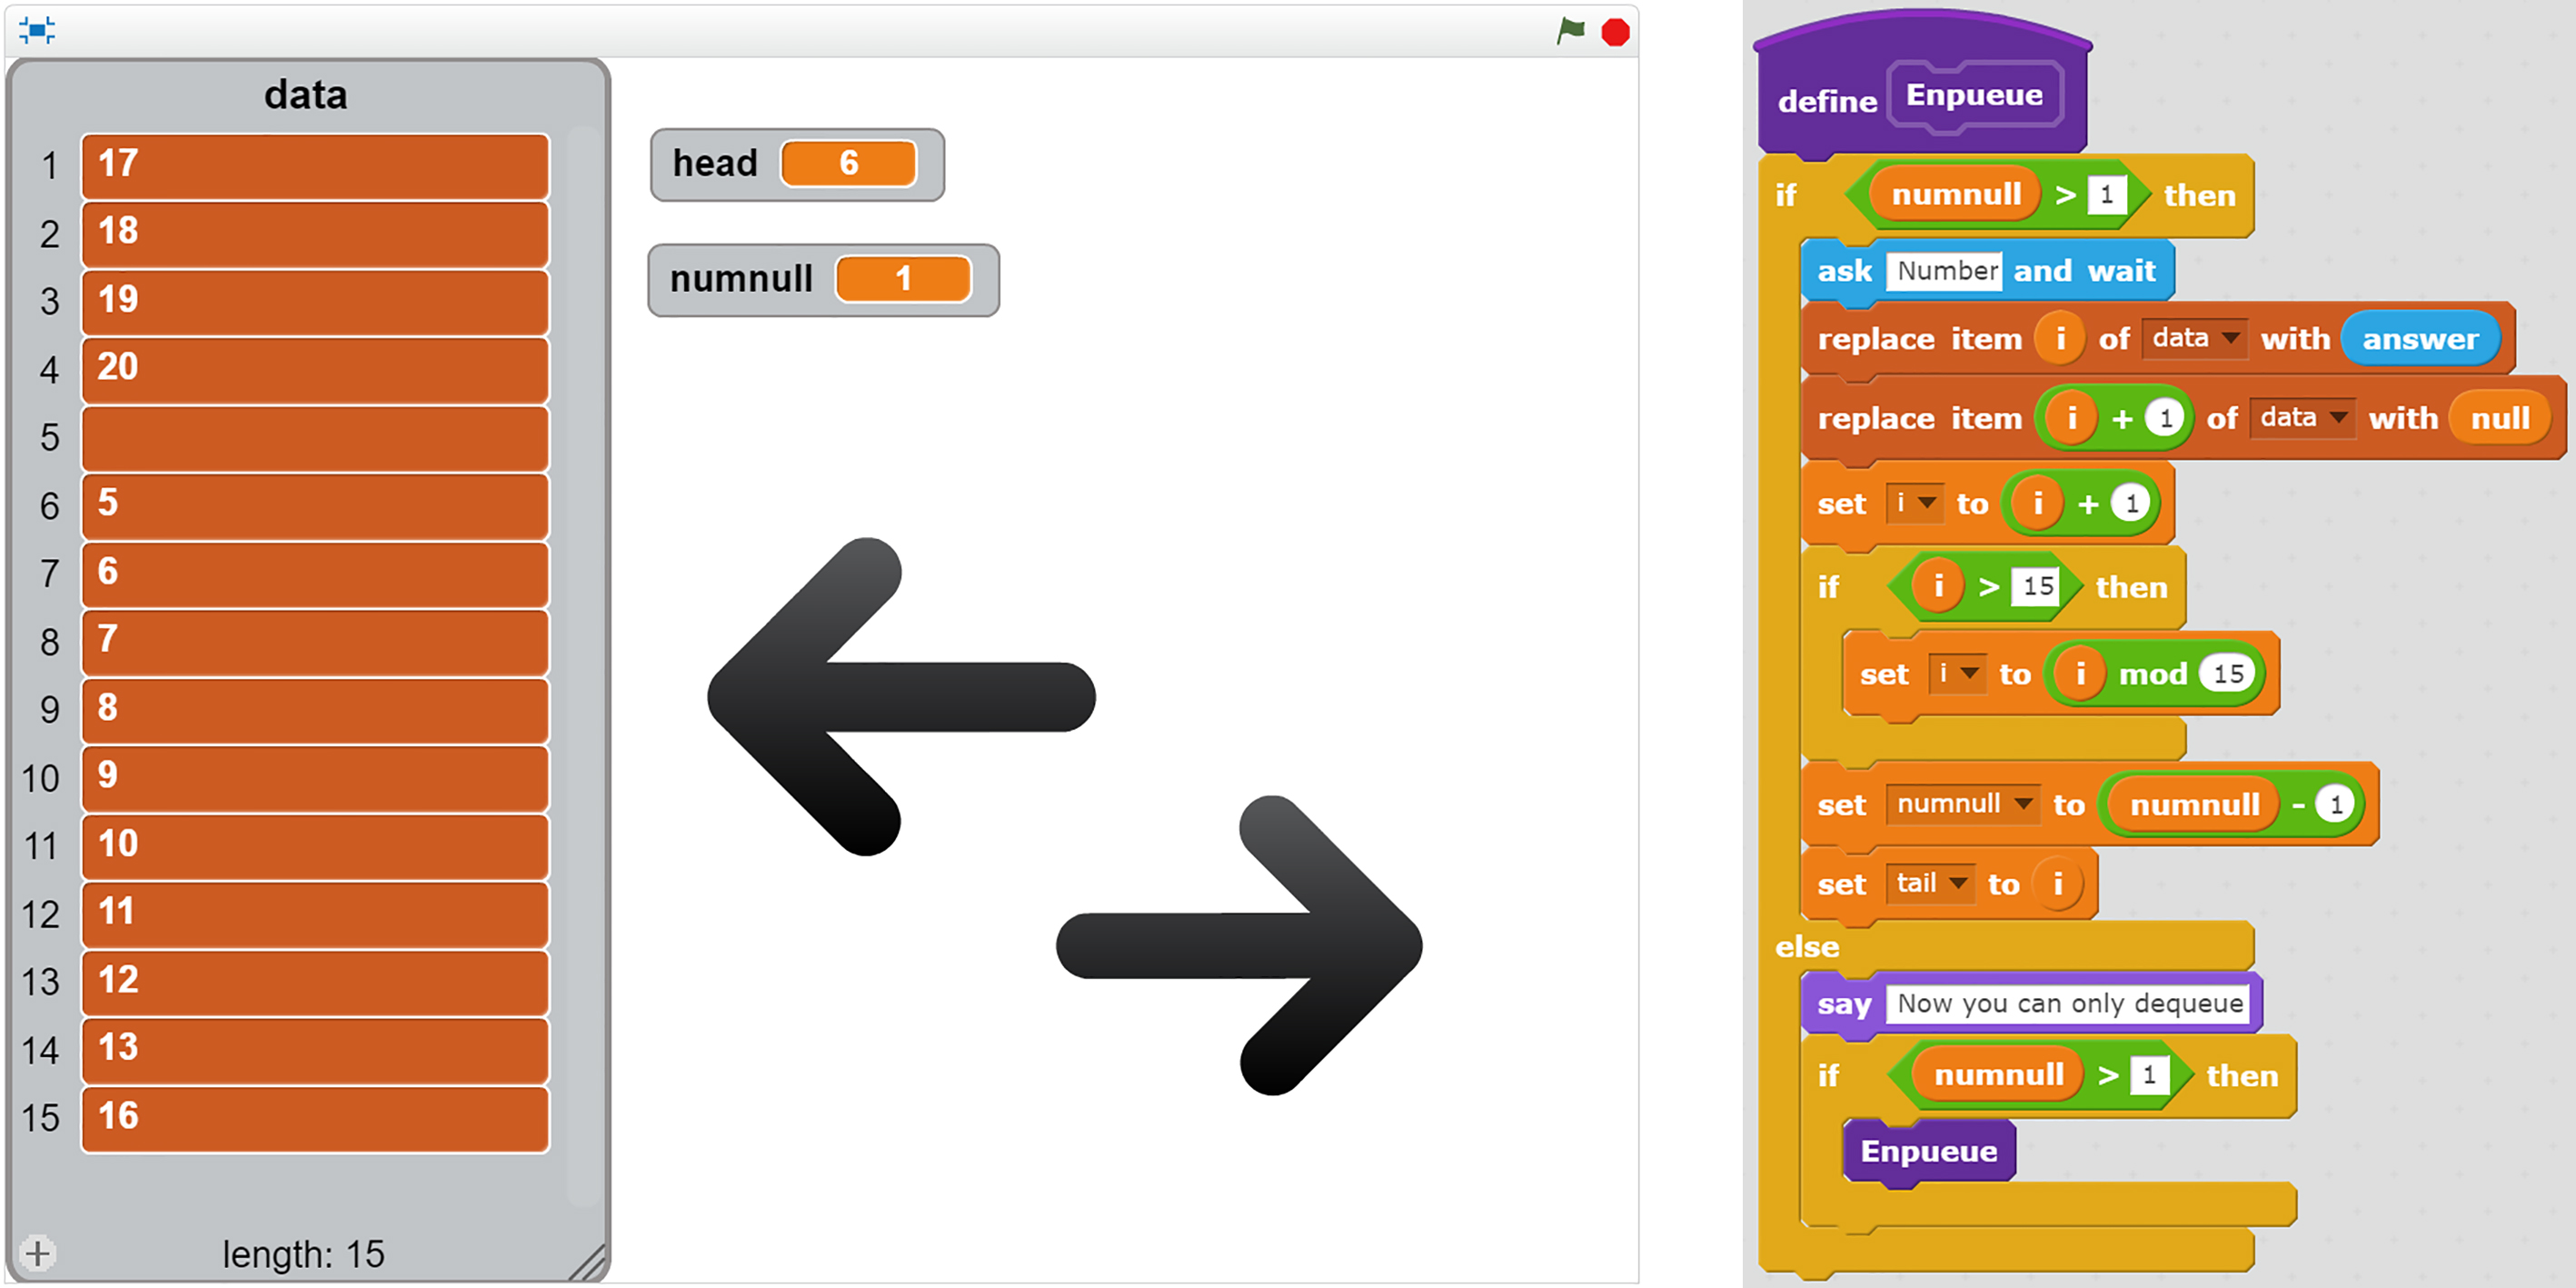
The participants were categorized by class into experimental group and control group. Pretest and posttest on the motivation of students was conducted to understand the correlation between the approaches and student motivation. The subjects were 37 sophomores from the Department of Information Management, University of Science and Technology, in Tainan. Subjects were treated as the control group (traditional method followed by VPL) in the first round and then as the experimental group (VPL first, then traditional Java code introduced) in the second round. Data were collected in the computer laboratory during a five-week session; the subjects were taught in a three-hour session each week. Before the experiment began, two chapters (i.e. stack and queue) were selected from data structure textbooks. It is estimated that learners can learn a unit in two weeks. All of the participants were given a questionnaire on learning motivation as a pretest before the experiment began. The appendix shows the content of the ARCS-based questionnaire that is revised from our previous paper [30]. The Cronbach’s alpha estimate of reliability was 0.96 and results of validity analysis were CFI
In the first week of the experiment, basic concepts of data structure were taught by the instructor. For example, the introduction of data structure units and the application of data structure in Java or VPL. In the second and third week, the first selected chapter was taught. The first round (set up as the control group) was conducted using the traditional method of teaching data structure, that is, through the Java programming language. On the other hand, the experimental group learned through VPL. In the fourth and fifth weeks, the research design for the second round (set up as the experimental group) was a counterbalanced design preventing problems originating from the order of teaching. The entire experimental process is shown in Fig. 3. Lastly, the pretest and posttest responses were evaluated to analyze the difference in motivation and the four dimensions of Keller’s ARCS module of motivational design. The results were used to assess the effects on student motivation of the traditional way of teaching and VPL teaching.
The original experiment design was limited; however, the experiment would not function as intended if altered. When VPL is added into traditional data structure courses, the order of information given to the learners will affect the learning results. On one hand, the visual programming language can serve for the purpose of scaffolding if added before the text-based data structure; on the other hand, visual data structure content provides comprehensive supports for text-based programs if added after the text-based data structure. Changes to the order of testament or factors in the experiment process should be reduced in order not to influence the results adversely.
Results
The result of the first round of pretest and the posttest is shown in Table 1. The result is significantly deviated. In the pretest, the student’s motivation is an average of 3.09 and the standard deviation is 0.35. In the first posttest, the average value on motivation is 4.57, and the standard deviation is 0.55. The p value of the paired sample t-test was less than 0.001. Therefore, there is a significant difference in the tests (
First round of pretest and posttest
First round of pretest and posttest
Flowchart of experimental process.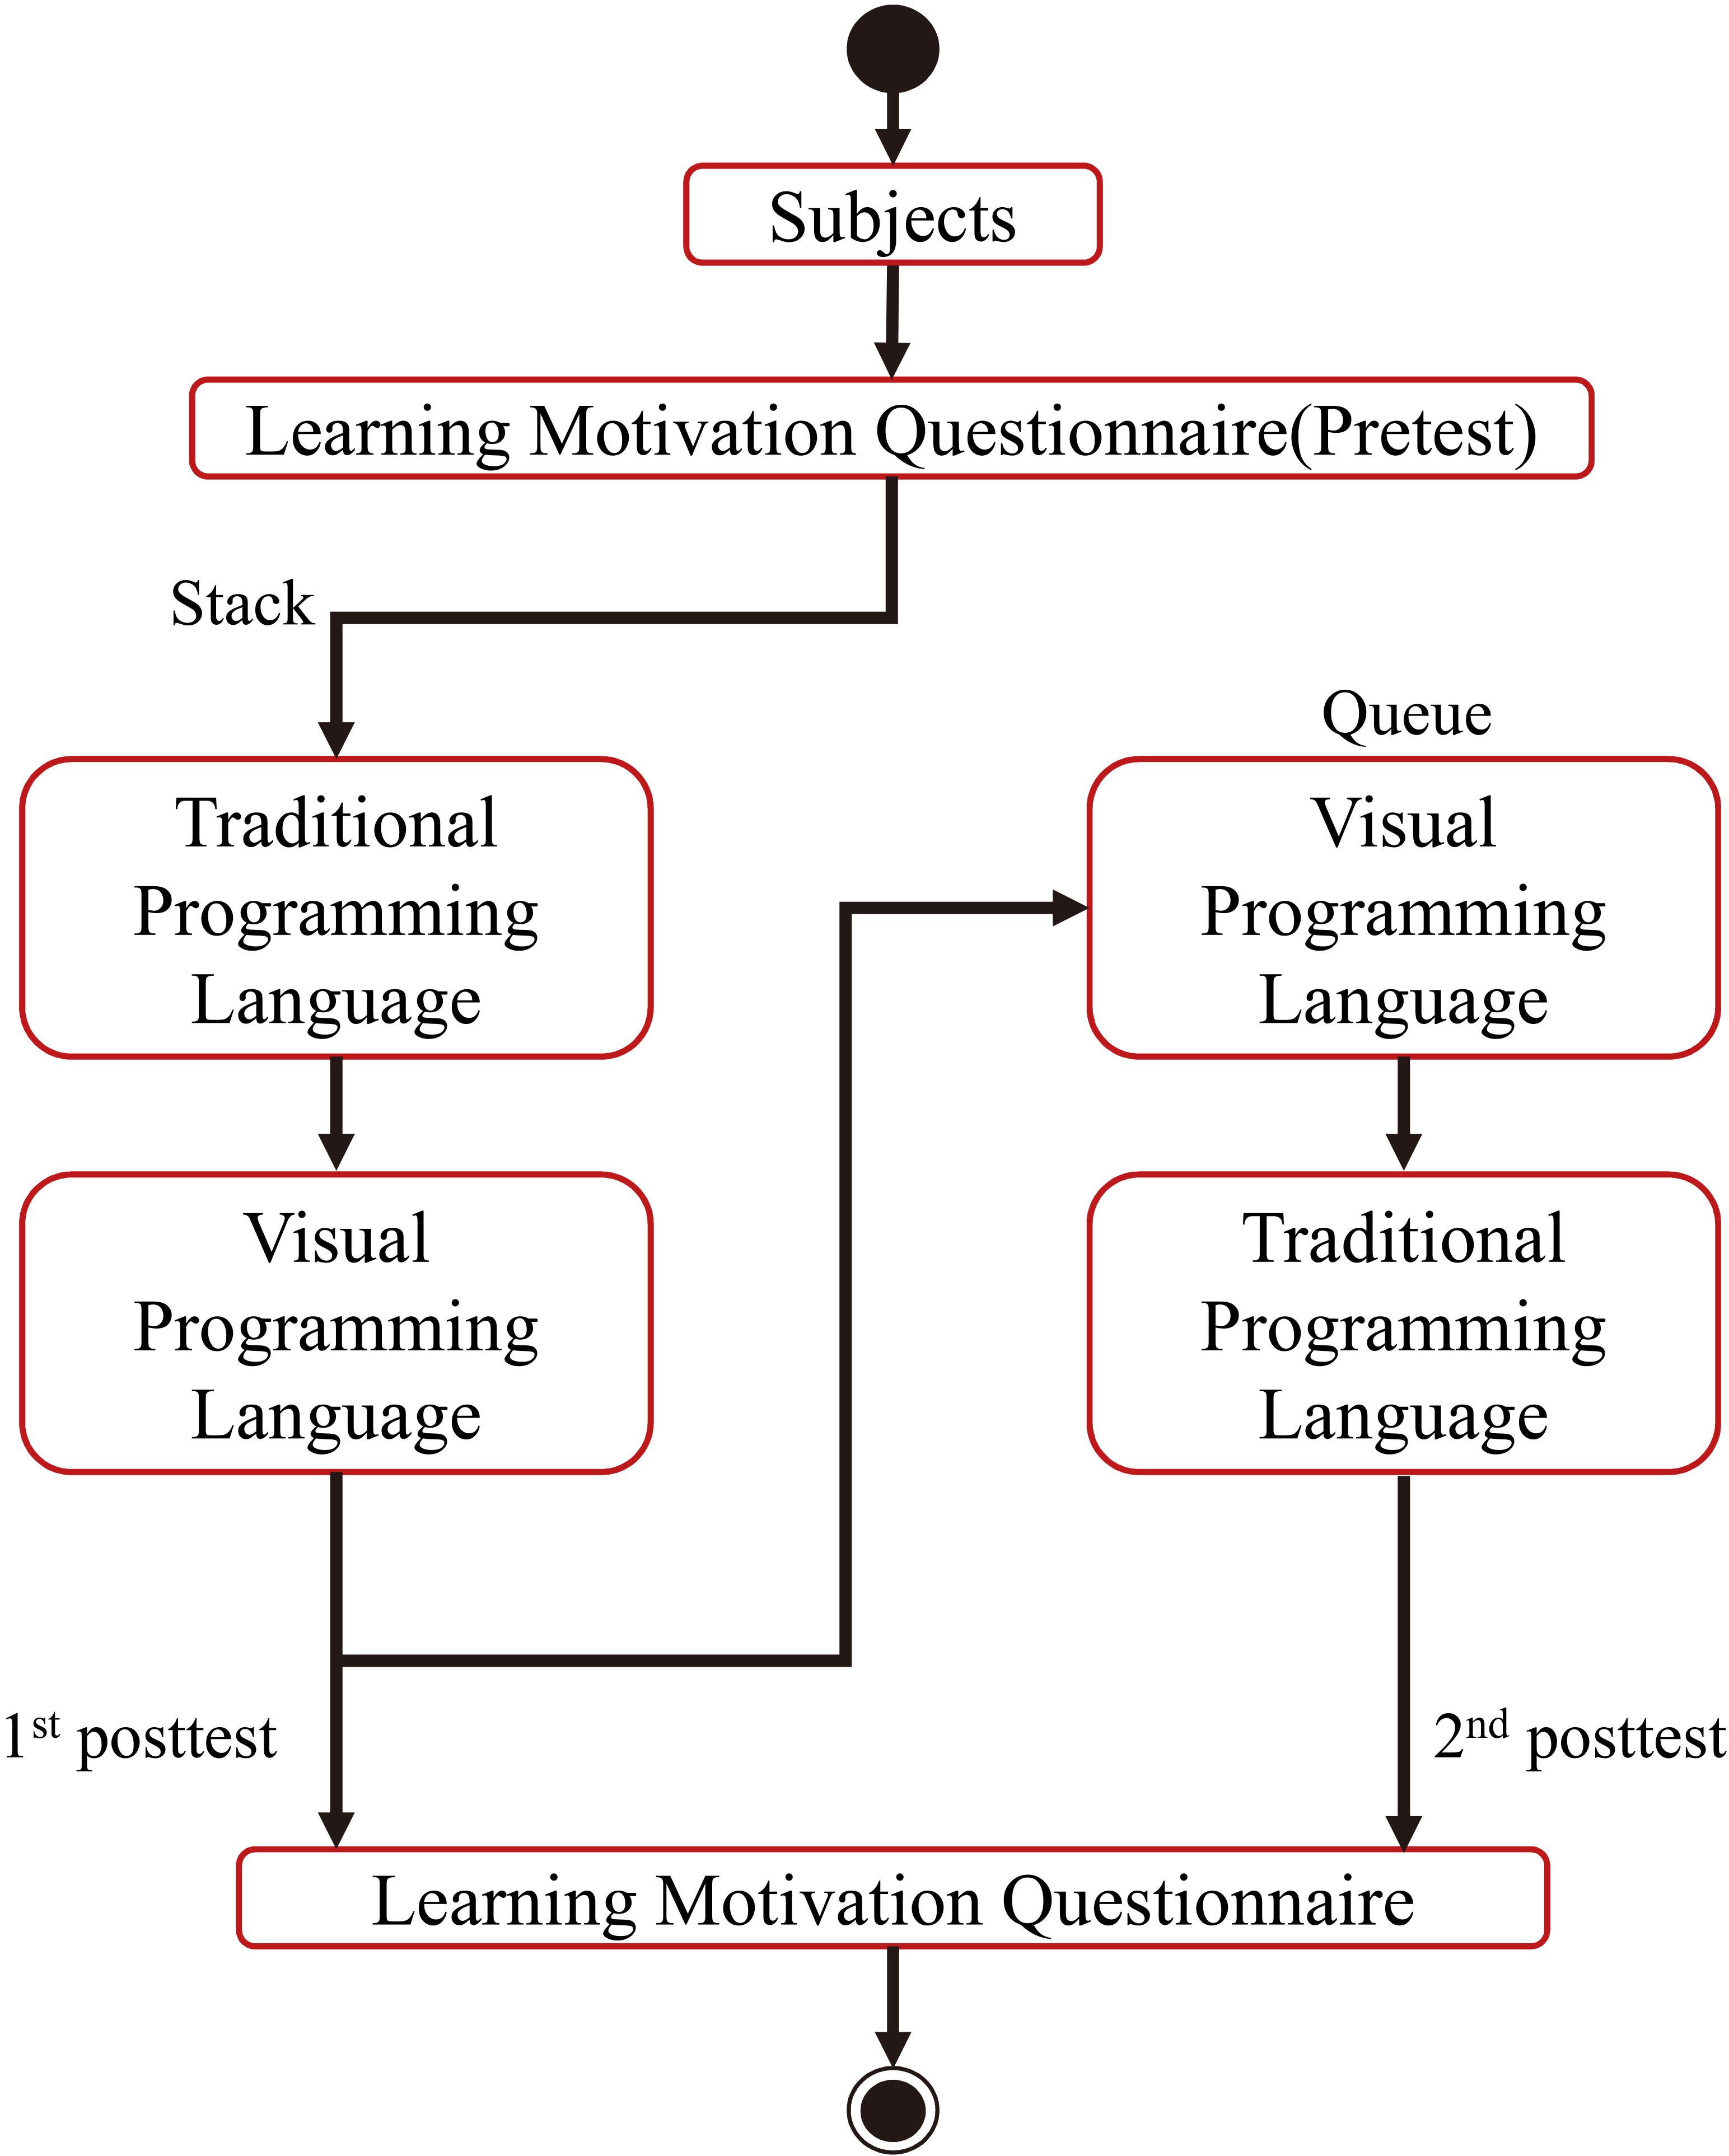
In the second round of pretest and posttest, shown in Table 2, the results are significantly different. The average value of pretest is 3.09 and the standard deviation is 0.35. As for the second posttest, the average value of learning motivation is 4.74 and the standard deviation is 0.45. In the paired sample t-test, the p value is less than 0.001. Thus, there is a significant difference from each other (
Pretest and posttest – round two
As shown in Table 3, the results of the first and second posttest were not significantly different. In the first posttest, the average value for motivation is 4.57 and the standard deviation is 0.55. As for the second posttest, the average is 4.74 and the standard deviation is 0.45. Regarding the value of the paired sample t-test, the p value is larger than 0.05. The difference between the tests did not reach the five percent significance level. The results suggested that the effect of task order is not significant although the first posttest average value of student motivation was lower than the second posttest. The average of learning motivation is higher with a smaller standard deviation (4.57
Posttest rounds one and two
The only dependent variable between stage 1 and stage 2 (or stage 3) is the involvement of the visual programming language Scratch. According to previous studies, learning motivation would not be changed significantly without intervention [30]. In the experiments, there is no significant difference in Table 1 (pretest vs. the first posttest) and Table 2 (pretest vs. the second posttest). Although the content in week 1 (stage 1) covered basic concepts of data structures, material to refresh learner memory on background information about programming design was included. Stage 1 can be regarded as traditional data structure courses with the text-based programming language. Consequently, the VPL teaching approach is considered the major influence on the learning motivation of students. We suggest that instructors introduce the topic first by VPL in data structure courses. The VPL overview of a data structure topic will let the learners feel confident about their ability to learn this topic.
As studies have shown, VPL can enhance the learning outcome and motivation of students according to previous studies. In this paper, we utilized VPL counterbalanced teaching experiments on students as three stages. In the first stage, we employed the traditional programming language to teaching data structure through Java. In the second stage, a chapter of data structure was first taught through the traditional programming language. Afterwards, the same chapter was taught to the same participants through visual programming language Scratch. Finally, in the third stage, the sequence is opposite from the second stage. The visual programming language Scratch is used first and then the traditional programming language. The t values in Table 1 (pretest and 1st posttest) and Table 2 (pretest and 2nd posttest) indicate that that the four dimensions of student’s learning motivation in data structure is increased positively. In contrast, the t value in Table 3 (1st posttest and 2nd posttest) is not significantly different. In conclusion, using VPL can enhance the learning motivation of students in data structure learning.
Conclusion
This experiment showed that the teaching of data structure should not always necessarily start off by introducing the topic in the form of traditional text-based programming language that the students are expected to learn but by introducing it in VPL form, which can build confidence for the students. VPL examples mean lowering the level of complexity for the data structure topics, and students are more likely to strive for success when they feel they can fully understand the VPL codes for that topic. Learners can make better intellectual observations about complex material with the initial VPL learning experience. Rather than just showing the student what they need to know and expecting them to memorize and understand it, showing VPL code first can create long-lasting enjoyment for students and encourage them to be much more involved in the topic. Further, the VPL activity design can help them visualize how these data structures work behind the scenes.
Footnotes
Acknowledgments
The research reported in this paper has been supported by the Ministry of Science and Technology in Taiwan under research project numbers MOST 104-2628-S-024-001-MY3 and 105-2511-S-024-007-MY3. Thanks to Ya-Hsuan Yang for assistance with English translation.
Appendix
The following ARCS-based questionnaire was used to measure learning motivation. The responses were measured using a 5-point Likert scale (1
There was something interesting at the beginning of this lesson that got my attention. These materials are eye-catching. This lesson has things that stimulated my curiosity. The way the information is arranged on the pages helped keep my attention. These materials are eye-catching. I really enjoyed studying this lesson. I could relate the content of this lesson to things I have seen, done, or thought about in my own life. The content of this material is relevant to my interests. There are explanations or examples of how people use the knowledge in this lesson. It is clear to me how the content of this material is related to things I already know. The content of this lesson will be useful to me. The content of this material is relevant to my interests. Completing this lesson successfully was important to me. I worked on this lesson, and I was confident that I could learn the content. After working on this lesson for a while, I was confident that I would be able to pass a test on it. It felt good to successfully complete this lesson. After reading the introductory information, I felt confident that I knew what I was supposed to learn from this lesson. If I encounter frustration in this lesson, I believe that I can overcome it. Completing the exercises in this lesson gave me a satisfying feeling of accomplishment. I learned some things that were surprising or unexpected. I enjoyed this lesson so much that I would like to know more about this topic. The wording of feedback after the exercises, or of other comments in this lesson, helped me feel rewarded for my effort. When I get quiz results in this lesson, I will feel a sense of accomplishment. It was a pleasure to work on such a well-designed lesson.