The number of circulating lymphocytes is altered in a number of diseases including either increase (lymphocytosis) or decrease (lymphocytopenia). Therefore, the assessment of total blood lymphocyte numbers and the relative distribution of lymphocyte subsets is a critical front-line tool in the clinical diagnosis of a number of diseases, including pediatric diseases and disorders. However, the interpretation of this data requires comparison of patient’s results to reliable reference values. Blood lymphocyte subpopulation numbers are also subject to genetic polymorphisms, immunogenic and environmental factors and vary greatly between populations. While the best practice reference values should be established within local representative populations of healthy subjects, to date, Caucasian reference values are used in Morocco due to the absence of indigenous reference values. Potential differences in blood lymphocyte subpopulation reference values between Caucasian versus Moroccan populations can adversely affect the diagnosis of pediatric and childhood diseases and disorders such as primary immunodeficiency (PID) in Morocco.
OBJECTIVE:
The aim of this study was to establish the age-stratified normal reference values of blood lymphocyte subsets for the pediatric Moroccan population.
METHODS:
We measured the concentration of lymphocyte subpopulations by flow cytometry from 83 Moroccan healthy subjects stratified into 5 age groups of 0–1, 1–2, 2–6, 6–12 and 12–18 (adult).
RESULTS:
The absolute and relative amounts of the main lymphocyte subsets of T-cells, B cells and Natural Killer (NK) cells were measured and compared to previously described reference values from Cameroonian, Turkish, American and Dutch populations. Additionally, we also observed an age-related decline in the absolute population sizes of lymphocyte subsets within our study group. Relative proportions of CD3CD4 helper T lymphocytes decreased with increasing age and by 12 years-adult age, both proportions of CD3CD4 helper T lymphocytes and CD3CD8 cytotoxic T lymphocytes, as well as CD3CD19 B lymphocytes were also decreased. Finally, we compared the median values and range of our Moroccan study group with that of published results from Cameroon, Turkey, USA and Netherlands and observed significant differences in median and mean values of absolute number and relative proportions of lymphocyte subsets especially at 0–1 years and 1–2 years age groups. Above age 12 years, the Moroccan values were lower. For NK cells, the Moroccan values are also lower.
CONCLUSIONS:
The results of this study have a significant impact in improving the threshold values of the references intervals routinely used in the diagnosis of paediatric diseases such as PIDs or mother-to-child transmitted HIV within the Moroccan population.
Lymphocytes are a subset of white blood cells that constitute an integral part of the humoral and cellular immune defence against foreign proteins and pathogens. The number of circulating lymphocytes can either increase (lymphocytosis) during certain infections such as mononucleosis or in lymphoproliferative disorders such as acute or chronic lymphocytic leukemia, or decrease (lymphocytopenia) during viral infections such as human immunodeficiency virus (HIV) or in inherited diseases such as primary immunodeficiencies (PID) [11, 13, 17]. On one hand, many childhood and pediatric diseases and disorders can reduce lymphocyte counts and/or subsets. Examples include, PID, as well as mother-to-child transmitted HIV [21, 28]. Pediatric cancers, on the other hand, can abnormally raise lymphocyte counts [8].
Flow cytometric determination of the total number of lymphocytes and/or lymphocyte subsets plays a particularly important role in the initial assessment and diagnosis of many clinical diseases and disorders, including autoimmunity, immunodeficiencies, infections, and malignancy [17, 40]. The interpretation of routine immunophenotyping performed with flow cytometry is highly dependent on the comparison between measured laboratory values of the sample being tested and normal values obtained from healthy individuals [17, 19]. The total number of white blood cells, including lymphocytes as well as the distribution of its subsets are highly variable in the population. The first National Health and Nutrition Examination Survey in the USA demonstrated that total leucocytes were different according to the age [22]. Other studies have also demonstrated the effect of age on peripheral blood lymphocytes [10]. Another study examined the total leukocyte counts between men and women all ages from 25 to 71 (at 5 year intervals) and concluded that this number was significantly different between men and women at all ages examined [3]. Similar differences were observed in monocytes, and eosinophils [3]. However, the neutrophil percentage dropped for women above 50, while lymphocyte numbers increased indicating the effect of female hormones on leucocyte counts [3]. Therefore, reference values should be age-stratified.
Other well-known regulators of the immune response include environmental exposure, including prenatal exposure [7], nutrition level [27, 36] and also microbial exposure or the “hygiene hypothesis” [2, 16, 34]. Because total lymphocyte numbers, as well as its subsets, can differ between countries due to local variations in these above-mentioned conditions, multiple studies have investigated ethnic populations to establish the reference laboratory values [14, 18, 24, 29, 33, 35]. Use of domestic reference values is therefore expected to improve the accuracy of flow cytometry-based diagnosis. In a previous study, our group established the lymphocyte reference values for the adult Moroccan population [30]. The aim of this study was to establish the age-stratified normal reference values of blood lymphocyte subsets for the pediatric Moroccan population. Yet, a similar study has not been heretofore performed on this population.
Methods
Subjects and samples
Ethylenediaminetetraacetic acid (EDTA) preserved whole blood was obtained from healthy children at the Immunology, Allergic and Respiratory Diseases Unit, Children’s Hospital of Rabat in the period between October 2005 and March 2008. Samples were sent to Laboratory of Cellular Immunology in the National Institute of Hygiene for immunological analysis. Parental informed consent was obtained before assessing subjects for the study. Each individual was assessed clinically by a paediatrician to confirm if he/she was eligible to take part in the study. We also asked the parents if there were any histories of infectious diseases or immunologic and hematologic disorder in the child or in the family. Eighty-three blood samples were obtained by venipuncture and the samples were divided into 5 groups based on the age of the donor; Group I: from 0 to 1 year ( 12), Group II: from 1 to 2 years ( 13), Group III: from 2 to 6 years ( 17), Group IV: from 6 to 12 years ( 21) and Group V: 12 years ( 20).
Immunophenotyping
Samples were analysed within 24 hr of collection by four-color flow cytometry immunophenotyping in the Laboratory of Cellular Immunology, National Institute of Hygiene, Rabat). Absolute count and the percentage of the lymphocyte subsets were obtained after lysis of erythrocytes in whole blood using a single platform technology. Lymphocyte subsets investigated were CD3/CD19 B lymphocytes, CD3 T lymphocytes, CD3/CD4 T helper cells, CD3/CD8 cytotoxic T cells, CD3/CD16 and/or CD56 Natural Killer (NK) cells. Blood cells staining was performed in BD Bioscience true count tubes using 2 separated combination mixtures of labelled monoclonal antibodies (Multitest, BD Bioscience). Each mixture was added to 50 L of whole blood, vortexed gently and incubated for 10 min in the dark at room temperature (20–25C). The red blood cells were lysed by adding 1 ml of diluted FACS lysing solution (BD Biosciences) followed by 10 min incubation. Samples were analysed in a BD FACSCanto flow cytometer (BD Biosciences). The instrument was calibrated using Calibration Beads following the guidelines and the instructions of the manufacturer (Beckman Dickinson).
Gating strategy
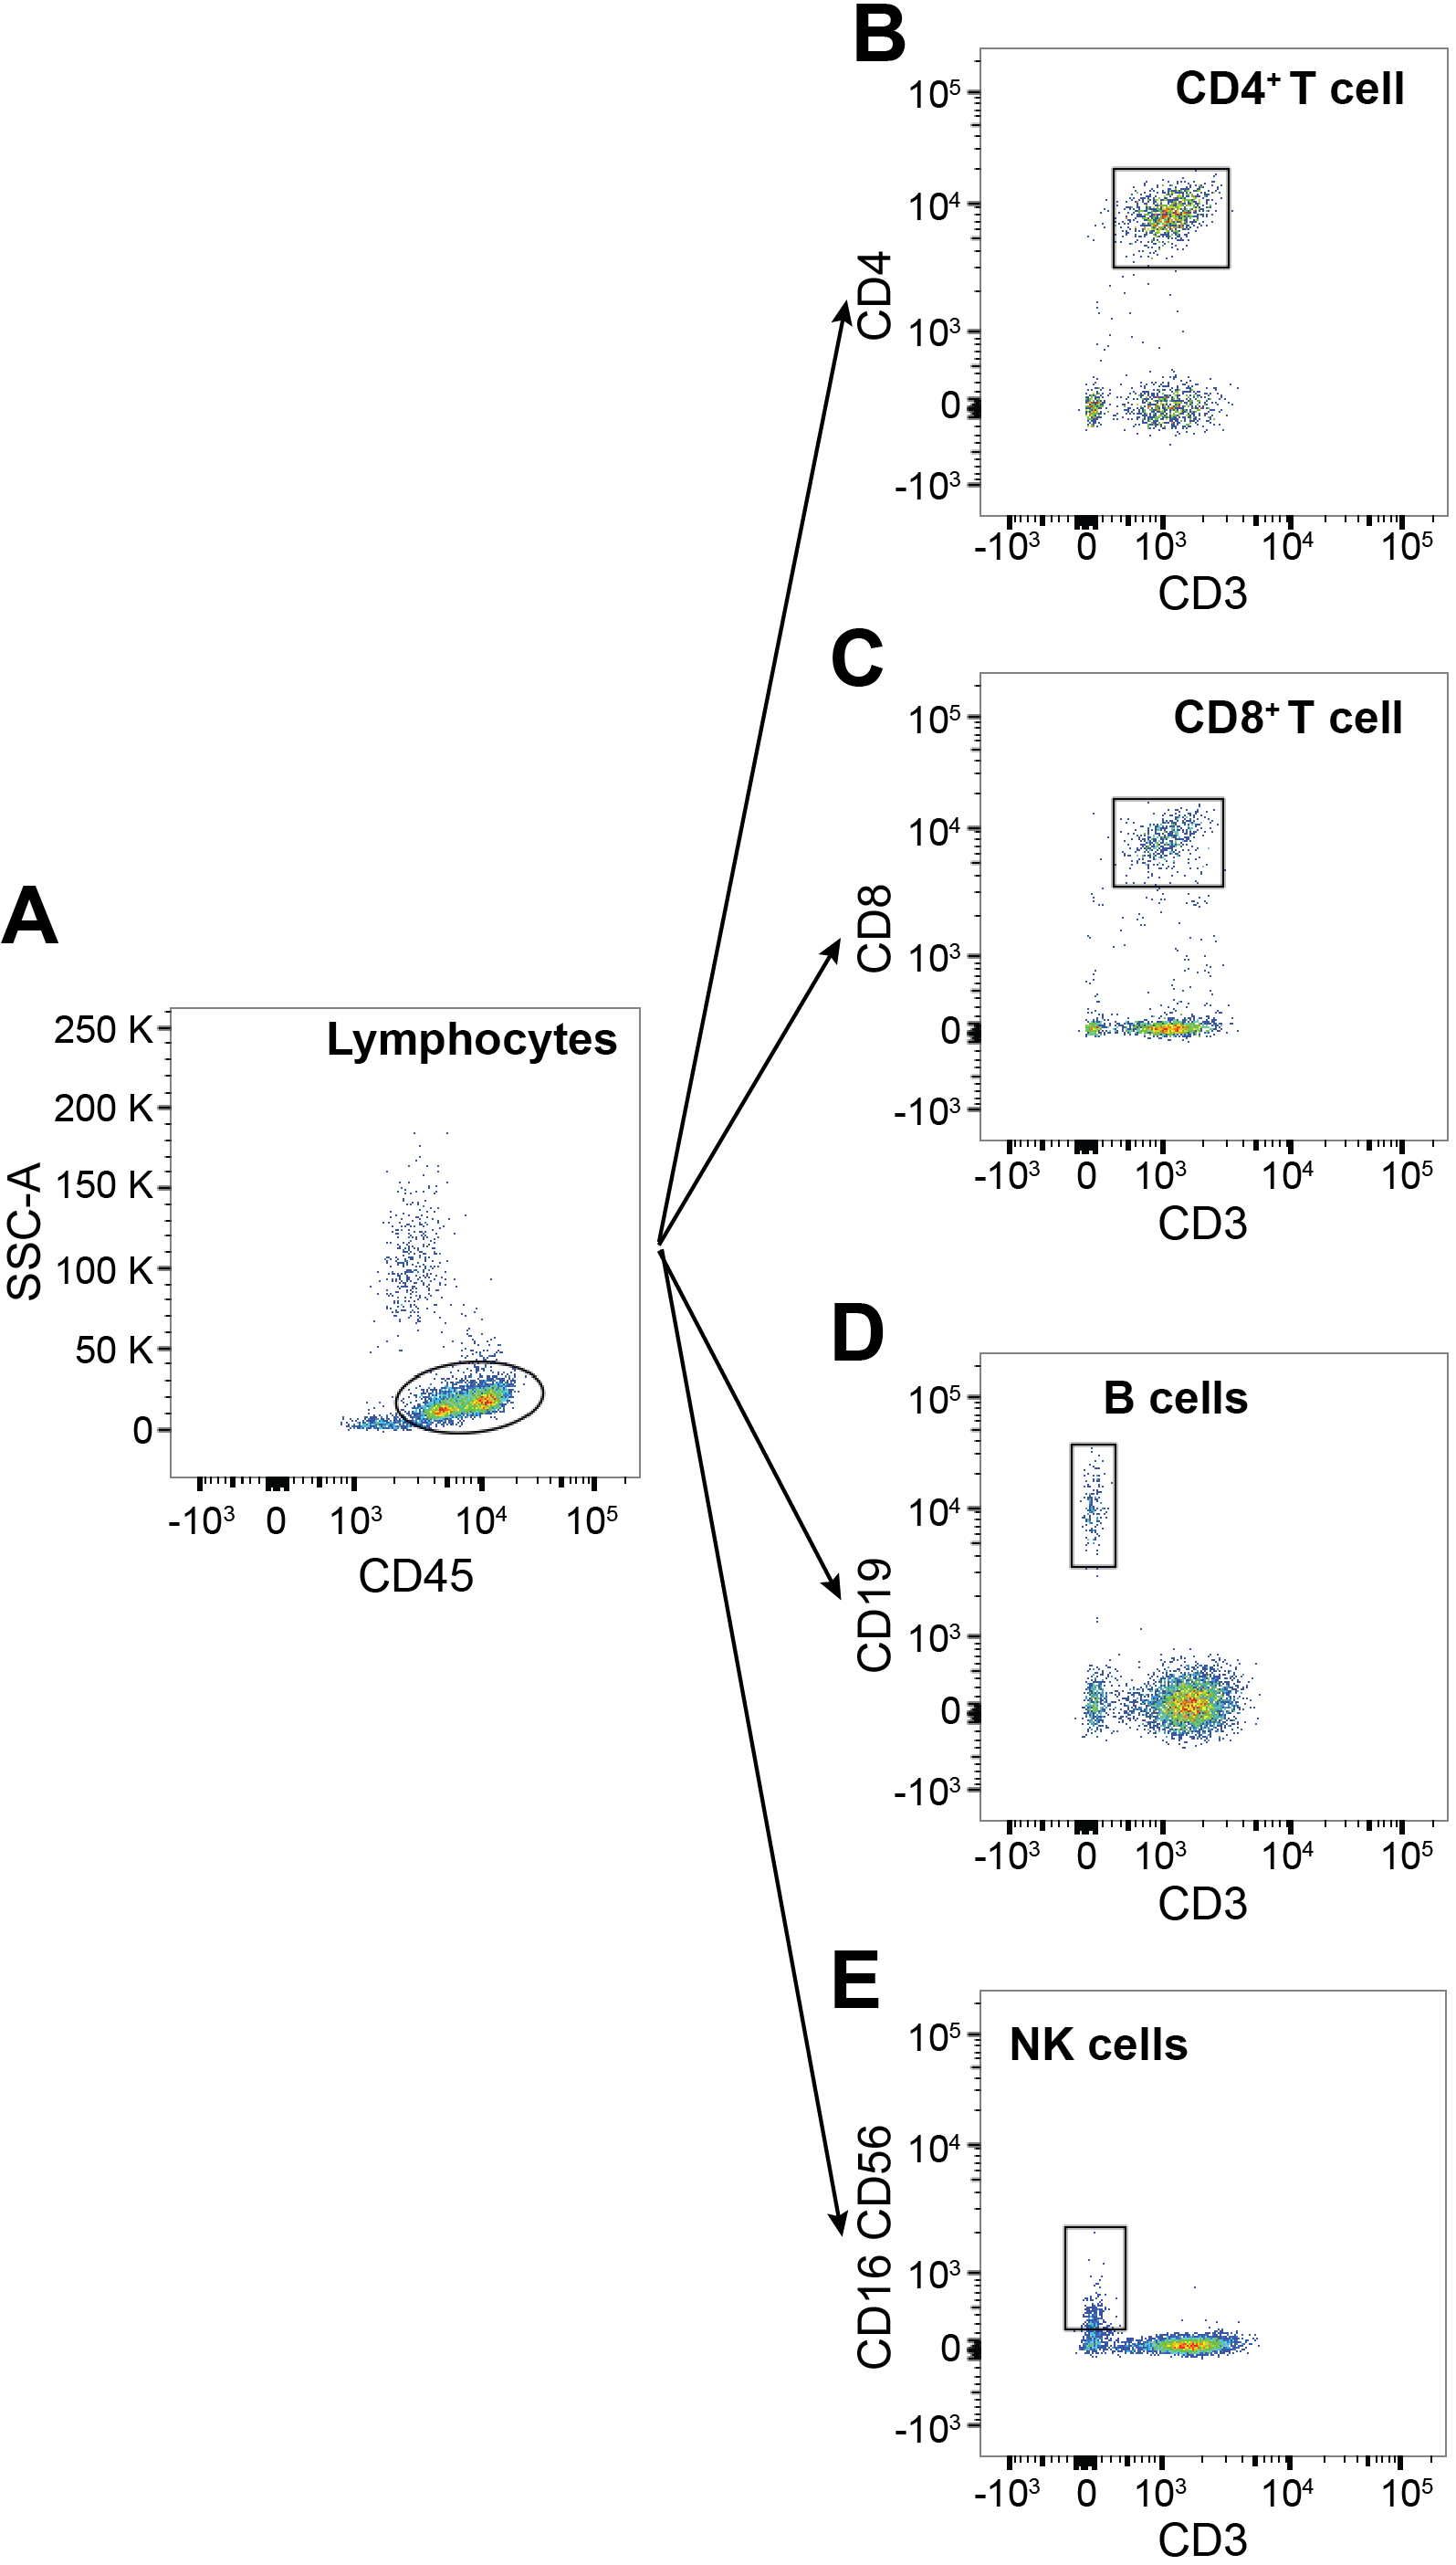
Data were analyzed in FlowJo software (BD Biosciences). Cells were initially gated for lymphocytes (CD45 versus FSC-A). CD3 surface expression was then determined. CD3 cells were further analyzed for expression for CD4 versus CD8 expression. CD3 cells were examined for CD19, CD16 and CD56 expression. The numbers of following lymphocyte subpopulations were determined: lymphocytes (CD45), T lymphocytes (CD3), B lymphocytes (CD19), NK cells (CD3, CD16 and/or CD56), helper T lymphocytes (CD3CD4, cytotoxic T lymphocytes (CD3CD8). Representative example of gating strategy and identification of specific lymphocytic subsets is shown in Fig. 1. The percentages of each gated lymphocyte subpopulation are directly given by the analysis software. The subpopulation absolute size was determined by reporting the acquired cells count by the volume calculated using a known concentration of True Count beads.
Representative example of gating strategy and identification of specific lymphocyte subsets. Lymphocytes were selected based on their side-scatter and CD45 positive staining (A). Subsequently, T lymphocytes were identified as CD3 and subdivided into CD4CD8 or CD4CD8 cells (B) and (C). Non-CD3 lymphocytes were identified as CD19 B cells (D) or CD16CD56 NK cells (E).
Statistical analysis
Results (absolute counts) were calculated by Excel (Microsoft) and statistical testing for normality was performed using the Kolmogorov-Smirnov test and the Shapiro-Wilks test. For the data on absolute numbers, 40 % of the values were skewed. For the relative size, most of the data had normal distribution. Only 20 % were skewed. An algorithmic for transformation was performed using SPSS 20.0 to reduce the skewing. Following this correction, 100 % of the transformed data fitted a normal distribution (Alpha 0.05). The distribution of patients by age groups varies between 12 and 21. Since this number is small for the determination of confidence interval, we chose to determine the tolerance interval [23]. We set the proportion to be included at 0.90 [two-sided, comparable to the percentile points (p) 5 and 95] with a confidence level of 0.95. The tolerance limits were calculated with Minitab 18 and the log-transformation values were retransformed to original values; all the values given in the table are original. Mean, Median, Maximum, Minimum values, as well as significant difference within lymphocyte subsets across different groups were calculated using Prism 8.0 (GraphPad).
Results
The absolute and relative values of the cytotoxic T
Absolute count of lymphocyte subsets
Age groups
Group I 11
Group II 13
Group III 17
Group IV 21
Group V 20
Lymphocyte subsets
Median % of lymphocytes
Mean (5 to 95 percentile) % of lymphocytes
Median % of lymphocytes
Mean (5 to 95 percentile) % of lymphocytes
Median % of lymphocytes
Mean (5 to 95 percentile) % of lymphocytes
Median % of lymphocytes
Mean (5 to 95 percentile) % of lymphocytes
Median % of lymphocytes
Mean (5 to 95 percentile) % of lymphocytes
CD3+
75.00
75.43 (54.4–92)
66.18
66.18 (51.50–80.00)
59.21
59.21 (38.70–76.90)
67.33
67.33 (44.44–86.67)
70.68
70.68 (46.03–81.90)
CD4+
50.60
57.39 (35.7–96.8)
41.38
42.27 (30.48–58.54)
36.36
35.20 (19.35–46.15)
36.96
36.84 (22.22–54.29)
36.58
35.91 (25.64–49.88)
CD8+
16.40
17.69 (9.40–26.20)
25.00
25.05 (16.36–37.80)
21.70
20.95 (11.36–30.23)
22.20
23.71 (15.00–35.56)
25.80
25.50 (10.90–41.12)
CD19+
23.30
27.34 (8.7–43.20)
27.56
26.63 (7.60–38.91)
29.77
28.03 (13.85–41.36)
19.50
19.25 (4.67–43.30)
10.28
11.11 (6.85–17.70)
CD16+56+
4.90
8.56 (0.94–21.86)
7.06
6.67 (1.39–12.00)
10.59
12.64 (2.83–33.04)
9.04
9.15 (3.75–20.00)
7.86
8.60 (2.43–16.18)
Relative size of lymphocytes subsets (%)
lymphocyte subset (CD3 T cell, CD3CD4 T helper cells, CD3CD8 cytotoxic T cells, CD19 B cells and CD16 and/or CD56 NK cells) including the median, mean and range are presented in Tables 2 and 2, respectively. The values provided in theses tables represent a 90 percent chance that 90 percent of healthy children will fall within this range.
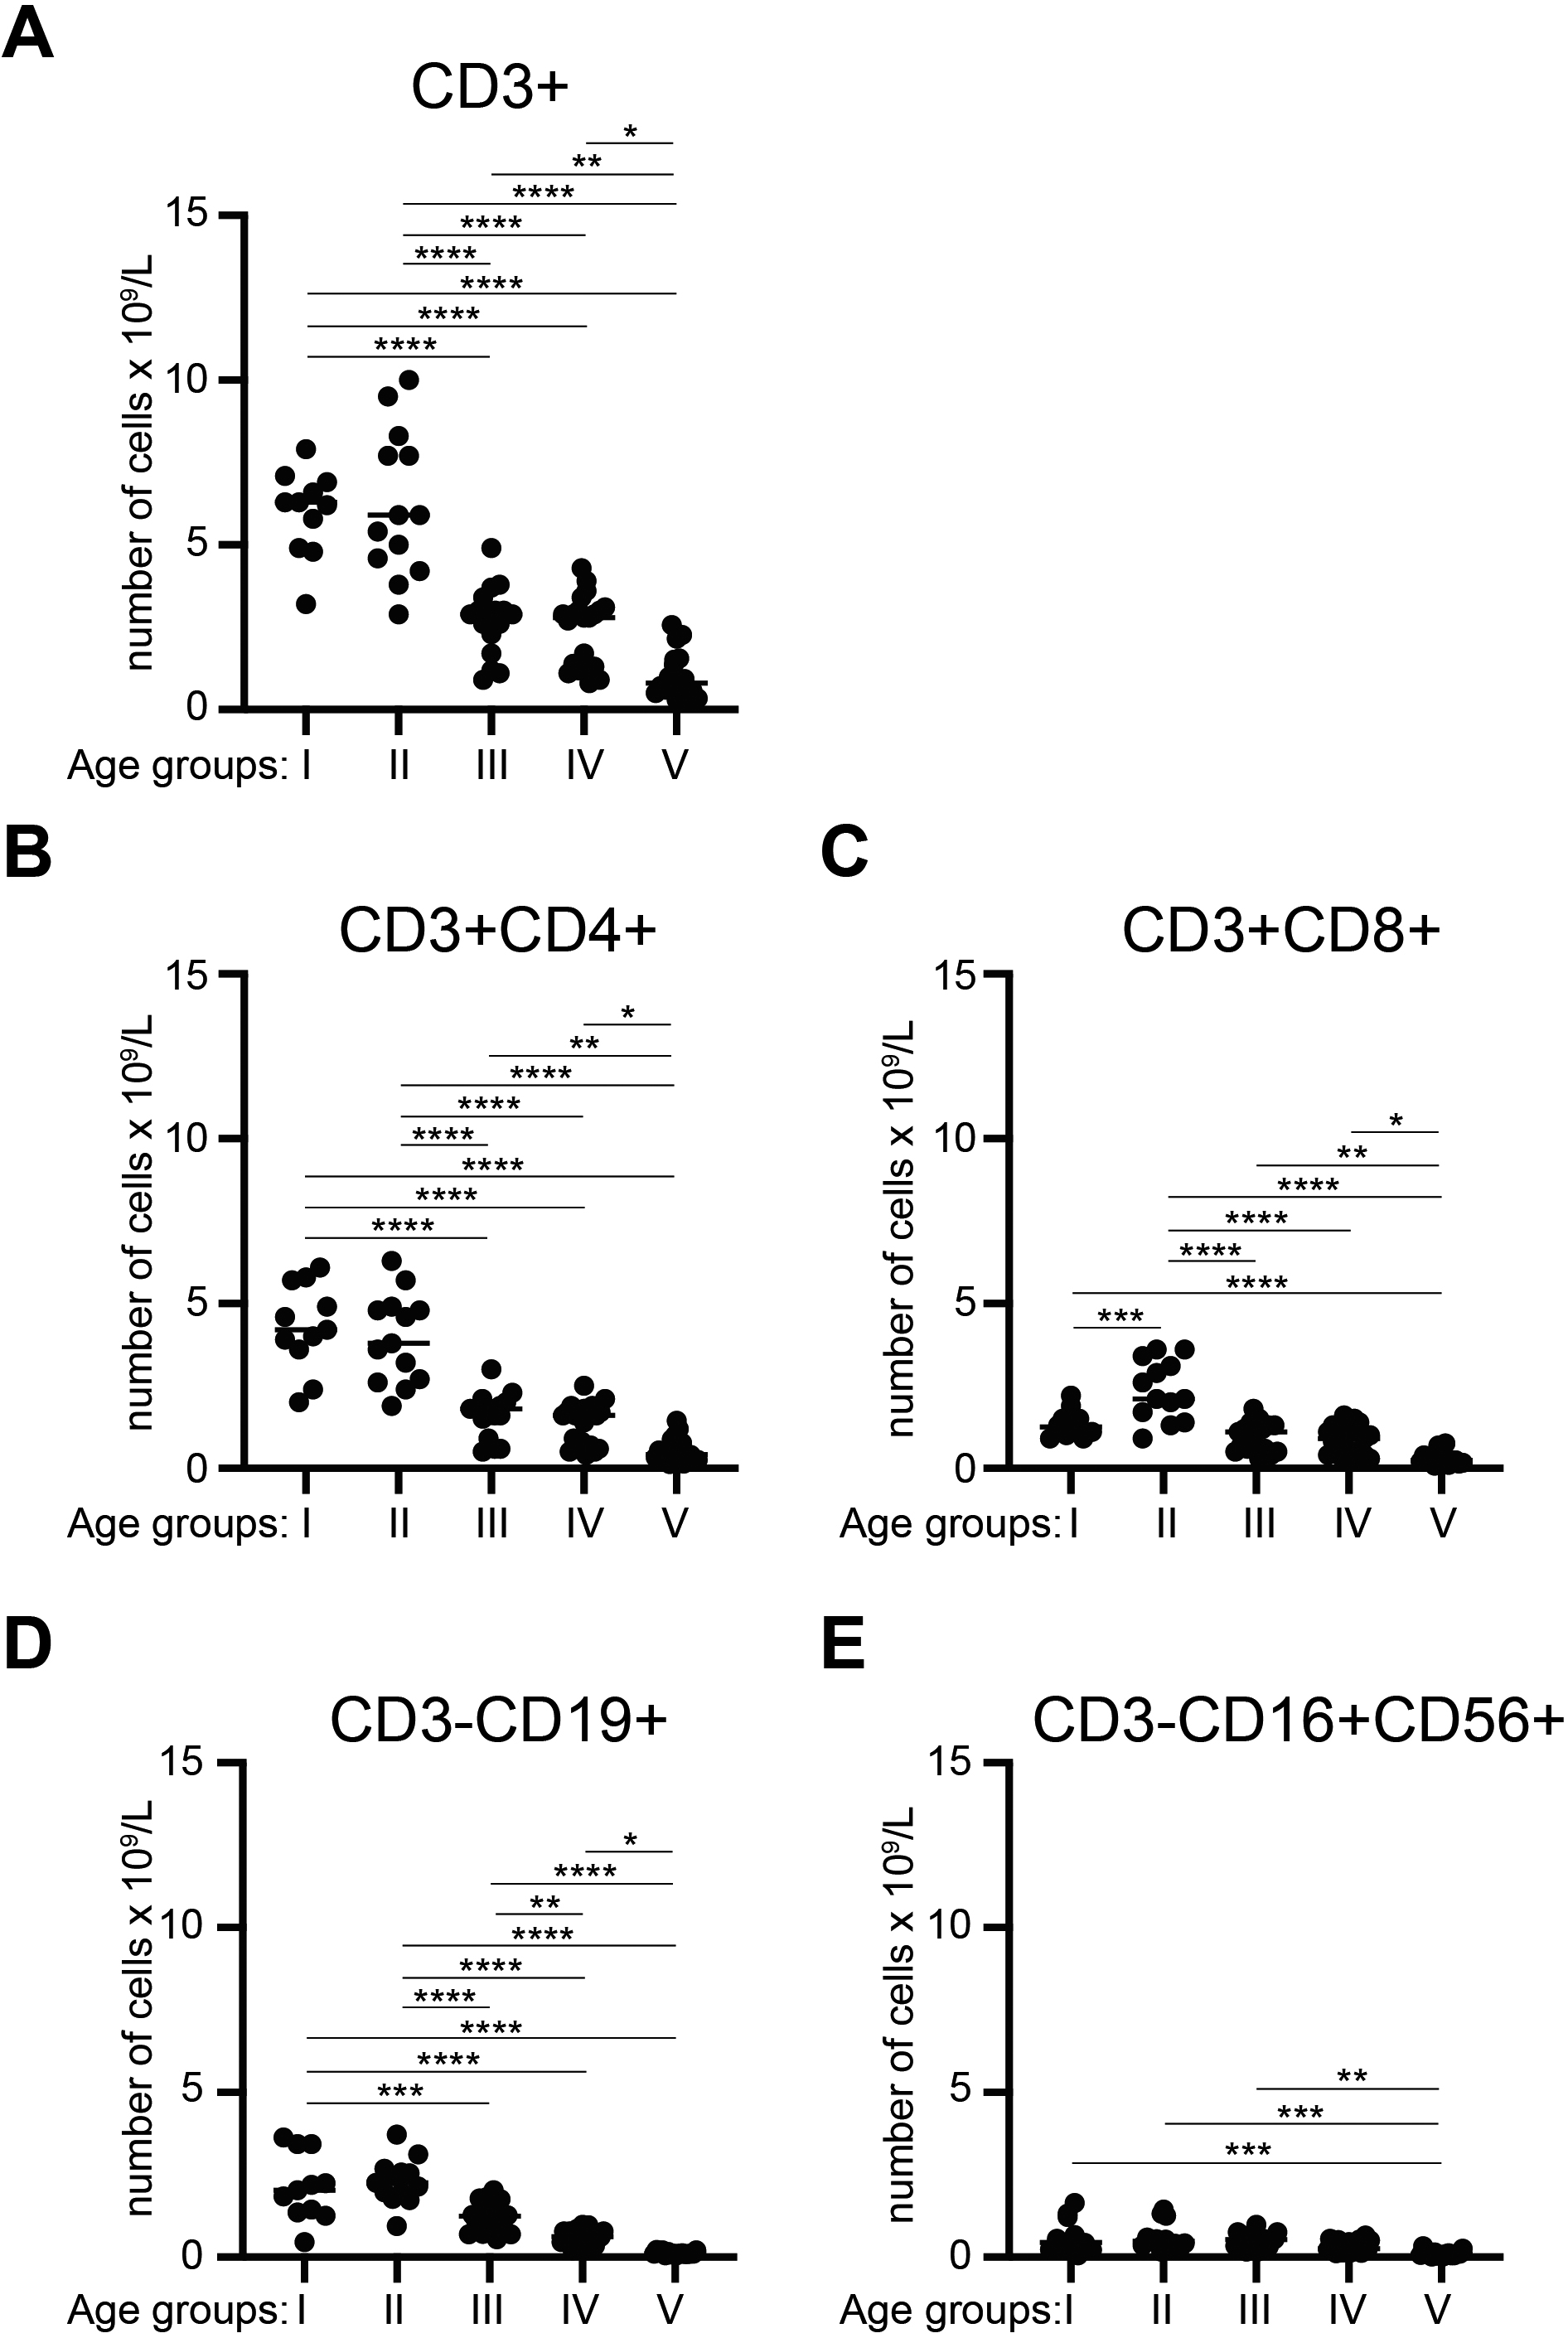
We also compared the changes in the numbers of lymphocytes and its subsets with age. Analyses of the changes in lymphocyte subpopulation numbers in peripheral blood with age showed no statistically significant differences in CD3 cells between group I and group II or between group III and group IV. Nevertheless, a significant age-associated reduction was observed when either group I or group II was compared to group III, group IV or group V and even when group III or group IV were compared to group V (Fig. 2A). Identical results were obtained for the CD3CD4 population (Fig. 2B). Numbers of CD3CD8 cells, showed a statistically significant increase of total numbers from group I to group II. However, there were no significant differences between groups I and III or between groups I and IV. Significant differences were again noted when group I was compared to group V. Group II was significantly different from groups III, IV and V. Groups III and IV also significantly differed with group V. These results indicate that CD3CD8 cell numbers temporarily rise between ages 1–2 years, before decreasing at ages more than 2 years (Fig. 2C). For CD19 B cells, we noted that except for between group I and group II, there were statistically significant differences. These results suggest that B cells decrease after age of 2 years (Fig. 2D). Finally, when NK cells number were compared across ages, we observed no significant differences between groups, except for group I versus group V, group II versus group V and group III versus group V. These results indicate that NK cell numbers decrease after 12 years age (Fig. 2E).
Number of indicated lymphocyte subsets in the blood of Moroccan donors as a function of age. Median and independent data for the number of indicated lymphocyte populations across donors with different ages (A)–(E). Groups represent samples from donors with different ages as following, Group I: 0 to 1 year ( 12), Group II: 1 to 2 years ( 13), Group III: 2 to 6 years ( 17), Group IV: 6 to 12 years ( 21) and Group V: 12 years ( 20). One-way ANOVA, only significant differences are shown. 0.05, 0.01, 0.001 and 0.0001.
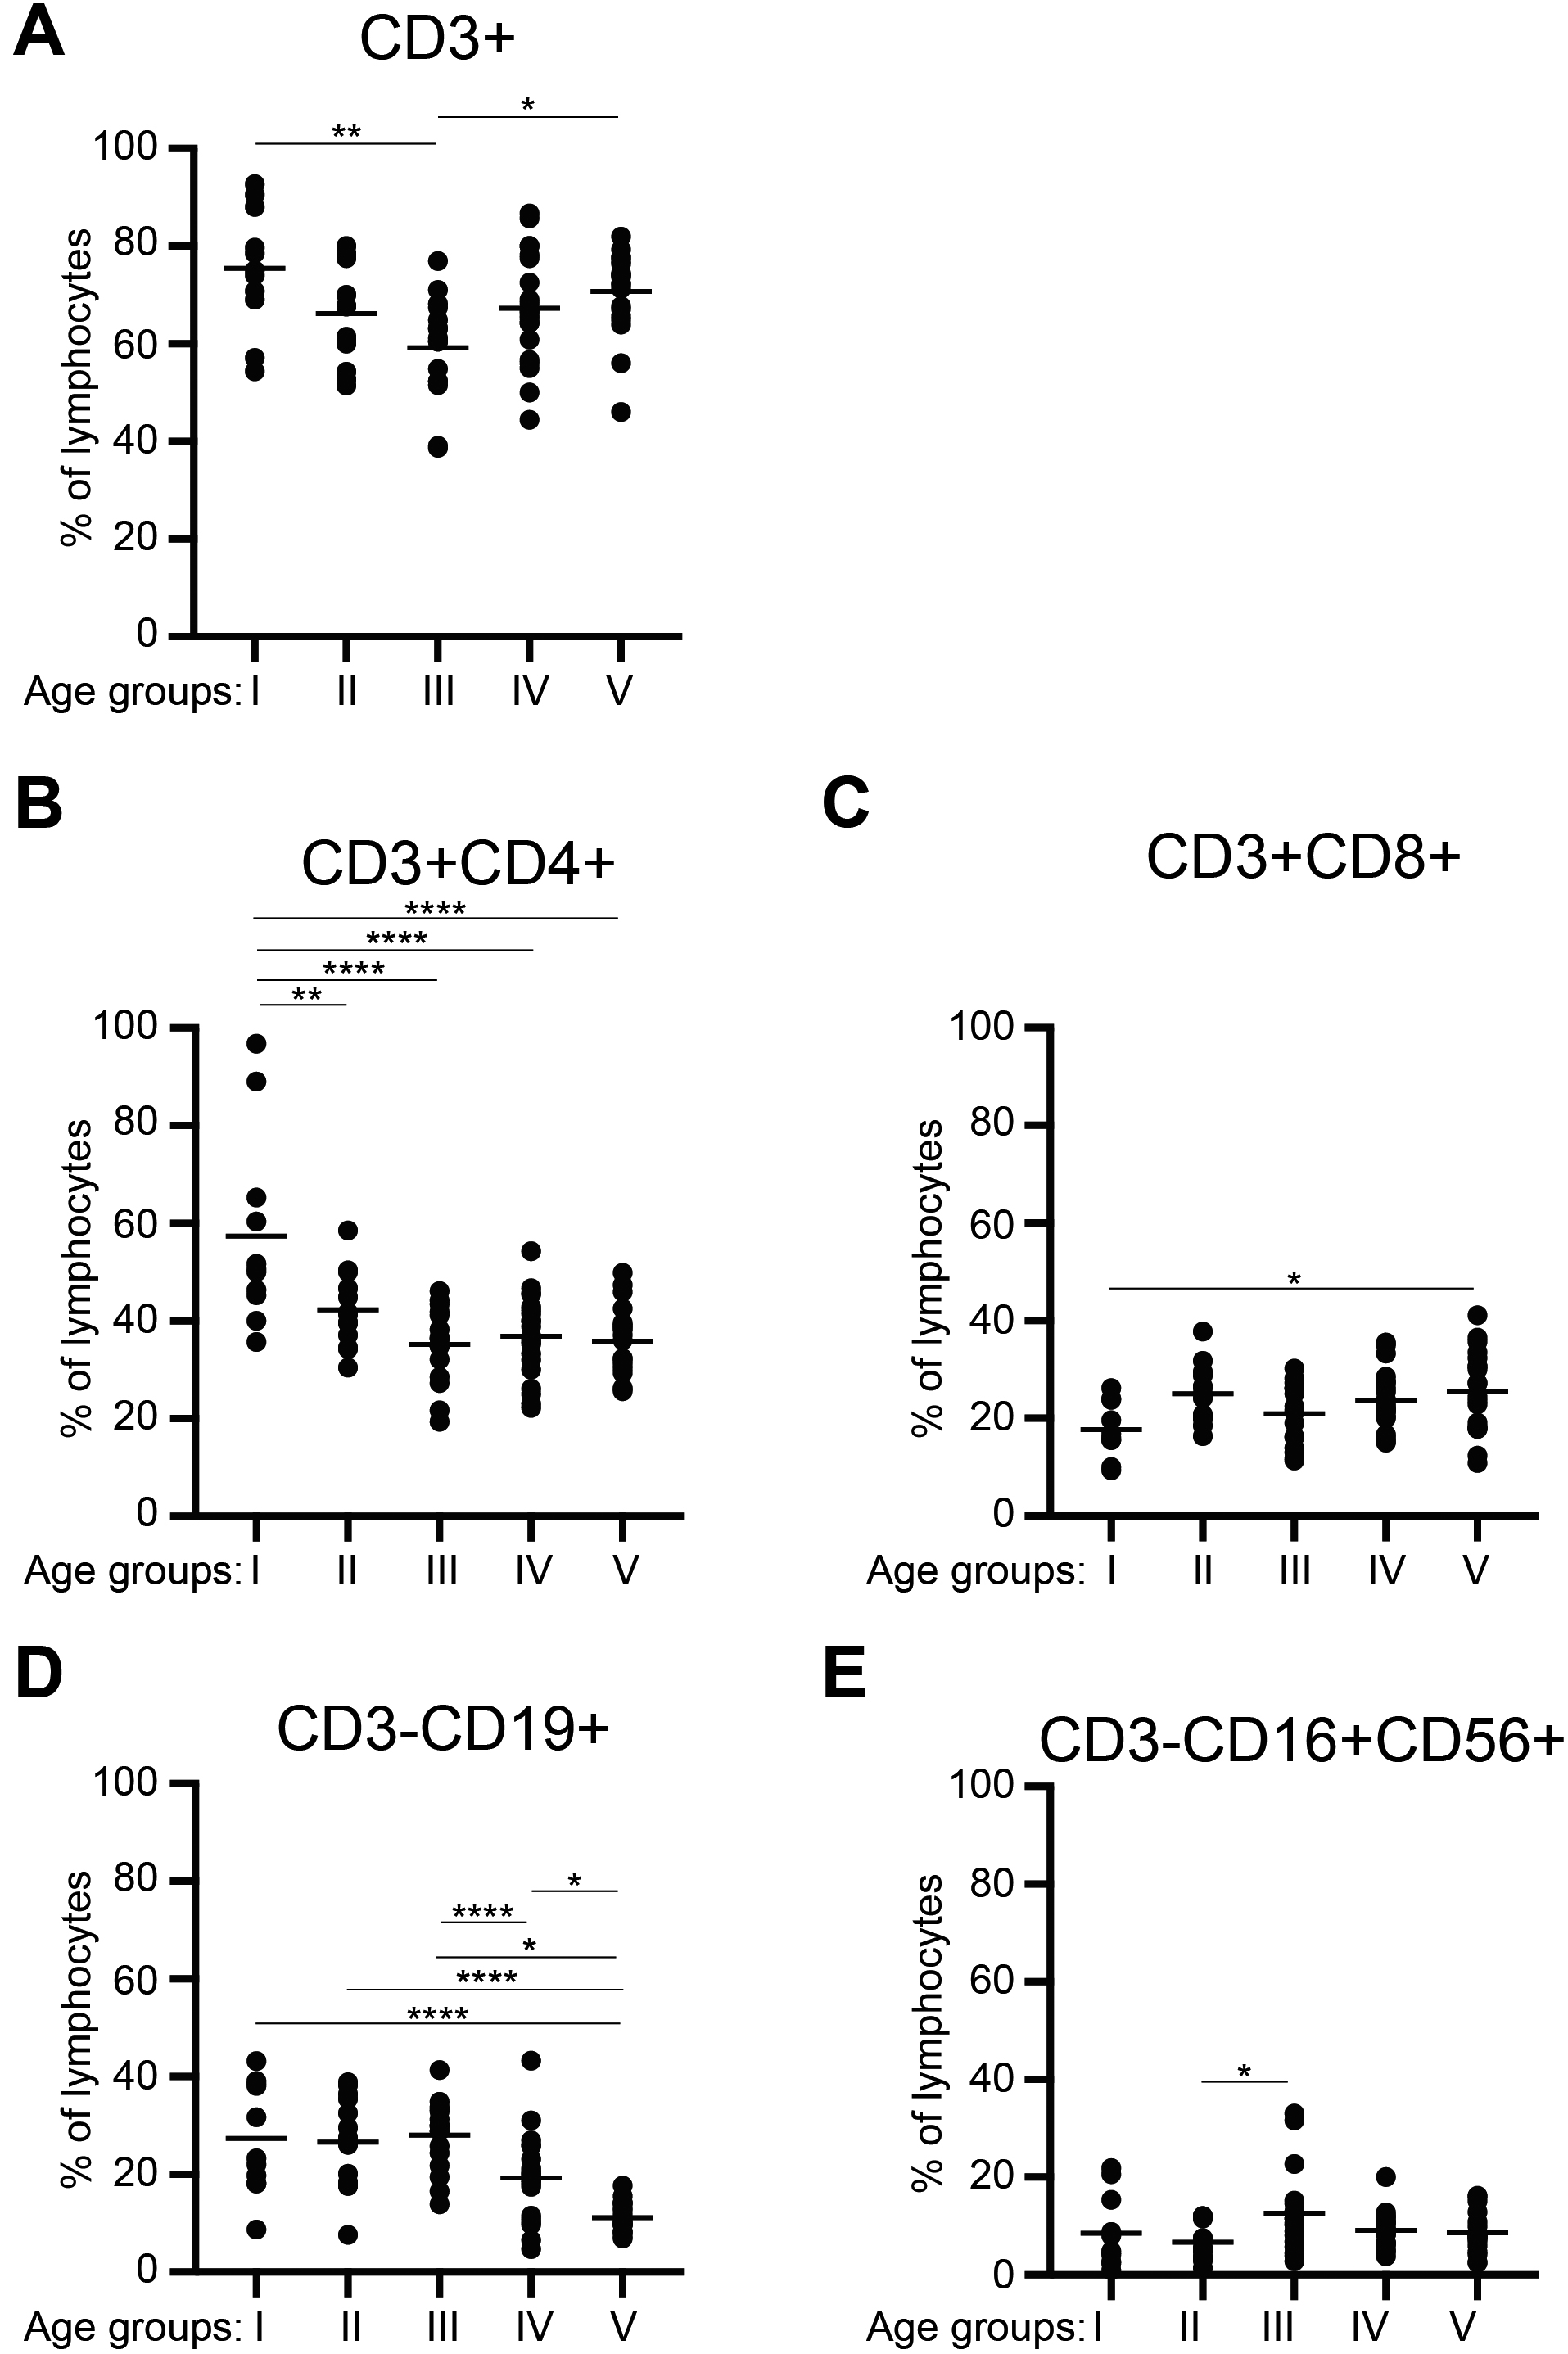
Percentage of indicated lymphocyte subsets in the blood of Moroccan donors as a function of age. Mean and independent data for the percentage of indicated lymphocyte populations within CD45 leukocytes across donors with different ages (A)–(F). Groups represent samples from donors with different ages as following, Group I: 0 to 1 year ( 12), Group II: 1 to 2 years ( 13), Group III: 2 to 6 years ( 17), Group IV: 6 to 12 years ( 21) and Group V: 12 years ( 20). One-way ANOVA, only significant differences are shown. 0.05, 0.01 and 0.0001.
Comparison between medians of the absolute count of lymphocyte subpopulation in different countries
Age groups (years)
Morocco (n 10/L)
Cameroon (n 10/L)
Turkey (n 10/L)
USA (n 10/L)
CD3
0–1
6.30
3.12
3.80
3.93
1–2
5.90
2.64
3.70
3.55
2–6
2.90
2.29
2.40
2.39
6–12
2.80
n. a
2.00
1.82
12
0.81
n. a
1.80
1.48
CD4
0–1
4.20
2.13
2.70
2.85
1–2
3.80
1.67
2.10
2.16
2–6
1.80
1.28
1.50
1.38
6–12
1.60
n. a
1.00
0.98
12
0.42
n. a
0.90
0.84
CD8
0–1
1.25
0.72
1.11
1.05
1–2
2.10
0.82
1.00
1.04
2–6
1.10
0.77
0.70
0.84
6–12
0.90
n. a
0.80
0.68
12
0.24
n. a
0.60
0.53
CD19
0–1
2.03
1.94
1.50
1.55
1–2
2.26
1.52
1.40
1.31
2–6
1.24
0.96
0.70
0.75
6–12
0.62
n. a
0.50
0.48
12
0.11
n. a
0.40
0.30
NK
0–1
0.44
0.45
0.70
0.42
1–2
0.48
0.39
0.50
0.36
2–6
0.53
0.33
0.30
0.30
6–12
0.26
n. a
0.50
0.23
12
0.095
n. a
0.40
0.19
Comparing changes in proportions of lymphocytes and lymphocyte subsets, we did not observe any significant difference in proportions of CD3 lymphocytes between different age groups except for a decrease from group I (0–1 year) to group III (2–6 years) (Fig. 3A). The proportions, however, significantly increased between group III (2–6 years) to group V (12 years-adult) (Fig. 3A). These results indicate that the proportion of lymphocytes dipped slightly at ages 2–6 years before increasing back to earlier levels. In contrast, proportions of CD3CD4 helper T lymphocytes were significantly different in group I from the rest of the groups (Fig. 3B). These results indicate that proportions of CD3CD4 helper T lymphocytes decreased between ages 0–1 years to 1–2 years. Subsequently, the proportions of this lymphocyte subpopulation did not change any further and remained constant. Relative amounts of CD3CD8 cytotoxic T lymphocytes did not appear to change with age except a significant increase in the 12 years-adult group (Fig. 3C). Examination of proportions of CD3CD19 B lymphocytes indicate significant differences between group I and group IV, as well as between group II and group V, group III with group IV and group V, and group IV with group V (Fig. 3D). These results indicate that there is a significant reduction in proportions of B cells around/after year 12. Proportions of NK cells showed no differences except for between group II and group III (Fig. 3E).
Finally, we compared our median reference values to that previously reported for studies performed in Cameroon, Turkey, USA and the Netherlands [9, 29, 31, 33]. We observed that the median value of CD3 lymphocytes, as well as CD4, CD8 and CD19 cells were higher in the Moroccan samples than the corresponding medians reported in the Cameroonian [29], Turkish [9] and USA [33] studies, especially in the age groups 0–1 years and 1–2 years (Table 3). For NK cells, the medians for the Moroccan population closely approximated that of Cameroon and USA at ages 0–1 years (Table 3). All three were lower than the Turkish population (Table 3). At 1–2 years the Moroccan population and the Turkish population were similar for median numbers of NK cells, and were higher than the Cameroonian and the USA populations (Table 3). At age 2–6 years, the Moroccan median was the highest amongst the four groups, but again by 6–12 years it dropped below that of Cameroon and Turkey to a level similar to that of USA (Table 3). However, all parameters (CD3, CD4, CD8, CD19, as well as NK cells) were lower in the Moroccan population in comparison with Cameroonian, Turkish and USA populations, after age 12 years (Table 3). We also compared the tolerance intervals between our values with a study from the Netherlands [31] -the only one study that explored tolerance intervals-. Out of 50 parameters (10 parameters each for 5 age groups), 16 parameters (32%) showed more than 57% difference (57% to 476%) in the means (Table 4). Noticeably, means of absolute counts and relative proportions of B cells were consistently higher in all age groups in Morocco (55–79%), except 12 years group (Table 4). The means of relative proportions of NK cells were higher in the Netherlands study across all age groups (Table 4). We observe also concordance of the means, 5 and 95 percentile values
Comparison between tolerance interval of lymphocyte subsets from Moroccan and Netherlands
Lymphocyte subsets
Age groups
Group I
Group II
Group III
Group IV
Group V
Mean
5
95
Mean
5
95
Mean
5
95
Mean
5
95
Mean
5
95
CD3 (total) [n 10/L]
Morocco
6.00
3.20
7.90
6.22
2.90
10.00
2.70
0.20
5.20
2.43
0.90
4.90
1.06
0.80
4.30
Netherlands (Schatorjé et al.)
4.00
1.40
11.50
2.50
0.70
8.80
1.90
0.85
4.30
1.80
0.77
4.00
1.50
0.78
3.00
d (1–2)%
33
56
46
60
76
12
30
325
17
26
14
18
42
3
30
CD3 (%)
Morocco
75.43
54.40
92.00
66.18
51.50
80.00
59.21
38.70
76.90
67.33
44.44
86.67
70.68
46.03
81.90
Netherlands (Schatorjé et al.)
68.00
49.00
95.00
60.00
36.00
100.00
69.00
52.00
92.00
73.00
55.00
97.00
67.00
50.00
91.00
d (1–2)%
10
10
3
9
30
25
17
34
20
8
24
12
5
9
11
CD4 (total) [n 10/L]
Morocco
4.30
2.00
6.10
3.94
1.90
6.30
1.61
0.50
2.10
1.34
0.80
2.10
0.53
0.13
1.45
Netherlands (Schatorjé et al.)
2.70
1.00
7.20
1.60
0.40
7.20
1.10
0.50
2.70
1.00
0.40
2.50
1.00
0.50
2.00
d (1–2)%
37
50
18
59
79
14
32
0
29
25
50
19
89
285
38
CD4 (%)
Morocco
57.39
35.70
96.80
42.27
30.48
58.54
35.20
19.35
46.15
36.84
22.22
54.29
35.91
25.64
49.88
Netherlands (Schatorjé et al.)
46.00
25.00
86.00
39.00
16.00
91.00
40.00
25.00
66.00
40.00
26.00
61.00
42.00
28.00
64.00
d (1–2)%
20
30
11
8
48
55
14
29
43
9
17
12
17
9
28
CD8 (total) [n 10/L]
Morocco
1.35
0.90
2.20
2.40
0.90
3.60
0.95
0.30
1.80
0.87
0.30
1.60
0.31
0.08
0.75
Netherlands (Schatorjé et al.)
1.10
0.20
5.40
0.70
0.20
2.80
0.60
0.20
1.80
0.60
0.20
1.70
0.50
0.20
1.20
d (1–2)%
18.52
77.78
145.45
70.83
77.78
22.22
36.84
33.33
0.00
31.03
33.33
6.25
61.29
150.00
60.00
CD8 (%)
Morocco
17.69
9.40
26.20
25.05
16.36
37.80
20.95
11.36
30.23
23.71
15.00
35.56
25.50
10.90
41.12
Netherlands (Schatorjé et al.)
16.00
6.00
41.00
16.00
7.00
40.00
21.00
9.00
49.00
25.00
13.00
47.00
22.00
12.00
40.00
d (1–2)%
10
36
56
36
57
6
0
21
62
5
13
32
14
10
3
B cells (total) [n 10/L]
Morocco
2.12
0.46
3.63
2.29
0.95
3.72
1.23
0.54
2.03
0.61
0.21
0.98
0.12
0.05
0.22
Netherlands (Schatorjé et al.)
0.94
0.11
7.70
0.76
0.16
3.70
0.49
0.18
1.30
0.29
0.10
0.80
0.23
0.06
0.82
d (1–2)%
55.66
76.09
112.12
66.81
83.16
0.54
60.16
66.67
35.96
52.46
52.38
18.37
91.67
39.13
272.73
B cells (%)
Morocco
27.34
8.70
43.20
26.63
7.60
38.91
28.03
13.85
41.36
19.25
4.67
43.30
11.11
6.85
17.70
Netherlands (Schatorjé et al.)
7.00
1.00
64.00
11.00
1.00
96.00
6.00
2.00
25.00
8.00
2.00
31.00
15.00
5.00
49.00
d (1–2)%
74
89
48
59
87
147
79
86
40
58
57
28
35
27
177
NK cells (total) [n 10/L]
Morocco
0.64
0.05
1.64
0.62
0.17
1.44
0.48
0.17
0.98
0.33
0.12
0.65
0.11
0.02
0.33
Netherlands (Schatorjé et al.)
0.52
0.07
3.90
0.47
0.06
4.00
0.18
0.06
0.51
0.20
0.07
0.59
0.34
0.10
1.20
d (1–2)%
19
36
138
24
68
178
63
64
48
39
42
9
209
456
264
NK cells (%)
Morocco
8.56
0.94
21.86
6.67
1.39
12.00
12.60
2.83
33.04
9.15
3.75
20.00
8.60
2.43
16.18
Netherlands (Schatorjé et al.)
15.00
3.00
77.00
19.00
8.00
45.00
18.00
8.00
39.00
12.00
4.00
33.00
10.00
4.00
28.00
d (1–2)%
75
219
252
185
476
275
43
183
18
31
7
65
16
65
73
between the two populations for relative proportions of CD3, CD4 and CD8 as well as absolute counts of CD4 (Table 4).
Discussions
The reference values of peripheral blood lymphocyte subsets were determined by flow cytometry immunophenotyping to aid in the diagnosis of the various immunological defects and dysfunction such as HIV infections [11, 39] or PID [12, 25, 26] in the Moroccan population. Paediatric HIV patients have reduced CD4 counts [1]. Untreated HIV causes progressive CD4 loss [6]. PID encompasses heterogenous, mostly inherited disorders that affect the development, function or both of several lymphocyte subsets [25]. For example, in PID, mutations may result in the loss of expression of markers such as CD19 [37]. Additionally, PID can be caused by mutations in genes, that affect the terminal differentiation of a specific lineage of lymphocytes, such as mutations in BTK that leads to the near complete loss of B cells [5, 15]. Such changes can be revealed by flow cytometric analyses and careful comparison with reference values. Individuals affected by HIV can develop immunological diseases, infections and oncological complications, as well as several other common morbidities. PID patients are high susceptible to routine and/or recurrent infections of a variety of organs including the skin, throat, ears, lungs, urinary or intestinal tracts [20]. These patients are also at a higher risk of failing to clear the infections or unusually severe degree of infection. An early diagnosis of HIV or PID by flow cytometry and comparison with reference values is critical for preventing dangerous disease-associated morbidity and mortality [20].
Since lymphocyte numbers and subsets are known to vary regionally, in a previous study our group established lymphocyte reference values for the adult Moroccan population [30]. In this study we established lymphocyte reference values for the children Moroccan population at ages 0–1 years, 1–2 years, 2–6 years, 6–12 years and 12 years. Results of lymphocytes immunophenotyping with flow cytometry can be influenced by many variables such as the anticoagulant used, sample preparation, monoclonal antibodies used, selected staining protocol and technical platform. In this study, samples were treated according to the single platform method-lyse no-wash procedure and the gating strategy recommended by the manufacturer. Eighty-three individuals were carefully selected, to meet the standards of healthy subjects. Our results demonstrate that the CD8 T cell numbers increased after early infancy [16]. This may result from increased antigen exposure in the first months of life. The decreasing total numbers of T and B cells at adult age observed in our studies is also consistent with previous reports [4, 9, 32, 38]. NK cell numbers, in contrast, appear to be stable from 0–1 year till 6–12 years, similar to that reported by Ikinciogullari et al. [9]. In contrast to total numbers, the percentage values of lymphocyte subsets did not change substantially with age. This result confirms previous reports that change in absolute count of lymphocytes are not consistent with the changes in their percentages [4].
Importantly, we observed increased median values of CD3 and CD4 cells at 0–1 years and 1–2 years of age in Moroccan population compared to that of Cameroon, Turkey and the USA [9, 29, 33]. These differences may be due to different antigen exposure. It has been reported that children who encounter more antigens in their environment present with a higher count of lymphocytes [24]. Alternatively, environmental factors, genetics and/or nutritional status may contribute to these differences [2, 16, 27, 34, 36].
Conclusion
Our study quantifies the changing counts and percentages of lymphocytes subpopulation in healthy Moroccan children from birth to adulthood. These reference values should be useful for Moroccan laboratories for the correct interpretation of lymphocytes immunophenotyping in the diagnosis of HIV, PID and other diseases characterized by lymphocytosis or lymphocytopenia in pediatric patients.
Footnotes
Acknowledgments
The authors thank the personnel of the Immunology, Allergic and Respiratory Diseases Unit, Children’s Hospital of Rabat for their participation in the recruitment of study subjects and sample collections. We also thank Lindsey D. Hughes, Carla V. Rothlin and Sourav Ghosh for their help during preparation of the manuscript.
References
1.
BerhanY., Age and CD4 count of vertically HIV-infected children at the time of diagnosis: what are independent predictors for being symptomatic and CD4 counts drop? J Trop Pediatr57 (2011), 14–23.
2.
BloomfieldS.F.Stanwell-SmithR.CrevelR.W. and PickupJ., Too clean, or not too clean: the hygiene hypothesis and home hygiene, Clin Exp Allergy36 (2006), 402–425.
3.
ChenY.ZhangY.ZhaoG.ChenC.YangP.YeS. and TanX., Difference in leukocyte composition between women before and after menopausal age, and distinct sexual dimorphism, PLoS One11 (2016), e0162953.
4.
Comans-BitterW.M.de GrootR.van den BeemdR.NeijensH.J.HopW.C.GroeneveldK.HooijkaasH. and van DongenJ.J., Immunophenotyping of blood lymphocytes in childhood. Reference values for lymphocyte subpopulations, J Pediatr130 (1997), 388–393.
5.
CookM.C. and TangyeS.G., Primary immune deficiencies affecting lymphocyte differentiation: lessons from the spectrum of resulting infections, Int Immunol21 (2009), 1003–1011.
6.
DeeksS.G.OverbaughJ.PhillipsA. and BuchbinderS., HIV infection, Nat Rev Dis Primers1 (2015), 15035.
7.
DuramadP.TagerI.B. and HollandN.T., Cytokines and other immunological biomarkers in children’s environmental health studies, Toxicol Lett172 (2007), 48–59.
8.
EckschlagerT., Lymphocyte count as a prognostic factor in childhood cancer, Pediatr Hematol Oncol9 (1992), 99–105.
9.
IkinciogullariA.KendirliT.DoguF.EginY.ReisliI.CinS. and BabacanE., Peripheral blood lymphocyte subsets in healthy Turkish children, Turk J Pediatr46 (2004), 125–130.
10.
JiaoY.QiuZ.XieJ.LiD. and LiT., Reference ranges and age-related changes of peripheral blood lymphocyte subsets in Chinese healthy adults, Sci China C Life Sci52 (2009), 643–650.
11.
KakarA.BeriR.GogiaA.ByotraS.P.PrakashV.KumarS. and BhargavaM., Absolute lymphocyte count: a cost-effective method of monitoring HIV-infected individuals, Indian J Pathol Microbiol54 (2011), 107–111.
12.
KaneganeH.HoshinoA.OkanoT.YasumiT.WadaT.TakadaH.OkadaS.YamashitaM.YehT.W.NishikomoriR.TakagiM.ImaiK.OchsH.D. and MorioT., Flow cytometry-based diagnosis of primary immunodeficiency diseases, Allergol Int67 (2018), 43–54.
13.
KaushanskyK., Williams hematology, McGraw-Hill, New York, 2016.
14.
KibayaR.S.BautistaC.T.SaweF.K.ShafferD.N.SaterenW.B.ScottP.T.MichaelN.L.RobbM.L.BirxD.L. and de SouzaM.S., Reference ranges for the clinical laboratory derived from a rural population in Kericho, Kenya, PLoS One3 (2008), e3327.
15.
KopeckyO. and LukesovaS., Genetic defects in common variable immunodeficiency, Int J Immunogenet34 (2007), 225–229.
16.
LisseI.M.AabyP.WhittleH.JensenH.EngelmannM. and ChristensenL.B., T-lymphocyte subsets in west african children: impact of age, sex, and season, J Pediatr130 (1997), 77–85.
17.
LockeB.A.DasuT. and VerbskyJ.W., Laboratory diagnosis of primary immunodeficiencies, Clin Rev Allergy Immunol46 (2014), 154–168.
18.
LugadaE.S.MerminJ.KaharuzaF.UlvestadE.WereW.LangelandN.AsjoB.MalambaS. and DowningR., Population-based hematologic and immunologic reference values for a healthy Ugandan population, Clin Diagn Lab Immunol11 (2004), 29–34.
19.
McCoyJ.P., Jr. and OvertonW.R., Quality control in flow cytometry for diagnostic pathology: II. A conspectus of reference ranges for lymphocyte immunophenotyping, Cytometry18 (1994), 129–139.
McGrathC.R.HitchcockD.C. and van AssendelftO.W., Total white blood cell counts for persons ages 1–74 years with differential leukocyte counts for adults ages 25–74 years: United States, 1971–75, Vital Health Stat11 (1982), 1–36.
23.
MeekerW.Q.HahnG.J. and EscobarL.A., Statistical intervals: a guide for practitioners and researchers, Wiley, Hoboken, New Jersey, 2017.
24.
Moraes-PintoM.I.OnoE.Santos-ValenteE.C.AlmeidaL.C.AndradeP.R.DinelliM.I.SantosA.M. and SalomaoR., Lymphocyte subsets in human immunodeficiency virus-unexposed Brazilian individuals from birth to adulthood, Mem Inst Oswaldo Cruz109 (2014), 989–998.
O’GormanM.R.ZollettJ. and BensenN., Flow cytometry assays in primary immunodeficiency diseases, Methods Mol Biol699 (2011), 317–335.
27.
OzkanH.OlgunN.SasmazE.AbaciogluH.OkuyanM. and CevikN., Nutrition, immunity and infections: T lymphocyte subpopulations in protein-energy malnutrition, J Trop Pediatr39 (1993), 257–260.
28.
RouetF.InwoleyA.EkoueviD.K.VihoI.BecquetR.SakarovitchC.BequetL.Tonwe-GoldB.ChaixM.L.LeroyV.RouziouxC.DabisF. and GroupA.D.P.S., CD4 percentages and total lymphocyte counts as early surrogate markers for pediatric HIV-1 infection in resource-limited settings, J Trop Pediatr52 (2006), 346–354.
29.
SagniaB.Ateba NdongoF.Ndiang Moyo TetangS.Ndongo TorimiroJ.CairoC.DomkamI.AgborG.MveE.TockeO.FoudaE.Ouwe Missi Oukem-BoyerO. and ColizziV., Reference values of lymphocyte subsets in healthy, HIV-negative children in Cameroon, Clin Vaccine Immunol18 (2011), 790–795.
SchatorjeE.J.GemenE.F.DriessenG.J.LeuveninkJ.van HoutR.W. and de VriesE., Paediatric reference values for the peripheral T cell compartment, Scand J Immunol75 (2012), 436–444.
32.
ShahabuddinS.Al-AyedI.Gad El-RabM.O. and QureshiM.I., Age-related changes in blood lymphocyte subsets of Saudi Arabian healthy children, Clin Diagn Lab Immunol5 (1998), 632–635.
33.
ShearerW.T.RosenblattH.M.GelmanR.S.OyomopitoR.PlaegerS.StiehmE.R.WaraD.W.DouglasS.D.LuzuriagaK.McFarlandE.J.YogevR.RathoreM.H.LevyW.GrahamB.L.SpectorS.A. and PediatricA.C.T.G., Lymphocyte subsets in healthy children from birth through 18 years of age: the Pediatric AIDS Clinical Trials Group P1009 study, J Allergy Clin Immunol112 (2003), 973–980.
34.
StrachanD.P., Hay fever, hygiene, and household size, BMJ299 (1989), 1259–1260.
35.
TosatoF.BucciolG.PantanoG.PuttiM.C.SanzariM.C.BassoG. and PlebaniM., Lymphocytes subsets reference values in childhood, Cytometry A87 (2015), 81–85.
36.
UlijaszekS.J., Immunology and growth faltering of Anga children, Papua New Guinea: preliminary work, Am J Phys Anthropol106 (1998), 515–520.
37.
WentinkM.W.LambeckA.J.van ZelmM.C.SimonsE.van DongenJ.J.HI.J.ScholvinckE.H. and van der BurgM., CD21 and CD19 deficiency: two defects in the same complex leading to different disease modalities, Clin Immunol161 (2015), 120–127.
38.
WienerD.ShahS.MaloneJ.LowellN.LowittS. and RowlandsD.T., Jr., Multiparametric analysis of peripheral blood in the normal pediatric population by flow cytometry, J Clin Lab Anal4 (1990), 175–179.
39.
WondimenehY.FeredeG.YismawG. and MuluyeD., Total lymphocyte count as surrogate marker for CD4 cell count in HIV-infected individuals in gondar university hospital, northwest ethiopia, AIDS Res Ther9 (2012), 21.
40.
WongW.S.LoA.W.SiuL.P.LeungJ.N.TuS.P.TaiS.W.LamS.C. and WongK.F., Reference ranges for lymphocyte subsets among healthy Hong Kong Chinese adults by single-platform flow cytometry, Clin Vaccine Immunol20 (2013), 602–606.