
Abstract
BACKGROUND:
In patients with COVID-19, diabetes mellitus type 2 (T2DM) increases the risk of hospitalization and death. Patients who have IL-6 and IL-17A single nucleotide polymorphisms (SNPs) are more likely to have severe COVID-19. This study aims to determine whether SNPs of the IL-6 gene at rs1800795 (G
PATIENTS AND METHODS:
Twenty-four people were divided into 4 groups as follows: six patients with severe COVID-19 and T2DM were placed in Group 1 as “G1”, six patients with COVID-19 but no T2DM were placed in Group 2 as “G2”, and six patients with T2DM were placed in Group 3 as “G3”. There were also six healthy controls included in each group. Polymerase chain reaction (PCR) was used to amplify the target genes after genomic DNA from the blood samples was extracted. Sanger sequencing was used to find the SNPs in both the forward and reverse directions for each sample.
RESULTS:
In the case of IL-6 SNP at rs1800795, the GG genotype was more common in “G3”, the CC genotype was less common in all patient groups than in controls, and the GC allele was more common in “G2” than in the control group. In comparison to the controls, the three patient groups showed lower frequencies of the C allele and higher frequencies of the G allele. Regarding IL-17A gene polymorphism, the AA and GA genotypes were more prevalent in “G2” and “G3”, respectively. The GG genotype and G allele frequency dropped in all patient groups compared to the control group, whereas the A allele frequency increased in all patient groups.
CONCLUSIONS:
The IL-6 gene at rs1800795 (G/C) and the IL-17A gene at rs2275913 (G/A) loci were associated with COVID-19 and T2DM in Iraqi population.
Introduction
Coronavirus disease 2019 (COVID-19) is a highly contagious viral illness with pneumonia-like symptoms that is brought on by the severe respiratory syndrome coronavirus 2 (SARS-CoV-2). In a short period of time after patients started exhibiting symptoms resembling those of the SARS outbreak, the cause was identified as a new strain of the coronavirus family known as 2019nCoV. On February 11th, 2020, the International Committee on Taxonomy of Viruses (ICTV) changed the designation to “SARS-CoV2” [1].
Globally, type 2 diabetes mellitus (T2DM) is a problem for public health. Since insufficient insulin secretion from the pancreas does not react to target cell receptors for glucose molecules, the condition is frequently accompanied with elevated blood glucose levels [2].
Patients who have COVID-19 are at risk for poor clinical outcomes if they have diabetes mellitus(DM) [3]. The epidemic of COVID-19 has had a significant impact on diabetic patients’ ability to control their blood glucose levels. Patients who have COVID-19 experience severe metabolic alterations and blood glucose increases. Enhanced cytokine release and other inflammatory mediators are linked to it, leading to hyperglycemia and enhanced insulin resistance [4]. Additionally, COVID-19 may be contributing to the rise in acute DM by targeting the Angiotensin-Converting Enzyme 2 (ACE2) receptors in the pancreatic islets, which result in pancreatic dysfunction [5].
DM was the second most common chronic comorbidity in COVID-19 after hypertension. Patients with diabetes are more likely to die and experience severe COVID-19. Interleukin-6 (IL-6), C-reactive protein (CRP), ferritin, and D-dimer levels are much higher in diabetes patients than in non-diabetic individuals, indicating that an evident inflammatory cytokine storm is associated with a more dire prognosis [6].
A variety of pathological circumstances, such as infection and inflammation, trigger the secretion of IL-6 from mast cells, dendritic cells, and macrophages. In addition, in response to particular stimuli, fibroblasts, endothelial cells, and epithelial cells all express IL-6. The main mediator of an uncontrolled pro-inflammatory response that has been linked to lung injury in those with severe COVID is IL-6 [7]. Numerous investigations [8, 9, 10] have shown a clear correlation between elevated IL-6 levels and the extreme severity of COVID-19.
Interleukin-17A (IL-17A) appears to play a significant role in extreme COVID-19 pathogenesis [11]. This interleukin is a proinflammatory cytokine, produced by T helper 17(Th17) cells. Lung damage is found in serious COVID-19 patients due to an inflammation characterized by strong cell responses to Th17 [12].
Patients are more likely to develop severe type of COVID-19 due to cytokines and SNPs such as the IL-6 and IL-17A gene polymorphism. These changes mostly affect gene expression and cause immune cells to react severely by taking part in a cytokine storm [13].
This study sought to explore the association of two SNPs of the IL-6 gene at rs1800795 G
Materials and methods
Patient groups and sample collection
Four groups were used to determine the case-control research. Six severely ill patients with COVID-19 and T2DM made up the first group “G1”, six patients with COVID-19 only made up the second group “G2”, six T2DM patients made up the third group “G3”, and six healthy volunteers made up the fourth group, which served as the healthy control group. In the recommended transitory hospital for COVID-19, Ibn-Al Khateeb Hospital in Baghdad, the patients were admitted. The specialist made a diagnosis of T2DM, and infections with COVID-19 were identified by PCR, CT scan; furthermore, the infection was confirmed by IgG and IgM levels investigation by fluorescence immuno-assay (FIA).
For all the study groups, results from the FBS and HbA1C tests were found by biochemistry automated device (Beckman Coulter AU480, USA). Six participants from each set of 24 participants had their veins pricked for five milliliters of blood, which was drawn with disposable syringes in an aseptic environment. 3 ml blood was drawn in a gel tube (Sail, China) and put in a centrifuge (Kokusan, Japan) to yield serum for chemical and immunological investigations. About 2 ml of venous blood was drawn in an ethylenediaminetetraacetic acid (EDTA) tube and stored at
Anti-SARS-CoV-2 IgG/IgM determination
Principle of the method
Sandwich immune-detection method is used in this test; fluorescence-labeled conjugates bind to antibodies in a human sample, forming antibody-antigen (Ab-Ag) complexes that migrate onto the intracellular matrix and captured by other immobilized anti-human IgG and anti-human IgM on a test strip. More antibodies in the serum sample form more antigen-antibody complexes which cause stronger fluorescence signal by (detector) antigen. This signal is processed by i chroma II device (Boditech, Korea) to display the anti-SARS-CoV-2 IgG and IgM concentration of the test sample [14, 15].
Kit components
Test cartridges: The cartridge part contains a membrane called a test strip, which has anti-human IgM, anti-human IgG, and chicken IgY. Detectors: The detector contains a granule of viral antigen-fluorescence conjugate, anti-chicken IgY-fluorescence conjugate, sodium azide as a preservative, and bovine serum albumin (BSA) as a stabilizer. Detector diluent: contains salt, detergent, and sodium azide in Tris buffer. Identification (ID) chip.
To prepare the detection buffer, 150 Ten microliters of human serum were added into detector tube immediately with shaking 10 times or more. Sample mixture of 75 The cartridge was left at room temperature for 10 minutes and inserted into the holder. After tapping the start button, the device calculated the test results automatically and displayed positive (
The DNA from the blood samples was extracted using a DNA extraction kit (Geneaid, Taiwan). The extraction steps are conferred by the company’s instruction.
Assessment of DNA concentration and purity
Using a Nano-spectrophotometer (Biodrop, UK), the concentration and purity of the DNA were evaluated. The DNA concentration was stated as ng/
Agarose gel electrophoresis
After extraction, agarose powder (Carl Roth, Germany) was dissolved in 100 ml of 1X TBE buffer (Intron, Korea) in a flask (1% agarose for genomic DNA was used; while for PCR product, 1.5% agarose was used). Agarose powder was dissolved by boiling by water bath (Julabo, Germany) for 2 minutes until the solution became clear. Agarose solution was allowed to cool to 50–55 Three microliter of red stain (Intron, Korea) was added to the warm gel. Combs was fixed in the tray of gel-casting. Agarose solution was poured into the gel-casting tray slowly to prevent the formation of air bubbles. Agarose solution was left to solidify at room temperature for 30 minutes. Carefully, the combs was pulled out and the tape was removed. The gel was transferred into an electrophoresis chamber and then covered with the 1X TBE buffer. DNA loading dye (3 Electrophoresis (Clarivate, Japan) of agarose gel was carried out at 70 V and 65 Amp for 60 minutes. The DNA bands were observed under a UV transilluminator (Scope-21, Japan). Figure 1 showed the optimization for the first 15 DNA samples [17]. The correct sizes of the DNA fragments were compared versus a 100bp ladder marker (Promega, USA) as shown in Fig. 2.
Bands of genomic DNA extracted from human blood samples; Lanes 1–15 resemble the number of DNA samples; C: Control.
Results of amplification of IL-6 and IL-17A gene of blood samples were fractionated on 1.5% agarose gel stained with Red Safe. M 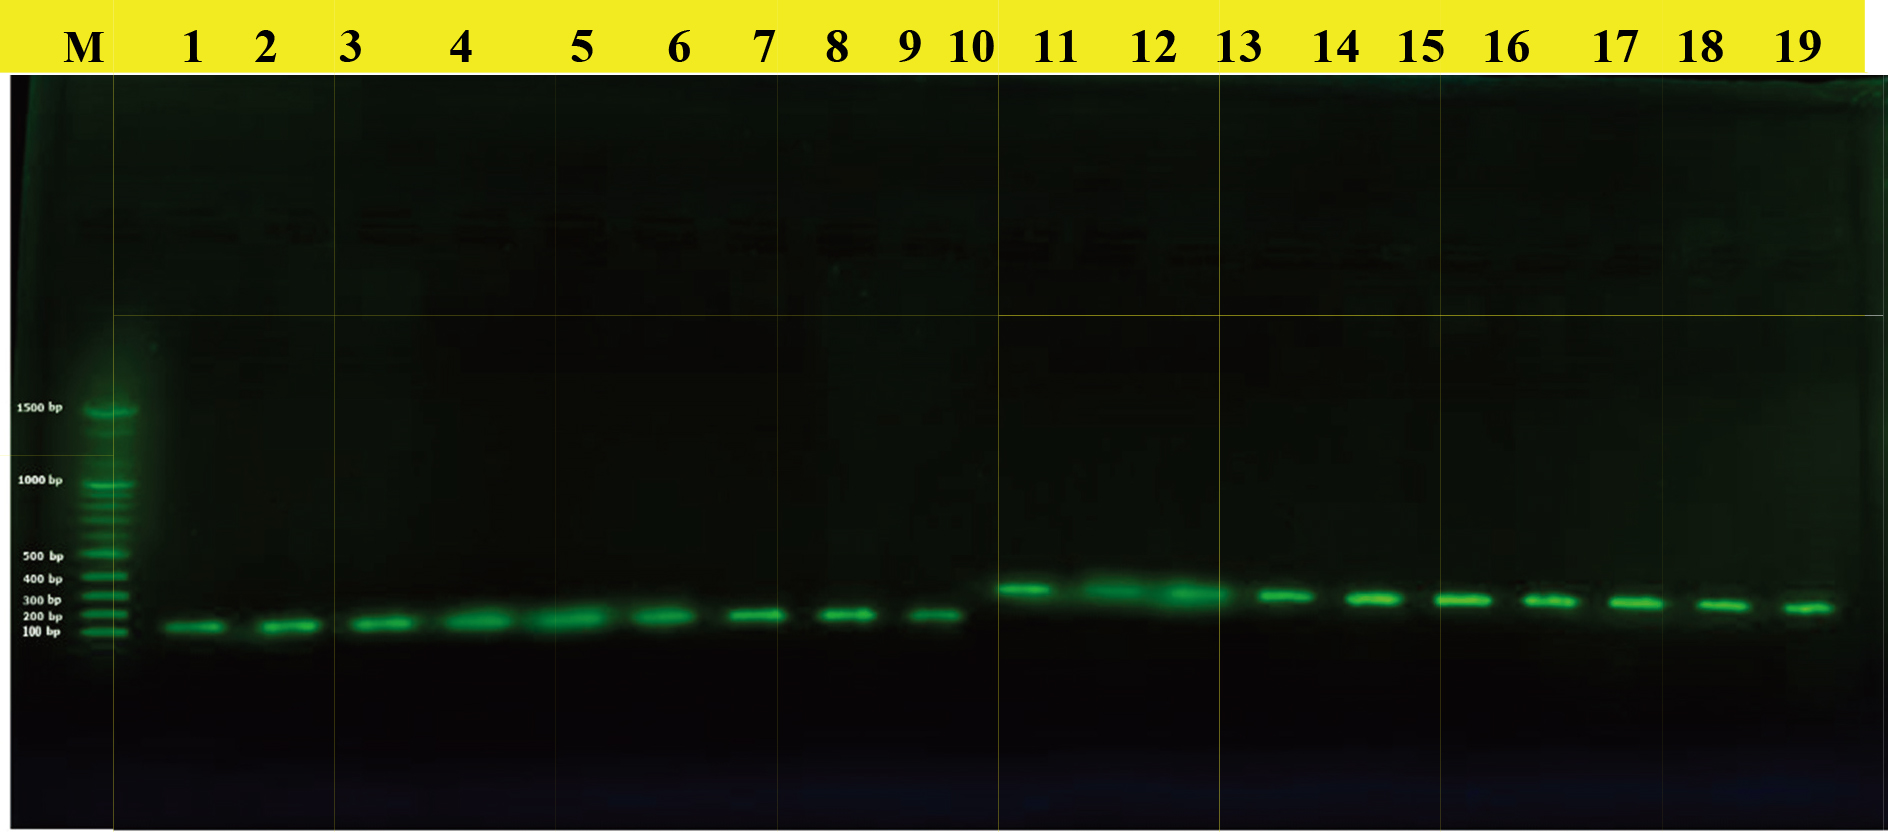
Primers and their information used in the current study
Table 1 lists the primers (Alpha DNA, USA) utilized in the current study along with their molecular weight and sequence. The primers listed below were created using a web-based primer design service for conventional PCR and were then verified using the Primer-BLAST-NCBI database.
Protocol of gene amplification
The IL-6 and IL-17A genes were amplified using a traditional polymerase chain reaction (PCR) thermal cycler Tc-3000X (Techne, USA). The PCR mixture contains 5
Thermocycling was designed to operate under the following conditions: an initial denaturation at 95
DNA sequencing
Sanger sequencing was performed using theABI3730XL automated DNA sequencing by Macrogen Corporation in Korea on twenty-four amplified PCR product samples (forward and reverse separately) for the IL-6 gene at rs1800795 loci and twenty-four sample (forward and reverse) for the IL-17A gene at rs2275913 loci.
Statistical analysis
Categorical variables were analyzed using NCBI-BLAST [18] and MEGA software version 6.0 [19] by comparing the outcome with NCBI control strains. The same program was used to examine query, pairwise alignment, and identity [20]. Odd ratio (OR) calculation was done using the MedCalc application to compare groups. Statistical significance was defined as a probability value of
Results
Immunoglobulins IgG and IgM concentrations against SARS-CoV-2 were estimated for all the study groups by using fluorescence Immunoassay (FIA) with high sensitivity. The means and SE of IgM in G1, G2, G3 and control group were 2.97
Means and SE of Anti-SARS-CoV-2 IgG and IgM in the study groups
Means and SE of Anti-SARS-CoV-2 IgG and IgM in the study groups
SE: Standard Error; p: probability; S: significant; G: Group; the letters (A, B, and C) for rows represented the levels of significant (LSD test), highly significant start from the letter (A) and decreasing with the last one. Similar letters mean there are no significant differences between tested mean.
Mean of HbA1C percentages among the study groups
SE: Standard Error; p: probability; G: Group; the letters A and B for rows represented the levels of significant (LSD test), highly significant start from the letter (A) and decreasing with the last one. Similar letters mean there are no significant differences between tested mean.
Means of anti-SARS-CoV-2 IgG (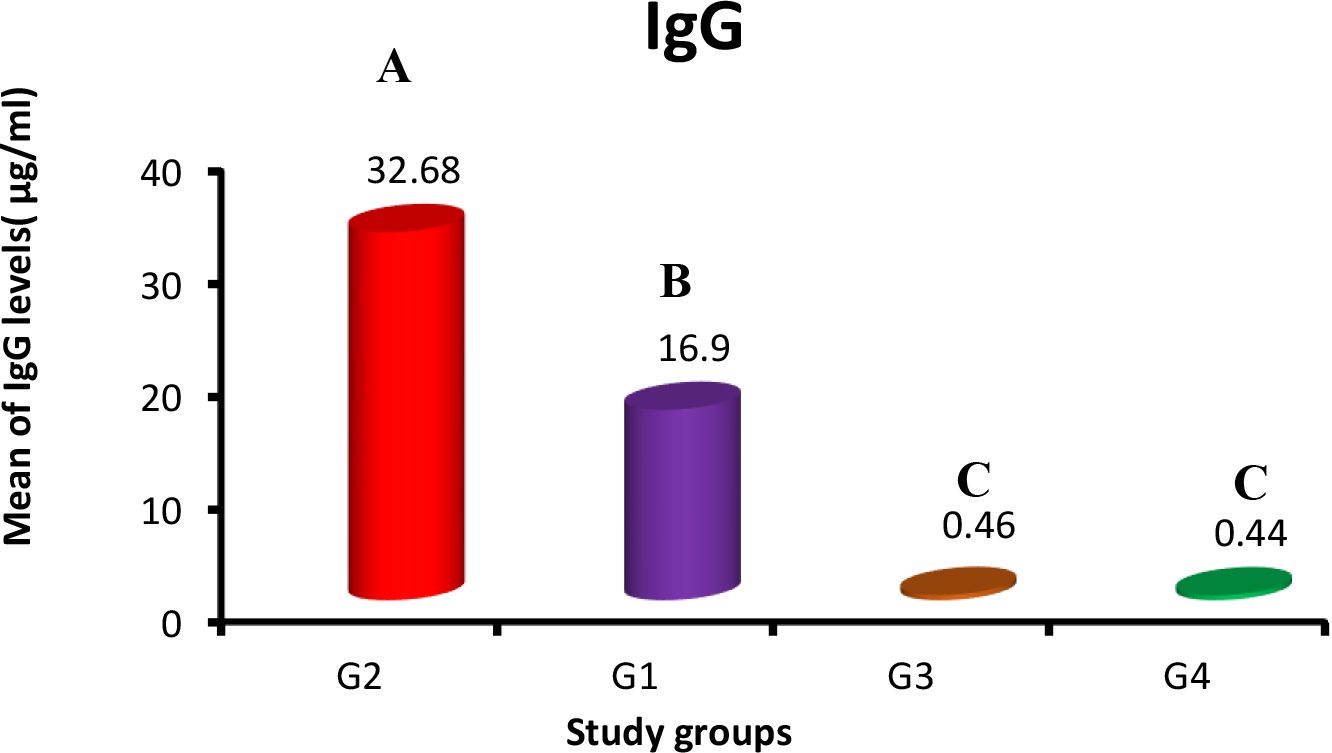
Means of anti-SARS-CoV-2 IgM (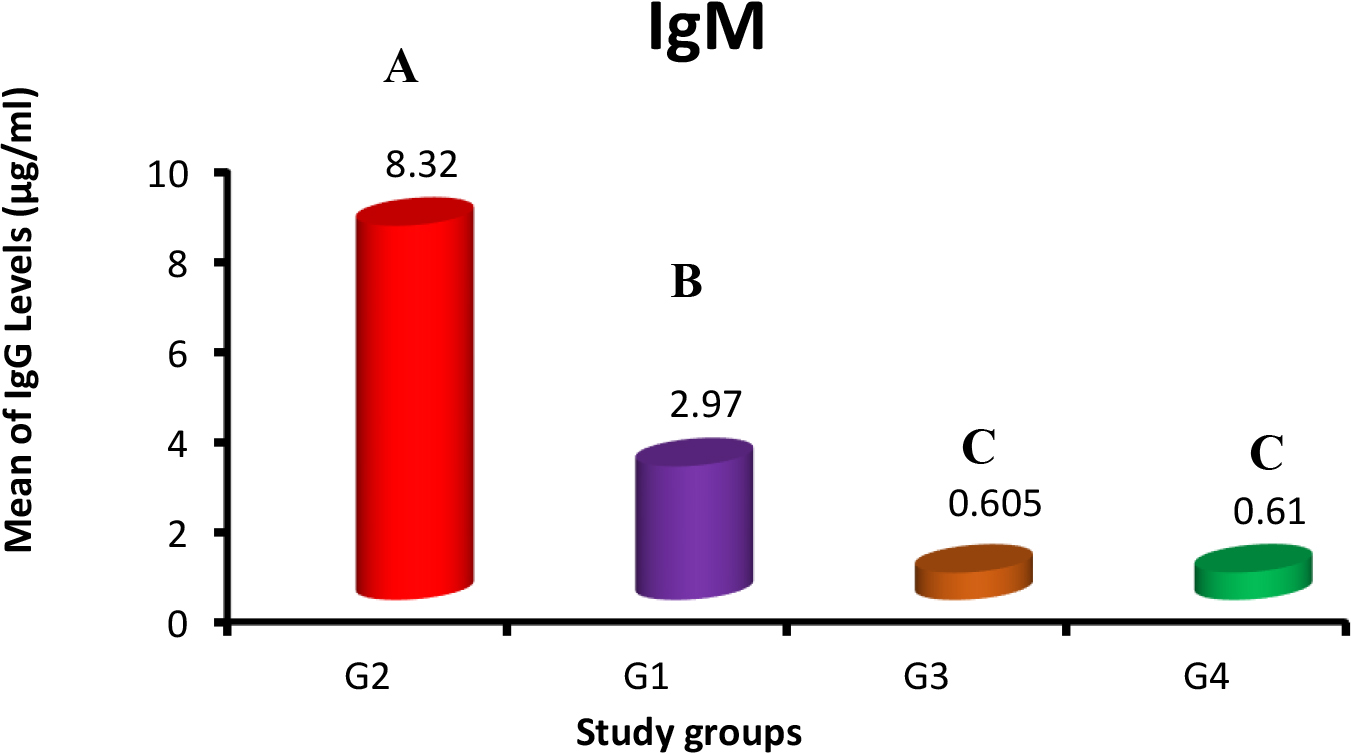
The mean and standard errors of HbA1C levels in G1 and G3 were 9.84
DNA sequencing
Sanger sequencing was used to examine 24 DNA samples in order to find IL-6 and IL-17A SNPs within these sequences. The human IL-6 and IL-17A genes are located on chromosomes 6 and 7, respectively, and have gene sizes of 308 and 197 base pairs, respectively. The outcome for the IL-6 gene’s rs1800795 SNP is shown in Fig. 5 below. Single “C” and “G” peaks denote homozygous alleles CC and GG, while double peaks denote heterozygous alleles CG.
Table 4 displays the results of the IL-6 SNP (rs1800795) molecular analysis. In comparison to the control group (0%), the homozygous GG genotype was significantly more common in G1 (66.6%) (OR
Because the homozygous GG genotype was significantly more common in G1 (66.6%) and G3 (100%) than in the control group (0%) in a significant way (OR
Genetic association of IL-6 gene SNP in the study groups and control
Genetic association of IL-6 gene SNP in the study groups and control
N: number; OR: odd ratio; p: probability.
Analysis of the IL-6 gene’s rs1800795 SNP. The homozygous alleles CC and GG are indicated by single C and G peaks, respectively, while the heterozygous allele, CG, is indicated by double peaks.
The results for the SNP of the IL-17A gene at the rs2275913 locus are displayed in Fig. 6 below. The homozygous alleles AA and GG are indicated by single “A” and “G” peaks, respectively, while the heterozygous allele GA is indicated by double “A” and “G” peaks.
Analysis of rs2275913 SNP of IL-17 gene. Single A and G peaks are indicative of a AA and GG homozygous allele respectively, while double peaks are indicative GA heterozygous allele.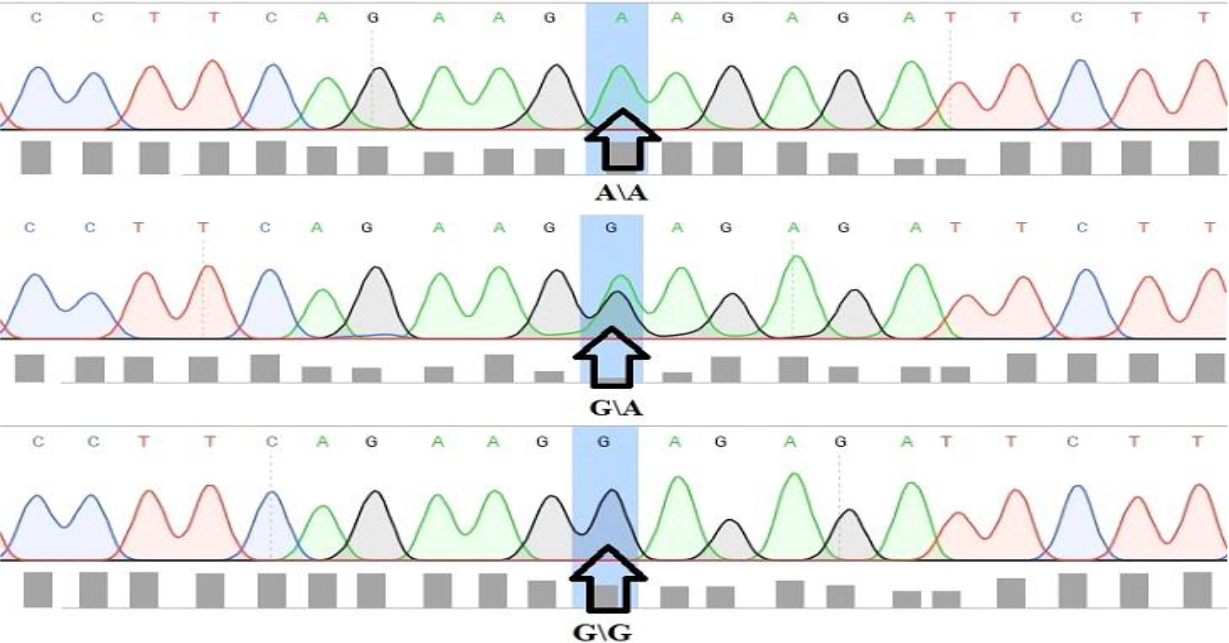
Genetic association of IL-17A gene SNP in the study groups and control
N: number; OR: odd ratio; p: probability.
Regarding the IL-17A gene polymorphism, frequencies of the GG genotype were found to be significantly lower in the three patient groups (0%) than in the control group (100%) (OR
In terms of allele frequency, the A allele was more prevalent in G1 (83.3%)at OR
T2DM is the most common comorbidities in COVID-19 patients, leads to poor outcomes. T2DM is among the variables that cause increased ACE2 expression in the lungs and other tissues; ACE2 is a cellular “receptor” and port of viral entry. The previous chronic inflammation, together with an amplified inflammatory response to the infection, results in a severe systemic immune response (“cytokine storm”), which is closely linked to higher COVID-19 severity [20].
In this study, serum levels of IgG and IgM antibodies against SARS-CoV-2 were investigated for all individual groups involved in this study. Samples were collected after the second week of infection from patients who have acute symptoms that related to infection with COVID-19.
Liu et al. observed that the timing of IgG and IgM Ab incidence in patients varies largely. This variation may be associated with age and comorbidity and they observed that the IgM antibody response against SARS-CoV-2 appeared earlier and peaked earlier than IgG and the response of IgM began to decline at week 3 of the disease, while the IgG response continued and was maintained in COVID-19 patients, and severe cases of COVID-19 patients tended to have a more robust response in both IgM and IgG antibodies to SARS-CoV-2 [21].
In response to infections, the immunoglobulins IgM and IgG are usually created by the adaptive immune system [22]. IgM and IgG can be specific and diagnostic markers for detecting of infections like COVID-19 [23]. This finding is the same to the results of another group that displayed a positive IgG titer in SARS-CoV-2 patients during the first 3 weeks after onset of symptom, though IgM showed a minor decrease in the third week [24]. Other studies have revealed that IgM concentrations elevated in patients during the 1st week of infection, with a high peak in the second week prior to a vast reduction near background levels in most COVID-19 infected patients. On the other hand, IgG antibody was observed after one week of infection and maintained at a high level for a long time after the occurrence of infection [21, 25].
Quantitative detection of IgM and IgG could assist in evaluating the severity of COVID-19 infection and could establish a dynamic that help in predicting prognosis and the levels of IgM and IgG antibodies are raised in COVID-19 infected patients [26].
The results of this study showed increased significantly of HbA1C in G1 and G3 and not increased in G2 compared with the control group. Glycated hemoglobin (HbA1C) is an essential biomarker of long-term glycemic control since it can reflect the previous two to three months’ cumulative glycemic history. HbA1c is not only a valid indicator of chronic hyperglycemia, but it also corresponds well with the risk of long-term diabetic complications [27]. Glycated hemoglobin (HbA1c) test is used to help investigate the prevalence of unrecognized diabetes, the cumulative prevalence of unrecognized and known diabetes, and the prevalence of poor glycemic control in both [28].
Single nucleotide polymorphism (SNP) is a change in single base of DNA sequence with a normal alternative of two possible nucleotides at a given site. This variation happens at a specific location in the genome, and has an allele frequency equal or greater than 1%. A single base pair polymorphism is the most common type of polymorphism [29]. Polymorphisms are important for determination of disease severity and susceptibility in the latest years. Polymorphisms are naturally occurring in DNA sequences [30]. SNPs are common markers in molecular genetic disease studies as well as pharmacogenomics researches. They consider as factors contributing to inflammatory diseases and cancer [31].
Genetic analysis regarding the SNP of the IL-6 gene (rs1800795) suggested that the GG genotype might be linked to T2DM, the GC genotype might play a susceptibility role in COVID-19, the CC genotype might play a role in reducing susceptibility to infection with COVID-19 and T2DM, the C allele might play a protective role for infection with COVID-19, and the G allele might be considered a risk factor for both COVID-19 and T2DM.
It has been demonstrated that the IL-6 (-174G/C) polymorphism’s promoter region has a direct impact on gene transcription. After IL-6 production, the interleukin can work on various immune cells to trigger and boost the inflammatory response and activate macrophages, which in turn causes organ damage (such diabetic nephropathy and neuropathy) [32]. In COVID-19 patients, the genetic makeup of a person is very likely to have an impact on the immune response induction and outcome. The SARS-COV-2 entrance, replication, and host immune response are all regulated by many host genes [33].
Verma et al. found that the patients with COVID-19 showed a considerably high frequency of the GC genotype in the North Indian population (adjusted OR 3.86,
According to the severity of the clinical symptoms, Rahimlou et al. discovered that the frequency of the rs1800795 SNP genotypes of IL-6 fluctuated in different groups of COVID-19 patients, and the G allele may likely have a protective function against COVID-19 [37]. Furthermore, Falahi et al. in the Iranian population observed no statistically significant differences in the genotype distribution of a particular SNP rs1800795 (174 G
In the case of the rs2275913 SNP for the IL-17A gene, frequencies of homozygous GG genotype and G allele were lower in patient groups than in controls; consequently, the GG genotype and G allele might have a protective role against COVID-19 and T2DM; the frequency of AA genotype was significantly higher in COVID-19 patients compared to controls, and the GA genotype was significantly higher in T2DM patients compared to controls; therefore, the GA genotype may predispose patients to infection with T2DM, the AA genotype may enhance susceptibility to COVID-19, and the allele A may raise the likelihood of developing COVID-19 and T2DM.
The relationship between the IL-17A (rs2275913) polymorphism and vulnerability to COVID-19 and DM has been the subject of numerous investigations. The cytokine storm differed by the rs2275913 polymorphisms in the IL-17A gene, and the severity of disease might be related to the genetic host factors including immune profiling. In a previous study, it was discovered that the GG and AG genotypes of the rs2275913 SNP in the IL-17A gene were associated with COVID-19 susceptibility in the populations of Brazil and Spain [40].
Kadhum and Ahmed reported that this polymorphism is linked to an elevated risk of T2DM possibly by up-regulating the expression of IL-17A cytokine [41]. They demonstrated that the heterozygous AG genotype of IL-17A G/A (rs2275913) polymorphism showed a risk among T2DM patients and the G allele was related to an increased risk of T2DM. However, there is no correlation between COVID-19 severity in Egyptian patients and IL-17A polymorphism [42]. Additionally, Abdulateef and Fouad discovered no correlation between COVID-19 and the frequency of the GA genotype in the rs2275913 locus. However, patients who had the A allele were shown to be at increased risk to infect with COVID-19 compared to the control group [43]. Differences in SNPs observed among populations could be influenced by a variety of factors, including genetic backgrounds, environmental conditions, and sample size; the small sample size may limit the study results, and a greater number of patients and controls may provide additional information about the role of IL-6 and IL-17A gene variations in COVID-19 susceptibility.
Conclusion
The susceptibility to infect with COVID-19 and T2DM was associated with two possible SNPs of the IL-6 gene at rs1800795 (G/C) and IL-17A gene at rs2275913 (G/A) loci in the Iraqi population. The relationship between genetic variants in IL-6 and IL-17A and the infection with COVID-19 and T2DM has to be confirmed by additional research incorporating more SNPs and a larger sample size.
Ethical clearance
On an ethical level, this study was accepted by the research ethical committees of Iraq’s ministries of environment and health, higher education and scientific research. in approval number BCSMU/1221/0004M in December, 1, 2021.
Authors’ contributions
Each of the below authors made a significant contribution to the research and writing of this publication. Conceptualization, K.H. Rasool; Interpretation or analysis of data, E.N. Naji, Q.A. Khalaf; Soft-ware, Q.A. Khalaf; validation, K.H. Rasool, E.N. Naji; Formal analysis, Q.A. Khalaf and E.N. Naji, investigation, Q.A. Khalaf; Resources, Q.A. Khalaf; data curation, E.N. Naji; Preparation of the manuscript, Q.A. Khalaf; writing-review and editing, K.H. Rasool, E.N. Naji; Revision for important intellectual content, K.H. Rasool; Supervision, K.H. Rasool, E.N. Naji. All authors have read and agreed to the published version of the manuscript.
Footnotes
Acknowledgments
The authors would like to thank the Biology department, College of Science, Mustansiriyah University/ Baghdad, for supporting this effort. We also want to thank the referees for their thoughtful reading of the manuscript and their insightful remarks.
Conflict of interest
The authors declare that they have no conflict of interest.