
Abstract
This paper describes an empirical research work based on the use of a suitable data structure, named Flow Graph (FG), that can be induced from a supervised training data set. A FG can be approached as a weighted and labeled digraph that summarizes a given supervised training set, aiming at its analysis. FGs can also be used as a repository of the information embedded in training sets, that supports the extraction of classification rules, aiming at the definition of classifiers. The work described in this paper reviews FGs and related concepts, as originally proposed i.e., a suitable structure for modeling discrete data, and proposes its customization for dealing with continuous data. The customization consists of a pre-processing step where a discretization process is carried out in a two-step hybrid approach named HFG (Hybrid Flow Graph). Several experiments with focus on the classifiers extracted from HFGs were conducted and their results were analyzed with focus on both, the value of some metrics associated with the induced digraph-based structure as well as the performance of the classifier extracted from the structure. For the experiments 19 diversified datasets were used and the classification results were comparatively analyzed with those obtained by classifiers induced using four other algorithms namely, J48, Naïve Bayes, k-Nearest-Neighbor and Support Vector Machine.
Keywords
Introduction
The concept of Flow Graph (FG) was proposed by Pawlak [46] as a mathematical formalism suitable for representing, exploring and analyzing some characteristics associated with a set
The formalism and the procedures for summarizing training sets as FGs aim at easing and promoting the analysis of the flow distribution of attribute values that describe the training data instances, taking into account their classes. The FG data structure also supports the extraction of decision rules, which can be used to classify new data instances that have no associated class. As stated in several works related to FGs cited in this paper, some options for representing data (e.g., those based on the Bayes rule [12]) have a probabilistic interpretation, since their results are strongly linked to probability. The results of analyses performed taking into account an induced FG structure, in turn, have a deterministic interpretation, since they effectively reflect the data flow and not just a probability related to the flow.
It cannot be forgotten, however, that like any inductive approach to data/knowledge representation, the training set has a deep impact on the suitability of FGs, when used either as a structure for data analysis or for supporting the extraction of decision rules, the latter being the focus of the work described in this paper.
Based on the available literature, it is clear that the formalism supporting the induction of original FGs and, subsequently, the extraction of decision rules from them, is not as popular as several other propositional supervised algorithms, such as those that induce Decision Trees [22, 23], Neural Networks [3, 40], Decision Rules [33], etc. Perhaps one of the reasons for the low popularity of FGs is the fact that several works found in the literature, particularly those that formally introduce the FG approach and discuss theoretical issues, restrain themselves to the use of discrete-valued data, which confines the use of FGs mostly to artificially generated data.
The research work reported in this paper is an extension of the work described in [8], where a proposal for adapting the original FG for representing and handling continuous data has been described. The proposal, named HFG (Hybrid Flow Graph), allows the use of FG structures as the source of data information for extracting classifiers in continuous domains, and has been implemented as a computational system, the EFLOWG (Extended Flow Graph), which allows the pre-processing of training data attribute values using discretization algorithms [37, 41]. This paper mainly explores the FG and HFG structures by (a) enlarging and refining the literature review on FGs, (b) extending the number of experiments conducted and presented in [8] and (c) discussing the impact (as far as classifiers are concerned), of the order in which attributes are placed in FG-based structures.
The reminder of the paper is organized as follows. Section 2 presents a brief survey of research works related to FGs. Section 3 introduces the main concepts related to FGs, as well as a high level description of how to construct such graph (actually, a digraph) to summarize a given supervised training data. Section 4 presents a small example of the process involved in creating a FG, as originally proposed i.e., from a discrete training data. Section 5 briefly presents the default discretization algorithm used as a pre-processing step for the construction of HFGs. Section 6 approaches the extraction of classifiers from FG-based structures and Section 7 describes the main technical characteristics and functionalities of the computational system EFLOWG, which was developed with the main intent of conducting experiments involving the use of HFGs as data structures for extracting classifiers. Section 8 describes a set of experiments using classifiers extracted from HFGs as well as those induced by the C4.5 [23], in its J48 version, the Naïve Bayes, the k-Nearest-Neighbor and the Support Vector Machine, all available in the Weka environment [10] (see [35, 38, 40] for details about the four algorithms). Section 9 discusses the impact of the order of the attributes that describe training instances, on induced FG-based structures. In Section 10, the last section of this paper, a few conclusions, based on what has been achieved, are presented and some suggestions for continuing the research work done so far are considered.
In the text, depending on the context, FG refers to the algorithm or the structure that represents a conventional flow graph, HFG refers to the algorithm or the structure that represents the extended flow graph and EFLOWG is the computational system that implements both algorithms, as part of a friendly computational environment for using them.
A brief literature review on the use of flow graphs
As mentioned before the so-called Flow Graph (FG), as proposed by Pawlak in several articles (see, for instance, [46, 47, 48, 49, 50, 51, 52, 54]), can be approached as a data structure that aims to summarize a set of supervised data instances and, at the same time, to act as a repository for the extraction of classifiers, in the context of the knowledge domain related to the data it summarizes. In this way, FGs can be considered structures that support decision algorithms and therefore, an important part of the set of Machine Learning (ML) techniques and algorithms (see [4, 18, 23, 35, 40]).
It can be found in the literature several definitions of FGs associated with concepts other than those defined by Pawlak i.e., an acyclic digraph (summary graph) that represents a set of data instances. This is the case, for example, of the concept of control flow graphs, proposed by Allen [13, 14, 15, 16], associated with a representation based on graphs, of the paths that can be traversed by the code of a program, during its execution, mainly aimed at code optimization. A variant of it, known as data flow analysis [27], has been established as a technique for evaluating and possibly ensuring the reliability of computer programs.
FGs also differ fundamentally from the flow graphs proposed by Ford and Fulkerson in [28]. The Ford-Fulkerson algorithm (or method) determines the maximum flow in a flow network, where a flow network is a directed graph in which each arc has an associated capacity and receives a flow; the flow volume in an arc cannot exceed its capacity.
As mentioned in the previous section, it is a fact that research work and empirical studies having FGs as main goal are not as widespread as those related to the most popular algorithms in the ML area, such as decision tree based algorithms and clustering algorithms, for example. Nevertheless, most FG-related articles found in the literature provide sufficient information to understand the main concepts, which are usually presented in didactic way, invariably accompanied by examples for promoting ease comprehension
In spite of not introducing the concept of FG yet, the main ideas involved in the definition of the FG structure are already embedded in the text presented in [45], where rough sets [43, 44, 53], decision algorithms and the Bayes’ theorem have been considered in relation to their relationships and where some of the examples discussed were later revisited in research works specifically related with FGs.
Since its proposal, in 2003 [46], it can be observed that the definition of FGs has evolved and has been refined over time; also, a few other concepts have been proposed and incorporated into the main structure of a FG. The work described in [46] defines a relationship between flow graphs and decision algorithms, showing that the information flow in a decision algorithm can be represented as a flow in the FG and also, that the flow is subjected to the Bayes’ formula, approached with a deterministic meaning.
The work presented in [48] is a short paper which has as main goal to stress the relationship between the Bayes’ theorem and the concept of rough sets. It also can be seen as a summary of some of the previous works by the same author, where FGs are defined and their use is exemplified. The work, however, starts from the definition of decision algorithms and discusses the relationships between decision algorithms, FGs and the Bayes’ theorem. The short paper approaches FGs as a derivative from decision rules and not the other way round, as usually can be found in later publications on FGs.
The work reported in [50], as suggested by its author, can be seen as a continuation of a series of investigations that were conducted on the relationship between decision algorithms and the Bayes’ theorem. It focuses mainly on the Lukasievics’ ideas concerning the relationship between multivalued logic, probability and the Bayes’ theorem. In spite of the focus being on decision rules, the FG formal concept is not considered in the work.
In [52] several applications of the use of FGs in various knowledge domains have been presented, aiming at approaching different aspects of the formalism as a tool for analyzing data, as summarized next.
The example by the name of Smoking and Cancer explores the probabilistic aspect of data analysis and discusses the relationship between statistical and FG-based approaches. In the example a table concerning 60 people who smoke (or not) and who have cancer (or not) is considered. The total number of people who do not have cancer is 50, and this group of people is approached divided into 40 people who are non smokers and 10 people who are smokers. The total number of people who have cancer is 10, approached divided into 7 people who are non-smokers and 3 who are smokers. The resulting FG has two layers (a) the first layer is defined by attribute smoker and has two nodes, no and yes, each associated with one the two possible values of the attribute smoker and (b) the second layer is defined by attribute cancer and has two nodes, no and yes, each associated with one of the two possible values of attribute cancer. The four arcs in the FG connect: (a) node smoker
The other seven examples discussed in the previous reference investigate: (1) the relationship between the color of eyes, the color of hair and the nationality, (2) three industrial plants that produce three different products. The plants are investigated in relation to the quality of their products being defective (or not); (3) the relationship between shape and size, as well as between size and color, in a playing block data domain is analyzed based on FG; (4) an analysis of customer preference in buying cars is conducted, based on FGs, in a scenario that considers three models of cars sold to three disjoint groups of customers by four different car dealers (also discussed in [46]); (5) a voting analysis based on FGs is conducted in a situation involving voters grouped in three disjoint groups of age, who belong to one of three different social classes and voted for one of four political parties (also discussed in [47]); (6) the analysis of a promotion campaign for a product being released in the market, based on FGs constructed using three groups of potential customers split by age (young, middle-age and old) as well by their place of residence (town, village and rural) and their answer to the question whether they would (or would not) buy the product and (7) an analysis of paint demand and supply concerning cars, based on FGs.
Considering that no investigations related to the complexity of the procedures involved in FGs had been dealt with so far, Butz and co-workers, in [2], conducted an analysis of the traditional FG inference algorithm (classifier) establishing that its time complexity is exponential with respect to the number of nodes in the FG. In the same work the authors propose a new FG-based algorithm, that exploits factorization in a FG, which has polynomial time complexity.
In [34] the authors approach rule learning by establishing ordinal prediction, based on rough sets, soft-computing and implicitly using FGs. They redefine the ordinal prediction for each decision rule, generally stated as “If
For exemplifying many of the concepts related to FGs the author in [54] uses data from a group of 1,000 patients put to test for evaluating the effectiveness of a certain drug. Patients are grouped according to the presence (or not) of a particular disease, their age (old, middle-age or young) and the test results (positive or negative). The FG induced from the data was then analyzed, searching for insights based on the relationships between different groups of patients.
In [42] the authors attempted to discover possible trends and needs, related to business aviation, for supporting the government to make a decision, in anticipation to an eventual deregulation in a near future. For the study a combination of rough sets, flow graphs and formal concept analysis was employed for analyzing the previous purpose. The results have shown that the combined approaches were well suited for both, the analysis of the market potential for business aviation and the needs of business aviation customers, prior to the industry’s deregulation.
The paper by Lisowski and Czyzewski [25] explores the use of FG extensions in video surveillance systems, especially in distributed multi-camera systems, for tracking objects between cameras with non-overlapping fields of vision.
Chan and Tsumoto, in their paper [1], investigate FGs induced using multiset decision tables. The concepts of rough multisets and information multisystems were introduced in [24]. Multiset decision tables are data tables represented by multisets, as defined in [6].
Defining and constructing FGs
The definition of flow graph (FG) involves the definition of directed graphs (or digraphs); it is important, therefore, to present both concepts, graphs and digraphs, before presenting the formal definition of FGs.
As defined in [20], a graph
If, instead of unordered pairs (
As defined in [46, 49], a flow graph
In a flow graph, an arc is represented by the ordered pair
Given a set of supervised data instances
For each attribute The class attribute is represented by layer Consider that each attribute Nodes in a given layer For each arc Two numeric values, inflow (
Once the set of nodes and set of arcs have been constructed and the associated labels and weights have been assigned to nodes and arcs, the construction of the basic version of the FG is finished. Finally, the flow of the FG, noted by
A normalized version of FG can be obtained by dividing each label/weight by the value given by
Consider a training set having 14 data instances,
Based on the description of
Training set with 14 instances described by 3 attributes,
,
and
, where
represents the instances associated class
Training set with 14 instances described by 3 attributes,
In Table 1 the instance
The procedure is repeated for all pairs of nodes belonging to adjacent layers (the first node of the pair in layer
By dividing each value associated with nodes and arcs of a FG by the number of summarized instances, a normalized version of flow graph, where the associated values are in the interval [0 1], is obtained. The graph presented in Fig. 1 has not been normalized.
The FG structure (not normalized) induced from the set of data instances in Table 1.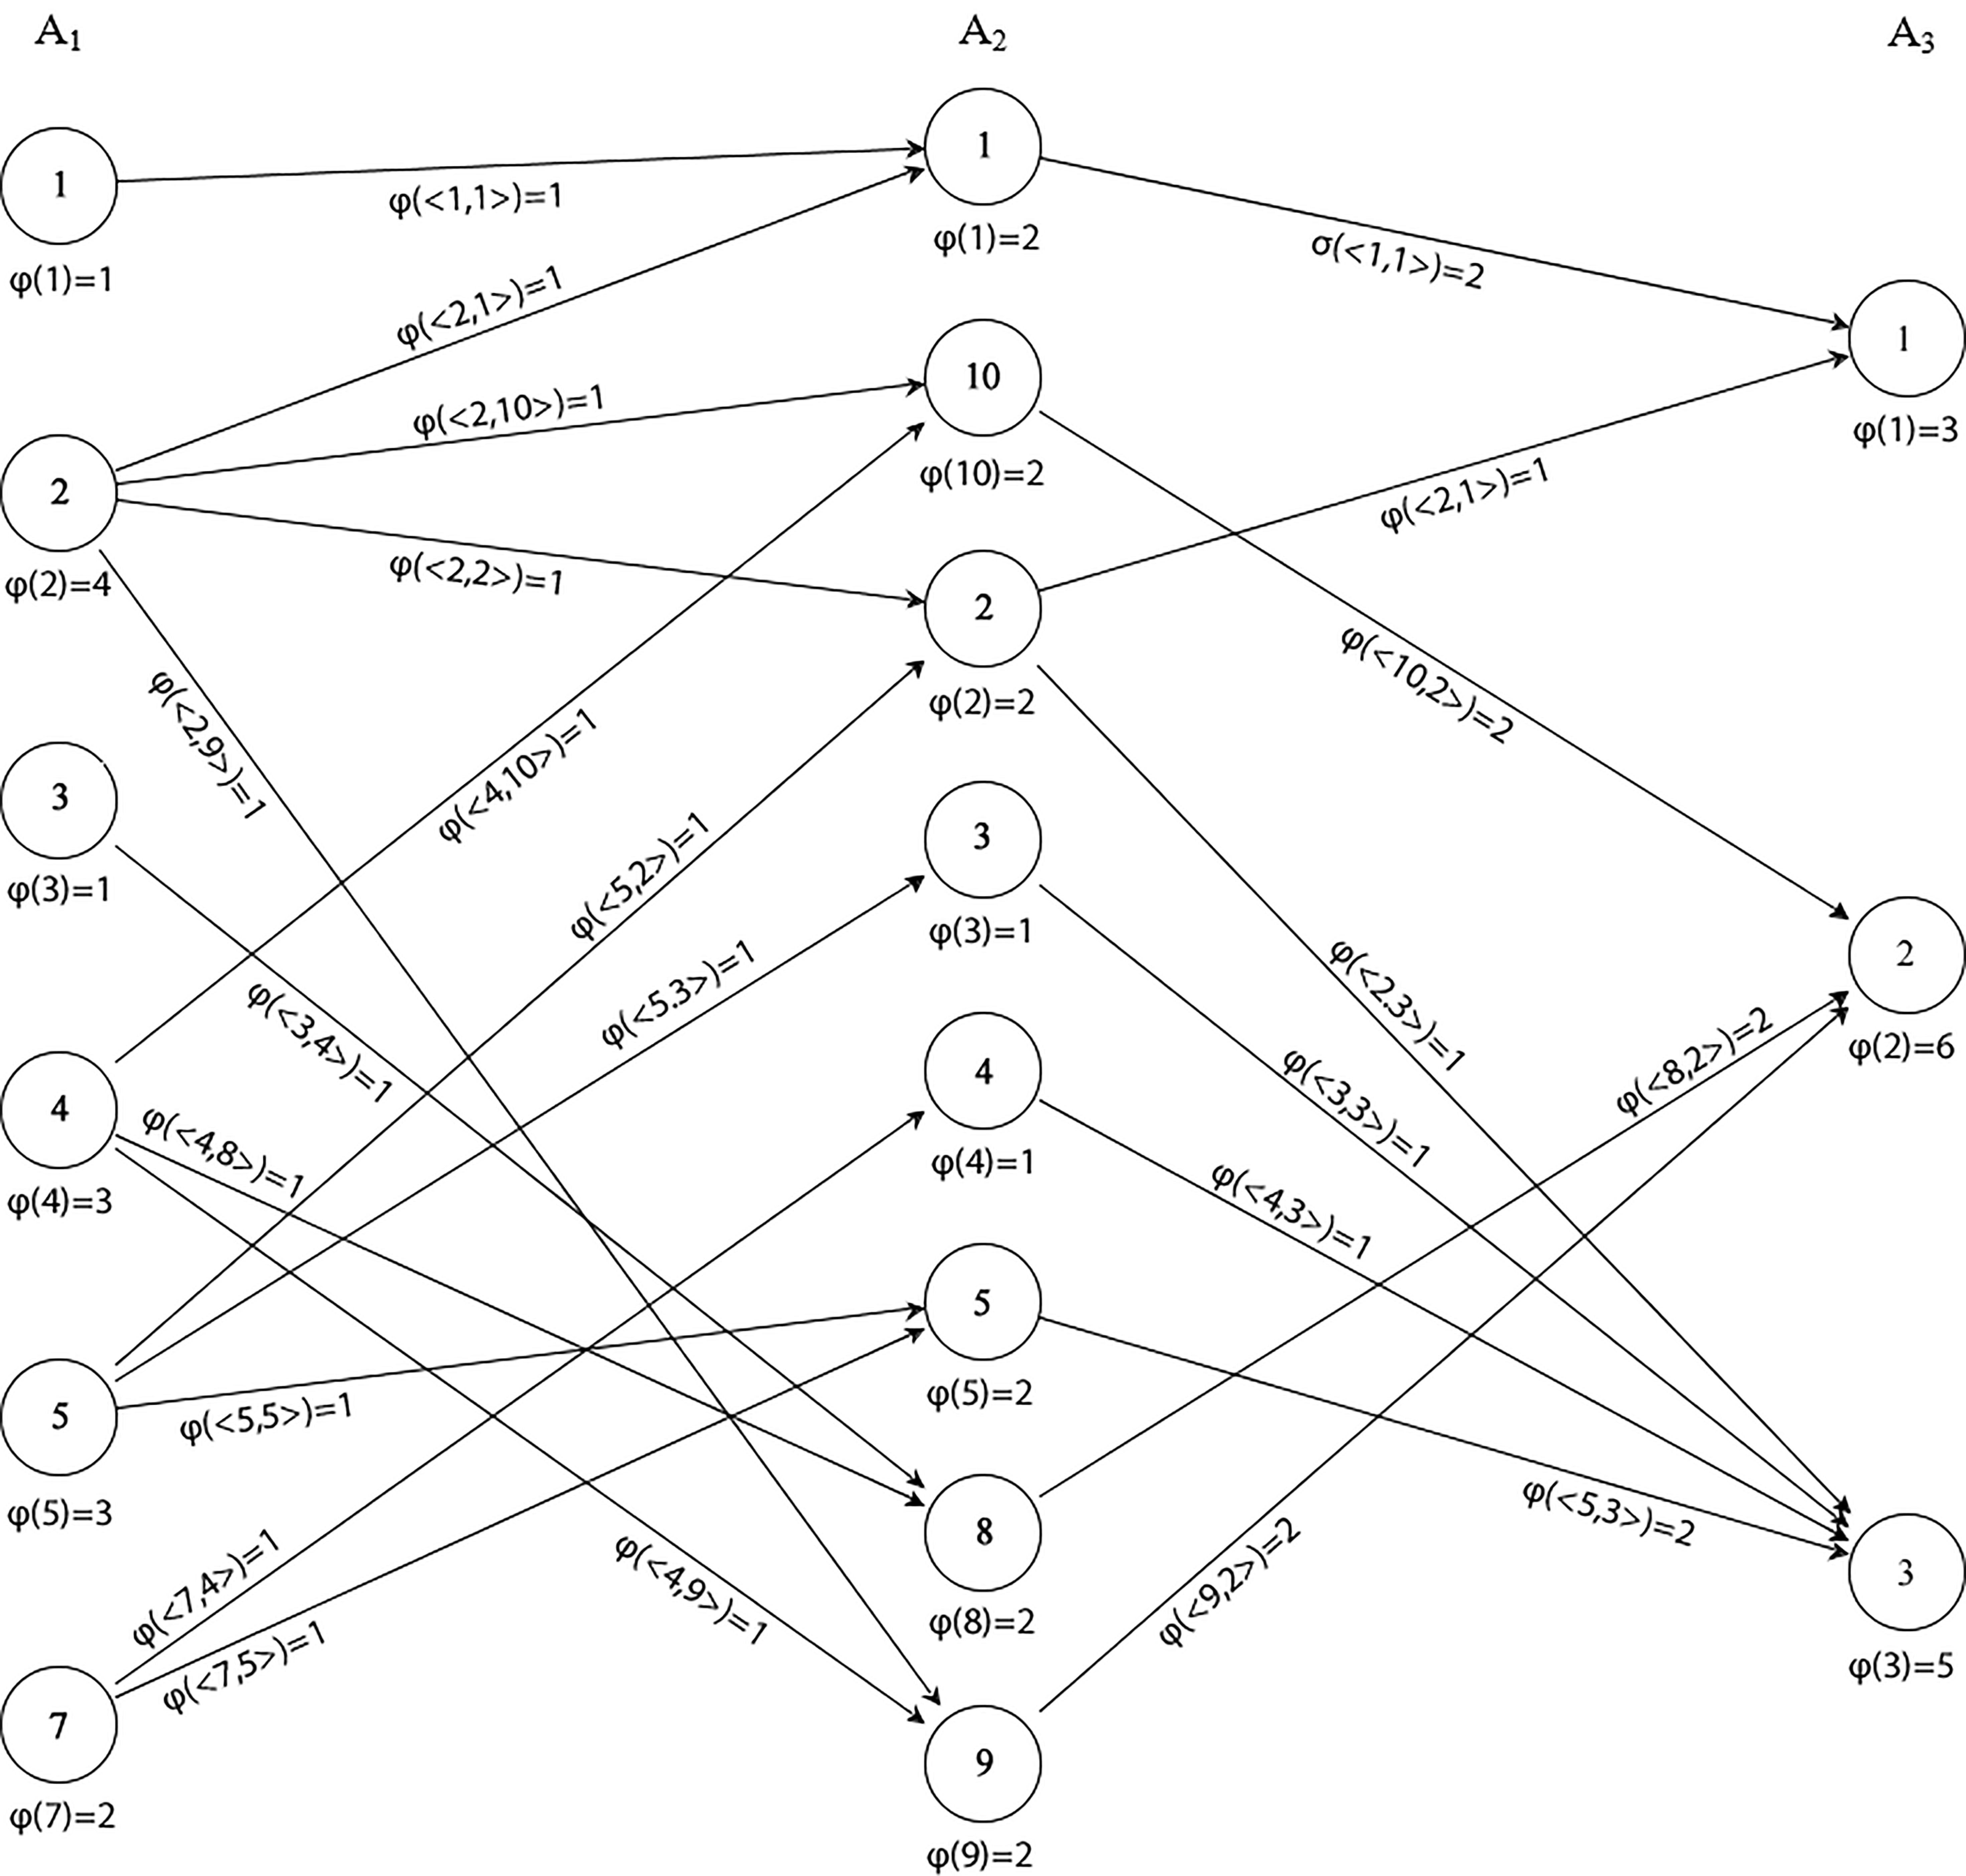
In the experiments described in Section 8, the Minimum Description Length Principle Cut (MDLPC) criterion, proposed and described in [41], has been used as the first-step of the HFG proposal, for dealing with continuous-valued attributes. The MDLPC criterion is one of the most commonly used discretization algorithms in supervised machine learning. It is based on two concepts, the entropy and the information gain measure, to determine the best cut point for splitting a continuous interval.
The algorithm is recursive and has time complexity of
The splitting point candidate with larger information gain is evaluated according to the MDLPC criterion. If the splitting point candidate passes the MDLPC criterion it becomes a cut point and the discretization method is recursively executed for both subsets of values induced by the new cut point. Otherwise, the algorithm ends.
Let
For calculating the entropy of set
Taking into account the attribute
The expression
The MDLPC criterion only splits an interval into two subintervals at a time. To split an interval into more than two subintervals, the procedure should be recursively called, until a cut point candidate no longer satisfies Eq. (3).
It is possible to extract, from a flow graph, a set of decision rules representing a classifier, as proposed and described in [46, 48, 50]. In this section the original method used to extract classifiers from FGs is reviewed and two modifications are considered.
Given a flow graph FG, a complete path [
Consider again the data set given in Table 1 and the FG shown in Fig. 1, both in Section 4. The set of complete paths in the FG and their corresponding decision rules, are presented in Table 2. The notation employed in the table i.e.,
The method for extracting classifiers as described in [46], however, allows the extraction of both, unsupported decision rules as well as inconclusive decision rules. In this paper unsupported decision rules are defined as rules whose conditional part does not match any data instance and, possibly, they have been induced as the result of an over generalized process. To detect unsupported decision rules each decision rule extracted from the FG has its quality assessed based on its classification performance over the training set. Decision rules detected as unsupported are removed from the set of rules that represents the classifier.
Complete paths of the FG in Fig. 1 and associated decision rules
, where #path: counter associated with a particular path. The subscript in
refers to one of possibly various complete paths from
to
Complete paths of the FG in Fig. 1 and associated decision rules
Let CL be a classifier represented by the set of decision rules given in Table 2. By inspecting the rules in CL, it can be observed that rule associated with the #path 1, given as 1, 3
Inconclusive decision rules are characterized as rules that share the same conditions, but have different conclusions. The removal of inconclusive decision rules must be performed after the removal of unsupported decision rules, to prevent supported from being removed too early.
To remove inconclusive rules an analysis, taking into account the set of decision rules, is conducted and, for each pair of decision rules that have the same conditions but different decisions, the rule with the lowest strength value associated is removed from the classifier. The strength factor associated with a complete rule [
Considering again the CL classifier used as example, after the removal of the unsupported rules, no inconclusive rules can be found. At the end of the process just described, each one of the rules in CL is a supported decision rule (i.e., it classifies at least one instance of the training set) and conclusive (i.e., there is no ambiguity in the decisions to be made). The CL classifier initially induced had its original size reduced and, considering it only contains supported and conclusive decision rules (as far as the training set is concerned), its chance of correctly classifying new data instances has increased.
Data descriptions where DS: data set identification, #NI: no. of data instances, #NA: no. of attributes, #NG: no. of groups and G_Id
As mentioned before, a computational system named EFLOWG (Extended FLOW Graph) was developed to provide an environment to carry out experiments related to the use of flow graph concepts and structures, as well as the methods investigated, particularly with focus on the FG extended version for dealing with continuous data, referred to as HFG.
The EFLOWG computational system is a desktop system, developed in the Java programming language, implemented and used in a Windows 10 platform. The system has an intuitive interface, which favors its use and facilitates its understanding and learning. Among the several EFLOWG characteristics and functionalities, the following nine stand out:
Input data instance sets should be given to the system as ARFF files; The system identifies attributes, attribute types and values associated with attributes; The information area provided by the system, regarding the set of data instances, is updated in real time; Facilities for identifying and dealing with attribute missing values and outliers are provided by the system. Particularly, it offers three choices for dealing with the problem of missing attribute values; The system offers the implementation of three methods to be used for data discretization; The system allows the user to sort the attributes in a particular way, at his/her choice or, then, to sort them using their associated Gain Information value; It allows the induction of flow graphs and the extraction of classifiers, and corresponding evaluation, in two distinctive ways:
Division by percentage: training and testing sets are defined based on a percentage of instances, provided by the user and; Cross-validation: runs a cross-validation process, based on an integer value The system makes available an output screen that prompts detailed information about the FG-based induced structures and results of the experiments performed and The system keeps trace and stores experiments performed, for future analysis and comparison.
The experiments results presented and discussed in Section 8, as well as the transformations in the data used in the experiments, were carried out using the computational system EFLOWG.
Structure characteristics obtained in the 5-fold experiments using the HFG approach having as input data each one of the 19 data sets in Table 3, where DS: data set identification, #nodes: average number of nodes of the induced HFG, #arcs: average number of arcs of the induced HFG, size: #nodes
Classification performance of sets of rules extracted from HFGs, where DS: data set identification, #TDR: average number of total decision rules, #DR: average number of consistent decision rules, #cc/#total (SD): average number of correct classifications/average number of instances (standard deviation) and %acc: average percentage of accuracy values
Average of accuracy rate results obtained by HFG (HFG), J48 (J48), Naïve Bayes (NB), K-Nearest Neighbor (KNN) and Support Vector Machine (SVM) algorithms for data sets in Table 3. Best results are bold faced
Results obtained using attribute sequences defined by the Information Gain (IG), in ascending and descending order, where DS: data set identification; %ASC: accuracy obtained using the IG in ascending order; %DESC: accuracy obtained using the IG in descending order, and %ORIG: accuracy obtained using the original sequence of attributes that describes the data instances. Best results are bold faced
As introduced earlier in this paper, the proposed HFG approach, implemented by the computational system EFLOWG, is a two-step process that uses, in its first step, the discretization method presented in Section 5, which favors, in continuous domains, the induction of smaller FGs, when compared with the bulky FGs induced by the original FG. The digraph induced by the HFG approach also allows the extraction of a classifier, composed by a set of decision rules, as discussed in Section 6.
This section shows and analyzes the results of experiments performed considering the HFG approach and the EFLOWG system, having as input training instances from 19 data sets, most of them downloaded from the UCI ML Repository [5] and some from other places, such as [11, 17, 21, 29, 36]. The main characteristics of the 19 data sets are described in Table 3.
For each data set
For each set For each set
At the end of the 5-fold cross-validation, the average and corresponding standard-deviation of classification rates of the set of rules extracted from the corresponding induced HFGs, taking into account the values obtained in each one of the five steps of the process, were calculated.
Table 4 shows the values of the four characteristics used for evaluating the flow graph structures induced by the processes that implement the Hybrid Flow Graph (HFG) approach, for each data set in Table 3.
The characteristics are: the number of nodes, the number of arcs, the size (given by the number of nodes plus the number of arcs) and the number of complete paths found in the structure. The values in the table are the average and the corresponding SDs of measurements related to the four characteristics, based on the 5-fold cross-validation process. The original sequence of attributes (i.e. attributes order) that describes the instances in each original data set was maintained for the experiments.
Table 5 presents information about the performances of the classifiers extracted from the HFGs whose structure characteristics are shown in Table 4. As discussed before, the EFLOWG, when extracting the set of rules from HFGs, only considers supported and conclusive rules i.e., rules that classify at least one instance and are not ambiguous. Unsupported and inconclusive rules are not present in the classifier (as described in Section 6).
Accuracies of classifiers when using two different sequences of attributes, where DS: data set identification, BAS: sequence of attributes that produced the best result, OAS: original attribute sequence, %acuBAS: accuracy obtained using BAS, %acuOAS: accuracy obtained using OAS
For instance, associated with the data set identified as Gl in Table 5, the total number of extracted rules was 26,989 and, after the removal of unsupported and/or inconclusive rules, the number went down to 73, implying that 99.73% of the extracted rules were unsupported or inconclusive. For the data set identified as Wi, only 0.008% of the original rules, extracted from its corresponding HFG, were supported and conclusive. In Table 5, #TDR stands for the original number of decision rules extracted from the HFG and #DR stands for the number of consistent decision rules.
Although performances of classifiers induced from HFGs were quite acceptable for most data sets, in the CS data set the results (accuracy rate of 62.50%) were far from being satisfactory; in this case, a further investigation about the reasons for this outcome needs to be conducted.
Aiming at a further investigation of HFG performances, the results produced by EFLOWG as well as those obtained using the J48, Naïve Bayes, K-Nearest Neighbor and Support Vector Machine, from implementations available in the Waikato Environment for Knowledge Analysis (Weka 3.8) [10], in the 19 data sets, are shown in Table 6. Details about the four algorithms can be seen in references [21, 35, 38, 40].
As can be seen in Table 6, the performance results obtained by the HFGs in several data domains are not as good as those obtained by the other four algorithms. The HFG approach had comparative best performance in only 5 out of the 19 data sets. However, it can be observed in Table 6 that, in most cases, the results obtained by HFGs were close to those obtained by the other 4 algorithms; although FG-based results in most cases were not the best ones, they still can be considered good results, except in the CS data set. Considering that the other 4 algorithms are widely well-established algorithms that have been receiving research investments since they have been proposed, the results obtained using HFGs are quite encouraging for supporting to pursue this line of research. Also, a statistical analysis is still needed to verify if the differences among the results of the five algorithms are indeed relevant.
It is important to mention that the synthetic bi-dimensional data sets used in the experiments described in this section are typically used in experiments related to clustering and their instances have no associated class. For the experiments conducted however, the instances of the synthetic data sets have been assigned a class, corresponding to the group they belong to in a clustering identified by a visual analysis of the corresponding plotting of each data set.
During the research work it was noticed that different sequences of attributes (in relation to the order of appearance of its elements) can produce different results. An empirical investigation, based on three experiments, was carried out to verify the impact of different sequences of attributes on the results obtained.
The first two experiments used the Information Gain (IG) measure (presented in Section 5) to establish the order of the attributes in two different sequences. The first sequence of attributes was based on ordering of attributes in ascending order of their IG values, and the second sequence of attributes was obtained using the descendent order of the IG values of the attributes. Classification results using the ascending, descending and original order of the attributes for describing the training instances are shown in Table 7.
Based on results shown in Table 7 it can be observed that the orderings (ascending or descending), when contributing to the accuracy of the induced rules, only had a mild contribution in approximately half of the domains. The same can be said about maintaining the original the sequence of attributes which, in spite of producing rules with better accuracy in 9 out of 19 data sets, the values themselves are close to those obtained by ordered sequences (in ascending or descending order).
For the third experiment it is worth mentioning that the EFLOWG system enables the identification of the
Based on the three experiments performed it can be said that the use of the original sequence of the attributes produced, in the majority of the experiments, better results when compared to those obtained with sequences considered as best attribute sequences. However, it was not possible to identify a pattern when ordering the attribute sequence that guarantees the best classification results.
Conclusions and future work
FGs can be defined as knowledge representation structures and are mostly used as a mathematical tool for analysis of information flows, in information networks represented by digraphs. FG-based structures also can be approached as a special type of database in which, instead of storing information about individual objects, statistical characteristics of the objects are represented and stored as information flow distribution. The relations between the attributes that describe the data are established through a chain of sequenced arcs that starts at the input layer and ends at the output layer, which is interpreted as a decision rule. The structure of a FG as a whole can be interpreted as a decision algorithm, composed by several decision rules. Thus, based on the extraction of the distribution of the many flows embedded in a FG it is possible to induce a classifier.
As previously pointed out in this paper, although one can find in the literature research works related to the use of FGs, the formalism and its associated procedures are not as frequently used in applications as the most popular machine learning algorithms are.
FGs, as originally proposed, are not able to handle continuous-valued attributes and, as such, have a very limited scope of use in real-world applications. This paper describes an extension of the original FG structure into a structure named Hybrid Flow Graphs (HFG), suitable for dealing with continuous-valued attributes. The HFG structure is induced using a process that first implements a procedure for discretizing the input data set, followed by an inductive procedure that constructs the flow graph. In continuous-valued domains an induced HFG is structurally much more condensed and can summarize better the data flow distribution.
The results obtained with the use of a computational system, the EFLOWG, that implements the induction of FGs and the extraction of classifiers from FG-based structures, can be considered very promising. In approximately half of the data domains used in the experiments, although FG-based results were below those obtained by some of the other four algorithms they have been compared with, in most cases the values obtained by HFGs were close to those obtained by the winner algorithm. This can be considered a positive result, considering that not much research has been invested in improving FGs yet, as far as the literature in the area is concerned. Although the results of the experiments conducted on attribute ordering were not conclusive, we believe that more research should be conducted in relation to the digraph structure itself, which does not allow for much flexibility in relation to connecting attribute values sequentially.
The rigidity of the current approach for inducing FG-based structures could be flexed by implementing a genetic algorithm based process which would conveniently (depending on the data) compose path structures which not necessarily involve all attributes present in the data. FG-based structures could also be improved by using feature selection algorithms [7, 30] as well as benefit from dealing with outliers [31], as the first step of the process of inducing such structures and, from them, classifiers. The EFLOWG computational system was developed during the research work described in [9].
Footnotes
Acknowledgments
The authors thank UNIFACCAMP and CNPq for their support as well as the anonymous reviewers for their suggestions that helped improving our previous work on FGs. The second author is grateful to CAPES for the scholarship during the period of his studies. This study was financed in part by the Coordenação de Aperfeiçoamento de Pessoal de Nível Superior – Brasil (CAPES) – Finance Code 001.