This article investigates the enhancement of a vector evaluat-ed-based adaptive metaheuristics for solving two multiobjective problems called environmental-economic dispatch and portfolio optimization. The idea is to evolve two populations independently, and exchange information between them, i.e., the first population evolves according to the best individual of the second population and vice-versa. The choice of which algorithm will be executed on each generation is carried out stochastically among three evolutionary algorithms well-known in the literature: PSO, DE, ABC. To assess the results, we used an established metric in multiobjective evolutionary algorithms called hypervolume. Tests solving the referred problem have shown that the new approach reaches the best hypervolumes in power systems comprised of six and forty generators and five different datasets of portfolio optimization. The experiments were performed 31 times, using 250, 500, and 1000 iterations in both problems. Results have also shown that our proposal tends to overcome a variation of a hybrid SPEA2 compared to their cooperative and competitive approaches.
Real-world problems, such as the environmental-economic dispatch problem, are naturally multiobjective problems (MOP), i.e., hence conflicting objective functions devise them. We mean conflicting objective functions because the improvement in one function leads to worsening the other one; otherwise, the problem’s solution would be a single point in the search space, which is not precisely challenging in the context of solving real-world problems.
Thus, considering that we have two or more conflicting objective function to optimize, classical methods have demonstrated not suitable to solve this kind of optimization problem due to three main reasons: (i) functions must be differentiable, (ii) usually real-world problems comprise several variables, and (iii) classical methods do not handle constraints.
In this context, multiobjective evolutionary and swarm algorithms (MOEA) appear as attractive approaches to tackle MOPs. Historically, the first MOEA appeared in 1985 [1] when the Vector Evaluated Genetic Algorithm (VEGA) was proposed. Since then, many MOEAs have been proposed such as NSGA-II [2], SPEA2 [3], VEABC [4], AVEMH [5], etc. We highlight the vector evaluated MOEA, which evolves independent sub-populations (one per objective) and exchange information between these algorithms. Particularly, we focus on the AVEMH that is an adaptive metaheuristic that stochastically chooses which algorithm (DE [6], PSO [7], or ABC [8]) to use on each sub-population.
The stochastic adaptation has been successfully used in many algorithms, such as [9, 10, 11, 12, 13, 14]. Thus, this work is an extension of Correa et al. [15] in which we investigate a modification of the AVEMH for solving the environmental-economic dispatch problem. In the original AVEMH, the sub-populations exchange the best individuals, working similarly to the VEPSO.
In our approach, the exchanged best solutions can come from the archive or the current metaheuristic population, depending on the domination of each individual. Furthermore, in this extension, we additionally solve the portfolio optimization problem using five different datasets Hong Kong Hang Seng (HST), German Dax 100 (DAX), British FTSE 100 (FTSE), US S&P 100 (S&P), and Japanese Nikkei (Nikkei).
The Economic Dispatch (ED) [16] can be considered as one of the essential tools in the operation of power systems [17]. The purpose of the problem is to attend to a demand for power at the lowest possible cost of energy generation. Due to environmental regulations, the problem was extended to minimize pollutants’ emission costs, conceiving the environmental-economic dispatch problem.
The Portfolio Optimization seeks to discover the best trade-off between the expected return and risk, i.e., we want to determine a set of assets, and their respective portfolio participation weights, which satisfy the investor concerning the combination of risk-return binomial [18]. In other words, when someone wants to make a financial investment, it is advisable to look for compromise solutions between risk and return [19], i.e., maximize the return while minimizing the risk.
In this context, this paper is divided as follows: in Section 2, we formalize the multiobjective problem and present both the environmental-economic dispatch and the portfolio optimization problem; in Section 3, we detail the three metaheuristics we used and how the enhanced proposal works; Section 4 presents the experiment configuration and results on both problems; finally, Section 5 shows the conclusions and future work.
Multiobjective problems (MOPs)
Unlike single-function optimization, in which the algorithm must seek solutions only in the search space, in the multiobjective approach, the search also happens in the objective space, i.e., the algorithm also looks for the best trade-off between objectives. In order to do so, we have to map a solution in the search space into a solution in the objective space as presented in Fig. 1, devising a Pareto frontier.
Mapping from the search space to the objective space.
All in all, a MOP can be expressed as presented in Eq. (1), in which is the number of objective functions, is the solution’s dimension, is the number of unequal constraints, is the number of equal constraints, and and are lower and upper boundaries, respectively.
As previously mentioned, a MOP must deal with two or more conflicting objective functions simultaneously. One of the approaches to dealing with MOPs is the domination strategy, in which the algorithms guide their evolution using non-dominated solutions. Mathematically, we can say that a solution dominates a solution , expressed by , if is not worse than in all objective functions, and is strictly better than in at least one objective.
The environmental-economic dispatch problem
Having presented what is a MOP, we can formalize the environmental-economic dispatch problem (EEDP) as expressed in Eq. (2.1), in which is the generation cost, is the emission cost, is the demanded power, represents the power produced by the generator, and and are the generation boundaries of the generator, respectively. The variables , , , , , and are generation and emission constants that depend on the system that we are dealing with.
In other words, the purpose of the EEDP is to produce a demanded power (), minimizing the production cost and emission cost at the same time, obeying the energy production limits expressed by . Next, we formalize the portfolio optimization problem.
Portfolio optimization
The classical Markovitz’s model for portfolio optimization assumes that investors either want to maximize the return within a certain risk level or minimize the risk within a return level. This model is known as mean-variance because it employs statistics on normalized prices’ historical to compute the return and the expected risk for a particular portfolio [20].
The risk is evaluated using the variance of a portfolio’s return. It depends on how individual assets vary the return and how they change in each other’s relation. Thus, the covariance matrix obtained by gathering the returns is additional information to the expected return [21]. Therefore, portfolio optimization will always consider two conflicting objectives, i.e., maximize the expected return and, at the same time, minimize the portfolio’s variance [21] (minimizing the risk).
Formally, Eq. (2.2) presents the Markovitz’s model, in which aims to minimize the risk and aims to maximize the return. The variable is the number of assets in the portfolio, i.e., the problem’s dimension, is the weight associated to the asset, is the deviation of the risk, and is the covariance between assets and . If , then depicts the variance of a particular asset, is the mean of the return, and is the mean of an individual stock [20].
Thus, the Pareto frontier represents the portfolios that provide the maximum expected return given a certain risk level. Hence, selecting the “best” portfolio is impossible because each solution represents a different trade-off between risk and return. Therefore, an expert in the field must execute the portfolio selection that will evaluate all the trades-off.
Metaheuristics
Metaheuristics are algorithms that coordinate global and local search using strategies to avoid local minima in complex search spaces [22]. All in all, a metaheuristic must balance the ability to explore and exploit the search space. Otherwise, the results can be sub-optimum or even ineffective.
Usually, metaheuristics are suitable for problems that we have little or no information about or are impossible to solve using enumerative algorithms due to their time complexity. Thus, next, we detail the three metaheuristics that we used in our proposal.
PSO
The PSO was proposed by Kennedy and Eberhart [7]. It is based on the social behavior of birds, called particles, while looking for food sources. A set of particles is called swarm, that is the reason why the algorithm belongs to the field of swarm intelligence. Mathematically, consider a swarm_size as the number of particle. Thus, a particle is a position in the search space such that , in which , , and is the number of variables of the problem also known as dimension. Further, particles move in a certain velocity .
In this context, Eqs (4) and (5) determine the new position of particles, in which is the inertia weight, and are acceleration constants, and are random number within , is the best position reached by the particle, and is a vector that stores the position of the global optima, i.e., always store the best solution found by the algorithm. Thus, as we can see, each particle moves combining some aspects of its historical position and the best solution.
Algorithm 3.1 outlines how PSO works. Let us assume that all operations are vectorized, avoiding the structure, which is interesting for R, Julia, Python with Numpy, and Matlab programmers. Initially, the swarm is created at random, in which each dimension , lower bound and upper bound, respectively. In the same sense, ; otherwise, the velocity can explode, making the algorithm loses the ability to do exploration and exploitation.
Initially, the historical matrix is equal to the first swarm; consequently, the fitness of is the same as the fitness variable, and is the best solution in the same vector. Next, we update the velocity and compute the particles’ new position. Then, it is necessary to verify if the new location and the velocity disobey the boundaries. If so, the respective dimension and velocity have to be fixed. If the velocity explodes a new one is chosen in the interval . After verifying the boundaries, the historic and the best solution must be updated in , , , and , respectively, if required.
ABC
The artificial Bee Colony (ABC) was proposed by Karaboga and Basturk [8] in 2007. It is based on the behavior of bees seeking food. To make the seeking, there are three types of behaviors: (i) searching food sources, (ii) exploring known sources, and (iii) abandon depleted sources.
Consequently, there are three kinds of bees: workers, onlookers, and scouts. Workers or employees know the food coordinate, i.e., each one knows a single coordinate that can be shared with onlookers bees in order to look for new sources around the known solution.
Then, when a source is exhausted, the bee responsible for this source is transformed into a scout one that seeks new food sources randomly [23]. Computationally, a food source or coordinate represents a solution, and the nectar quality corresponds to the solution quality or fitness. In this context, Algorithm 3.2 represent the behavior of those bees.
[t!] Artificial bee colony Initialize population parameters;
(Stop Criterion is FALSE)
Put a worker in a food source;
Send onlookers to food sources to seek new sources;
Send scouts to seek new sources randomly;
Update the best source so far;
Each iteration consists of send workers to a food source to assess the quality of nectar. This behavior is equal to obtaining the fitness of a solution. Then, the algorithm selects which sources and the respective amount of nectar will be shared with onlookers. Knowing the nectar level, it is possible to define which onlookers will be converted into scout bees that will look for new food sources.
Next, workers return to their coordinates and search for new sources using their visual information, a local search in the neighborhood. The onlooker will then decide their sources based on the quality of the nectar shared by the workers. The higher the nectar quality, the higher the probability of being chosen by an onlooker bee. In the method proposed by Karaboga & Basturk, only one scout bee can look for food on each iteration, and the amount of workers and onlookers is the same.
Equation (6) depicts the visual inspection performed by bees, in which is a random number between one and the number of workers in the swarm, is a random number between one and the dimension of the problem (), and is a random number within .
Zhu and Kwong [24], inspired by PSO, proposed an improvement in the visual inspection as shown in Eq. (7), in which is the best solution and is a random number within , where is a non-negative constant. Regardless of which equation is used in the visual inspection, the previous food source is considered depleted if the new source presents a better nectar quality.
As previously mentioned, onlookers decide which sources to go to based on some probability, which is expressed by Eq. (8), in which is the fitness, is the onlooker bee, and varies from 1 to the number of worker bees . After choosing the food source, the onlookers produce a modification in their solutions using their visual inspection. Either, they abandon the previous source if the new nectar quality is better than the preceding one.
Further, when is out of boundaries, the needs to be reset. Furthermore, any food source that does not improve after a pre-defined number of iterations must be discarded. Thus, new solutions can be explored even if the new nectar quality is lower than the abandoned ones.
[t!] Differential evolution algorithm Initialize Pop randomly;
The DE algorithm was proposed by Storn and Price [25] in 1995. It is based on the difference between two individuals, which is summed up to a third one as shown in Algorithm 3.2. Thus, assuming that Pop is a matrix comprising individuals such that , the first step is to create a population randomly. Then, while the stop criterion is not reached, the vector of differences is calculated according to the Eq. (9), where is the index of three randomly chosen solutions, and is a multiplication factor normally between 0 and 1. This strategy is called DE/Rand/1/bin because is randomly chosen. When is the best individual in the population, the strategy is named DE/Best/1/bin.
The process of computing is called a mutation. Afterward, a new individual is created similarly to the discrete crossover of genetic algorithms, i.e., for each dimension a gene is chosen from the vector of differences with a probability of CR, or from the target individual with a probability of . Finally, if the fitness of the new individual is better than the fitness of the target one, then the new individual, called indiv, replaces the individual in the population .
Our proposal: The enhanced AVEMH
The AVEMH be considered as a cooperative hybrid metaheuristic whose pseudo-code is shown in Algorithm 3.4. Firstly, the algorithm initializes an empty archive, the probabilities, and populations (one population per function). The probabilities are initialized uniformly, i.e., 1/3 or 33% for each metaheuristic.
[t!] AVEMH pseudo-code
(Not Stop_Condition)
After the initialization, while the stop criterion is not reached, one metaheuristic per function is chosen to tackle each population. Then, the best individual of is sent to and vice-versa. Thus, if the AVEMH uses PSO in , the particle’s velocity will be updated using as the best solution () and vice-versa. It is essential to notice that if the algorithm uses DE, the mutation strategy must be DE/Best/01 or any strategy based on the best individual, such as DE/Best/02, DE/Rand-to-Best/01, for example. In this work, we use the DE/Best/01 strategy. Finally, if the AVEMH is using the ABC, will represent the best nectar.
Then, after executing the respective metaheuristics, the following comparison is made: if the best individual from dominates the current best solution from , the probability of the metaheuristic that sent the best individual is increased by an improve_factor, while an step_factor decreases the other probabilities; otherwise, the probability is decreased by an improve_factor, and an step_factor increases the other probabilities.
Both, the improve_factor and the step_factor are presented in Eq. (10). Afterward, the population needs to evaluate the opposing objective function, i.e., needs to compute the value of and must compute the value of to join all solutions with the archive. Finally, the archive is updated with all non-dominated solutions found in the current iteration.
As we can see, the best individuals are picked up from the current population in the original AVEMH. Thus, we proposes a new way of choosing the best individuals. Considering as the best fitness of and as the best fitness of , both in the archive. Then, when wants to send to , first is compared to regards the dominance. If then sends to , otherwise sends to . If and are non-dominated solutions, sends that one with the best generation cost, and vice-versa. The Algorithm 3.4 shows the procedure for .
[t!] E-AVEMH exchanging individuals
The way around comparison is done when wants to send the best individual to . Next, we present the experiments performed using our proposal in both environmental-economic dispatch and portfolio optimization.
Experiments
All experiments were executed 31 times in an Intel Core i5 2.5 GHz, 8 GB of RAM, and Windows 8.1 64 bits using 250, 500, and 1000 iterations. The parameters for each metaheuristic were suggested in Leticia’s et al. work [5]: PSO ; ABC survivors 90%; and DE; . The E-AVEMH is compared to the original AVEMH and two approaches of a modern modified SPEA2 [26].
In the EEDP, we used two power systems comprising 6 and 40 generators. Their configurations can be obtained in Costa’s work [26]. We defined a demand () of 500 and 700 MW in the system with six generators and 10500 MW in the system with 40 generators. We use a penalty function that attributes the value to individuals who do not attend the demand constraint in 500 and 700 MW cases, while the penalty value for not providing the demand of 10500 MW is .
Regarding the portfolio optimization, we used five datasets: Hong Kong Hang Seng (HST), German Dax 100 (DAX), British FTSE 100 (FTSE), US S&P 100 (S&P), and Japanese Nikkei (Nikkei). These datasets comprise 63, 85, 89, 98, and 225 assets, respectively, and they present the standard deviation and the average expected return.
The HST is the main index of the Honk Kong stock market [27]. The DAX index comprises the largest companies in Frankfurt’s stock market [28]. The FTSE is formed by the 30 biggest open-capital companies from United Kingdom [29]. The S&P 100 covers 101 companies that negotiate assets in NYSE and NASDAQ market [30]. Finally, Nikkei is the main index from Tokyo’s stock market [31]. The optimum Pareto frontier for all datasets can be found in http://people.bru-nel.ac.uk/ mastjjb/jeb/orlib/portinfo.html.
Hypervolume for 250, 500, and 1000 iterations with 500 and 700 for 6 generator
#It
Mean HV
SD
#Archive solutions
E-AVEMH
500 MW
250
70.34
30.70
532
500
69.18
19.89
676
1000
78.19
11.31
797
AVEMH
500 MW
250
65.40
3.54
311
500
68.16
2.21
283
1000
71.32
1.29
512
#It
Mean HV
SD
#Archive solutions
E-AVEMH
700 MW
250
3642.96
110.56
383
500
3744.65
61.42
721
1000
3840.24
30.70
877
AVEMH
700 MW
250
3617.86
81.15
162
500
3736.50
41.92
244
1000
3818.78
36.51
352
Hypervolume for 250, 500, and 1000 iterations with 10500 for 40 generators
#It
Mean HV
SD
#Archive solutions
E-AVEMH
10500 MW
250
8.46E7
1.56E7
134
500
1.03E8
9.92E6
200
1000
1.40E8
1.12e7
280
AVEMH
10500 MW
250
3.26E7
1.23E7
67
500
5.00E7
1.51E7
63
1000
6.19E7
1.15E7
91
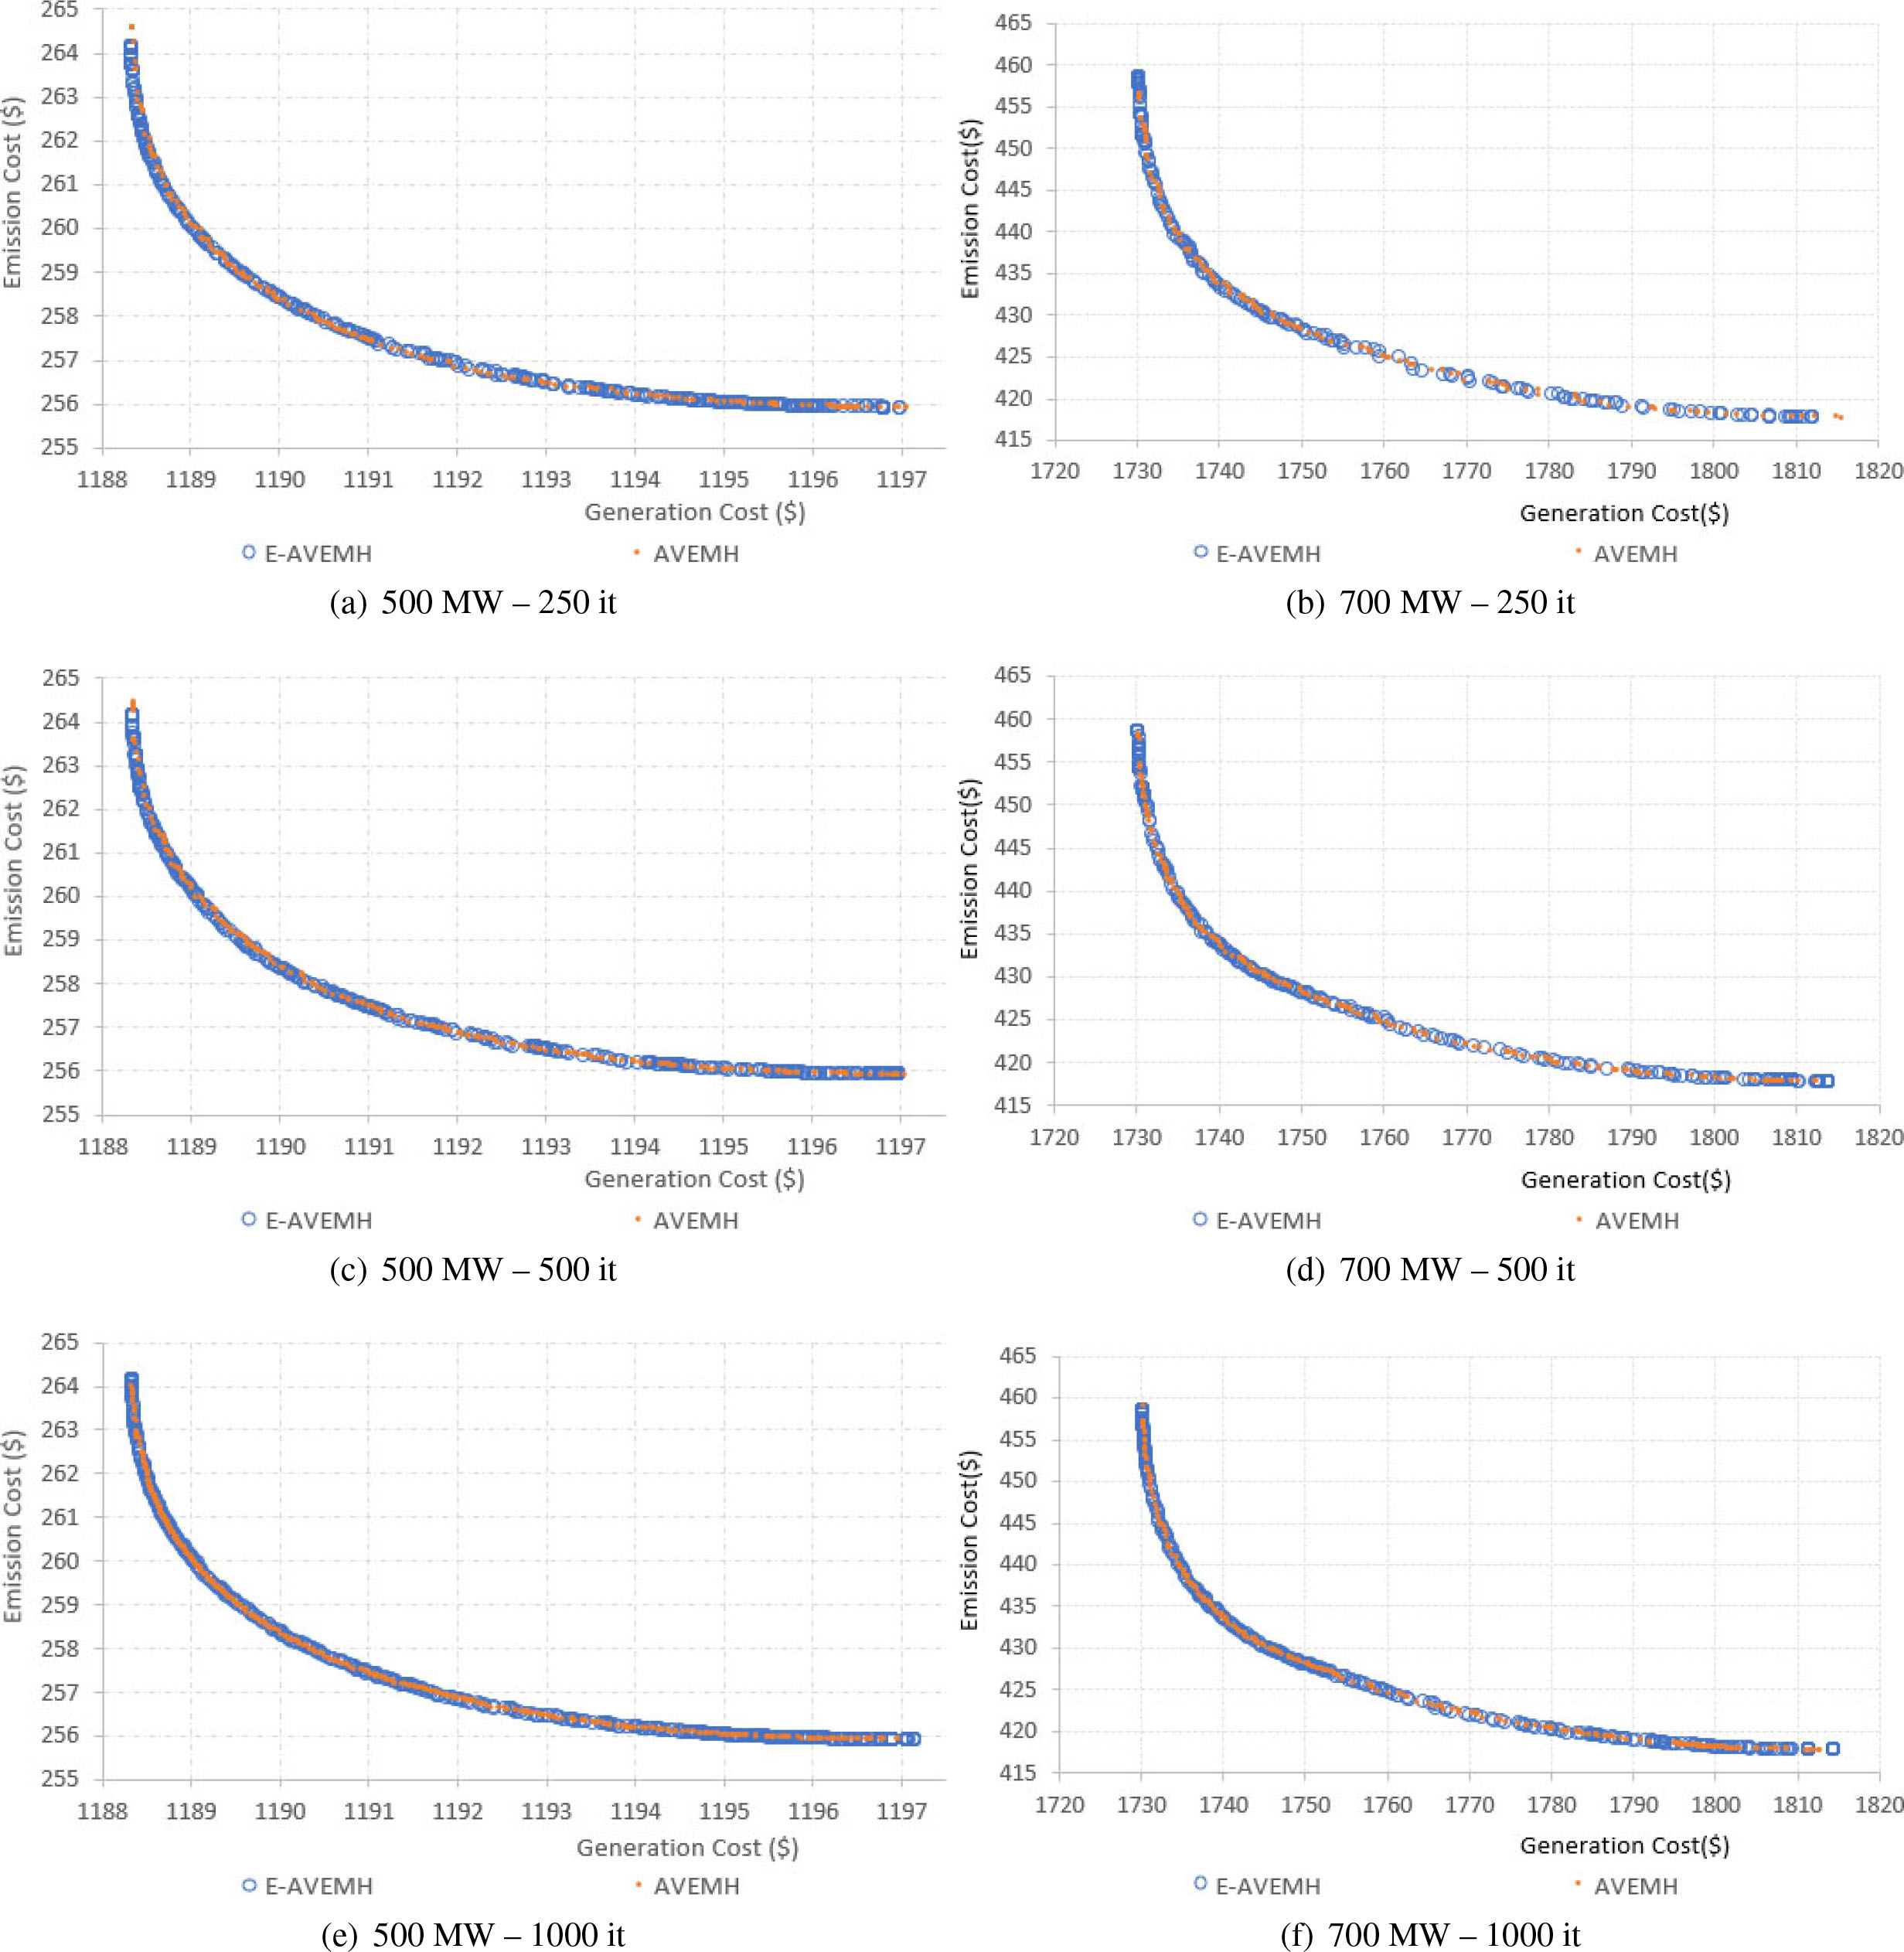
Pareto frontier as we increases the iteration number in E-VEMH – 6 generators.
Environmental-economic dispatch
Table 1 presents the results of the mean hypervolume, standard deviation, and the number of solutions as we increase the iteration count for the six generators system. As expected, both the hypervolume and the number of solutions in the archive increase as we raise the iteration count in both demands 500 and 700 MW. We can also see that the E-AVEMH performs better than the original AVEMH in the mean hypervolume and number of solutions.
Figure 2 shows the final Pareto frontier of the E-AVEMH and the original AVEMH for 500 MW (a, c, and e) and 700 MW (b, d, and f), respectively, as we increase the iteration count. As we can observe, visually, the frontiers are similar; however, the differences in hypervolumes presented previously might indicate that E-AVEMH produces better Pareto frontiers.
Hypervolume: E-AVEMH vs AVEMH vs cooperative and competitive SPEA2 Using 1000 iterations
6 generators
E-AVEMH
AVEMH
Cooperative SPEA2
Competitive SPEA2
500 MW
78.19
49.17
62.28
64.71
700 MW
3840.24
3818.78
3369.37
3828.38
40 generators
E-AVEMH
AVEMH
SPEA2 cooperativo
SPEA2 competitivo
10500 MW
1.40E8
6.19E7
9.5157E7
1.2590E8
Best solutions – E-AVEMH vs. AVEMH vs SPEA2 approaches
500 MW
E-AVEMH
AVEMH
Cooperative SPEA2
Competitive SPEA2
Gen.
($1188,33; $264,14)
($1188,34; $264,17)
($1188.36, $264.363)
($1188.43, $264.569)
Emis.
($1197,15; $255,92)
($1197,05; $255,92)
($1197.11, $255.93)
($1197.37, $255.947)
700 MW
E-AVEMH
AVEMH
Cooperative SPEA2
Competitive SPEA2
Gen.
($1730,23; $458,38)
($1730,31; $456,61)
($1736.76, $469.647)
($1731.82, $469.213)
Emis.
($1813,82; $417,75)
($1816,09; $417,77)
($1810.72, $417.901)
($1816.46, $418.417)
10500 MW
E-AVEMH
AVEMH
Cooperative SPEA2
Competitive SPEA2
Gen.
($118660,27; $18046,15)
($118911,08; $18184,23)
($120368, $17877)
($120368, $17877)
Emis.
($155311,48; $14527,95)
($155906,69; $14630,46)
($164647, $15071.5)
($176281, $14959.9)
Pareto frontier as we increases the iteration number in E-AVEMH vs AVEMH – 40 generators.
Hypervolume of AVEMH for HST, DAX, FTSE, S&P 100, and Nikkei 225 as iteration count increases
Problem
#it
Mean HV
SD
#ArchiveSolutions
HST
250
1.40E-05
2.52E-06
78
500
1.45E-05
2.13E-06
94
1000
1.45E-05
1.30E-06
123
DAX
250
3.66E-06
3.10E-07
48
500
2.33E-05
4.09E-07
52
1000
3.84E-06
3.45E-07
56
FTSE
250
2.92E-06
2.49E-07
61
500
2.99E-06
3.02E-07
69
1000
3.09E-06
2.93E-07
80
S&P
250
4.58E-06
5.51E-07
79
500
4.46E-06
4.14E-07
77
1000
4.65E-06
2.46E-07
92
Nikkei
250
1.29E-06
1.72E-07
10
500
1.38E-06
2.04E-07
10
1000
1.42E-06
1.74E-07
14
Hypervolume of E-AVEMH for HST, DAX, FTSE, S&P 100, and Nikkei 225 as iteration count increases
E-AVEMH
Problem
#it
Mean HV
SD
#ArchiveSolutions
P31
250
2.46E-05
5.64E-06
82
500
2.48E-05
3.85E-06
104
1000
2.66E-05
4.23E-06
130
P85
250
2.34E-05
3.09E-07
62
500
2.34E-05
2.78E-07
73
1000
2.35E-05
2.69E-07
86
P89
250
9.06E-06
2.36E-07
73
500
9.14E-06
1.92E-07
76
1000
9.18E-06
2.02E-07
102
P98
250
1.20E-05
3.88E-06
79
500
1.31E-05
3.08E-06
82
1000
1.47E-05
3.16E-06
99
P225
250
1.41E-06
8.95E-07
14
500
1.42E-06
9.06E-07
28
1000
1.56E-06
6.94E-07
33
Regarding 40 generators, Table 2 shows the mean hypervolume, the standard deviation, and the number of solutions for a system comprising 40 generators. As expected, the mean hypervolume and the number of solutions in the archive increases as we raise the iteration count. Furthermore, being a more complex problem, we can see how the E-AVEMH outperforms the original AVEMH.
Figure 3 shows the final Pareto frontier, in which we can visually observe that the E-AVEMH tends to dominate the other Pareto frontiers. Moreover, 500 and 1000 iterations of the E-AVEMH seem to present similar Pareto frontiers; however, the difference in terms of hypervolume presented in Table 2 indicates that 1000 iteration tends to present the best Pareto frontier.
Final Pareto frontier of E-AVEMH, AVEMH, and cooperative and competitive SPEA2 for 40 generators – 10500 MW demand.
As E-AVEMH overperformed the original AVEMH, next, we compare the results of our proposal to an adaptive SPEA2. The cooperative and competitive SPEA2 [26] is a parallel hybrid algorithm that uses PSO, GA, and DE for moving the solutions around the search space. The parallelism does not decrease the quality of solutions because it works in the metaheuristics search process rather than dividing the number of iteration between slaves. PSO, GA, and DE change populations independently and compete for being used in the next iteration in the competitive approach. The winner population is chosen based on the hypervolume.
In the cooperative SPEA2, all populations are gathered together, and then the algorithm selects the population using a cluster-based algorithm that tends to select only non-dominate solutions. In this context, Table 3 presents the mean hypervolume of each algorithm. As we can see, the E-AVEMH shows the best hypervolume in both systems (six and forty generators).
Regarding extreme solutions, Table 4 presents the extreme point of each axis using 1000 iterations. As we can notice, the E-AVEMH tends to always present non-domination solutions considering the best emission. In other words, the solution ($1188,33; $264,14) dominates the other one from SPEA2 regarding the best generation cost solution in 500 MW. Concerning 700 MW, all solutions tend to be non-dominated ones. Finally, regarding the most complex system (forty generators), the best emission cost of E-AVEMH ($155429,34; $14543,42) tends to dominate the other solutions.
Finally, Figure 4 shows the final Pareto frontier obtained by E-AVEMH, AVEMH, and Cooperative/Com- petitive SPEA2, in which we can see how E-AVEMH produces the best Pareto frontier.
Hypervolume: E-AVEMH vs AVEMH vs Cooperative and Competitive SPEA2 Using 1000 iterations
E-AVEMH
AVEMH
SPEA2 –
Cooperative
SPEA2 – Competitive
HST
2.66E-05
1.45E-05
2.05E-05
1.85E-05
DAX
2.35E-05
3.84E-06
1.46E-05
1.32E-05
FTSE
9.18E-06
3.09E-06
4.81E-06
4.74E-06
SP
1.47E-05
4.65E-06
1.13E-05
1.02E-05
Nikkei
1.56E-06
1.42E-06
2.19E-06
3.00E-06
Pareto frontier in E-AVEMH – portfolio optimization using 1000 iterations.
Best solutions – E-AVEMH vs AVEMH vs SPEA2 approaches
HST
E-AVEMH
AVEMH
Cooperative SPEA2
Competitive SPEA2
Risk
(0.000679; 0.002978)
(0.000679; 0.002978)
(0.000764; 0.002775)
(0.000785; 0.003460)
Return
(0.004775; 0.010865)
(0.004775; 0.010865)
(0.004761; 0.010852)
(0.004766; 0.010857)
DAX
E-AVEMH
AVEMH
Cooperative SPEA2
Competitive SPEA2
Risk
(0.000202; 0.002375)
(0.000189; 0.001774)
(0.000228; 0.001343)
(0.000218; 0.002010)
Return
(0.002835; 0.009794)
(0.002835; 0.009794)
(0.002828; 0.009784)
(0.002817; 0.009785)
FTSE
E-AVEMH
AVEMH
Cooperative SPEA2
Competitive SPEA2
Risk
(0.000272; 0.003326)
(0.000238; 0.002438)
(0.000270; 0.003174)
(0.000263; 0.002979)
Return
(0.001516; 0.008209)
(0.001453; 0.008062)
(0.001515; 0.008205)
(0.001512; 0.008197)
S&P 100
E-AVEMH
AVEMH
Cooperative SPEA2
Competitive SPEA2
Risk
(0.000155; 0.002060)
(0.000160; 0.002464)
(0.000178; 0.002533)
(0.000189; 0.003055)
Return
(0.002938; 0.009195)
(0.002198; 0.009067)
(0.002914; 0.009173)
(0.002933; 0.009192)
Nikkei 225
E-AVEMH
AVEMH
Cooperative SPEA2
Competitive SPEA2
Risk
(0.000409; 0.000497)
(0.000445; 0.000831)
(0,000452; 0,00007)
(0,000523; 0,000019)
Return
(0.001460; 0.003801)
(0.000844; 0.002819)
(0.001623; 0.003959)
(0.001622; 0.003911)
Portfolio optimization
Tables 5 and 6 present the results of the mean hypervolume, standard deviation, and the number of solutions as we increase the iteration count for the five datasets in each algorithm (AVEMH and E-AVEMH), respectively. As we can see, the E-AVEMH performs better in all five datasets (HST, DAX, FTSE, S&P, and Nikkei) in hypervolume and number of solutions.
Figure 5 shows the final Pareto frontier for 1000 iterations, in which we can visually observe that the E-AVEMH tends to dominate the other Pareto frontiers getting close to the real Pareto one, especially in the datasets HST, DAX, TFSE, and S&P. In the Nikkei dataset E-AVEMH tends to present the best Pareto frontier as well, even though the best results are not that close to the actual Pareto one as presented in other datasets.
As done in the previous experiment, a comparison between all algorithms (E-AVEMH, AVEMH, and the Hybrid SPEA2) using 1000 iterations can be seen in Table 7. As we can observe, the E-AVEMH presents better results than the other referred algorithms in all datasets.
Next, we present some extreme solutions in the format (Risk, Return) on each dataset in Table 8. All in all, these extreme solutions tend to be non-dominated ones. Thus, the main differences are in the central portion of the Pareto frontier, in which the best trade-offs are localized, as we can see in Fig. 5.
Conclusions
This work presented an enhanced adaptive vector-evaluated metaheuristic (E-AVEMH), a cooperative hybrid multiobjective evolutionary/swarm algorithm for solving real-world problems. In the experiments, two problems were addressed, the environmental-economic dispatch and the portfolio optimization using 250, 500, and 1000 iterations.
The proposed algorithm, E-AVEMH, evolves independent sub-populations and chooses which metaheuristic (PSO, DE, and ABC) to use on each sub-population in execution time. Our enhancement allows the algorithm to decide which element to send to the opposite sup-population based on a dominance comparison between the best individual on each sub-population and the best solution using the respective function in the archive, sending the non-dominated one. Results have shown that the enhanced algorithm tends to overperform the original AVEMH.
Further, a comparison against a hybrid SPEA2 in the 40 generators system and the five portfolio optimization datasets showed that the E-AVEMH leads to overperform the SPEA2, reaching higher hypervolumes and producing a better Pareto frontier, even though some extreme solutions seems to be better in SPEA2.
Future work includes: (i) a parallel version of E-AVEMH, then the sub-populations execute their metaheuristics in parallel using MPI, OpenMP, or C-CUDA; (ii) introducing more constraints making the environmental-economic dispatch problem more challenging to solve; (iii) creating a fuzzy decision system to decide which solution to send to other sub-populations; and, last but not least, (iv) proposing a way of using the vector evaluation approach for problems with three or more objects.
DebK.PratapA.AgarwalS. and MeyarivanT., A fast and elitist multiobjective genetic algorithm: NSGA-II, Trans Evol Comp6(2) (2002), 182–197. doi: 10.1109/4235.996017.
3.
ZitzlerE.LaumannsM. and ThieleL., SPEA2: Improving the strength pareto evolutionary algorithm for multiobjective optimization, in: Proceedings of the EUROGEN’2001, Evolutionary Methods for Design, Optimization and Control with Applications to Industrial Problems, vol. 3242, 2001.
4.
OmkarS.N.SenthilnathJ.KhandelwalR.NaikG.N. and GopalakrishnanS., Artificial Bee Colony (ABC) for multi-objective design optimization of composite structures, Applied Soft Computing11(1) (2011), 489–499. doi: 10.1016/j.asoc.2009.12.008. http://www.sciencedirect.com/science/article/pii/S1568494609002622.
5.
CortesO.A.C.Corrêa CostaL.F. and CostaJ.P.A., Uma nova meta-heurística adaptativa baseada em vetor de avaliações para otimização de portfólios de investimentos, Inteligencia Artificial22(64) (2019), 85–101.
6.
StornR. and PriceK., Differential evolution – a simple and efficient heuristic for global optimization over continuous spaces, Journal of Global Optimization11(4) (1997), 341–359. doi: 10.1023/A:1008202821328.
7.
KennedyJ. and EberhartR., Particle swarm optimization, in: Proceedings of ICNN’95 – International Conference on Neural Networks4(4) (1995), 1942–1948. doi: 10.1109/ICNN.1995.488968.
8.
KarabogaD. and BasturkB., A powerful and efficient algorithm for numerical function optimization: Artificial bee colony (ABC) algorithm, Journal of Global Optimization39(3) (2007), 459–471. doi: 10.1007/s10898-007-9149-x.
9.
CarvalhoE.CortesO.A.C.CostaJ.P. and Rau-ChaplinA., A stochastic adaptive genetic algorithm for solving unconstrained multimodal numerical problems, in: 2016 IEEE Conference on Evolving and Adaptive Intelligent Systems (EAIS), 2016, pp. 130–137. doi: 10.1109/EAIS.2016.7502503.
10.
BorgesH.P.CortesO.A.C. and VieiraD., An adaptive metaheuristic for unconstrained multimodal numerical optimization, in: Bioinspired Optimization Methods and Their ApplicationsKorošecP.MelabN. and TalbiE.-G., eds, Springer International Publishing, Cham, 2018, pp. 26–37. ISBN 978-3-319-91641-5.
11.
CostaJ.P.A.CortesO.A.C. and de Carvalho Ribeiro JúniorE., An adaptative algorithm for updating populations on SPEA2, XII Simpósio Brasileiro de Automação Inteligente – Porto Alegre – RS, 2017.
12.
LuH.L.WenX.S.LanL.AnY.Z. and Xiao-pingX.P.L., A selfadaptive genetic algorithm to estimate JA model parameters considering minor loops, Journal of Magnetism and Magnetic Materials (2015).
13.
XiaoW.WuL.TianX. and WangJ., Applying a new adaptive genetic algorithm to study the layout of drilling equipment in semisubmersible drilling platforms, Mathematical Problems in Engineering (2015).
14.
MirandaR.C.MontevechiJ.A.B. and de PinhoA.F., Development of an adaptive genetic algorithm for simulation optimization, Acta Scientiarum: Technology37(3) (2015).
15.
CostaL.d.F.C.CortesO.A.C. and CostaJ.P.A., An enhanced auto adaptive vector evaluated-based metaheuristic for solving the environmental-economic dispatch problem, in: Hybrid Intelligent SystemsAbrahamA.HanneT.CastilloO.GandhiN.Nogueira RiosT. and HongT.-P., eds, Springer International Publishing, Cham, 2021, pp. 330–339.
16.
Pereira-NetoA.UnsihuayC. and SaavedraO.R., Efficient evolutionary strategy optimisation procedure to solve the nonconvex economic dispatch problem with generator constraints, IEE Proceedings – Generation, Transmission and Distribution152(5) (2005), 653–660.
17.
Ribeiro JrE.C.CortesO.A.C. and SaavedraO.R., A parallel mix self-adaptive genetic algorithm for solving the dynamic economic dispatch problem, in: VIII Simpósio Brasileiro de Sistemas Elétricos, 2020, pp. 1–6.
18.
MilhomemD.A. and DantasM.J.A.P., Analysis of new approaches used in portfolio optimization: A systematic literature review, Production30 (2020).
19.
MendonçaG.H.M.FerreiraG.G.D.C.CardosoR.T.N. and MartinsF.V.C., Multi-attribute decision making applied to financial portfolio optimization problem, Expert Systems with Applications158 (2020), 113527. https://www-sciencedirect-com-443.web.bisu.edu.cn/science/article/pii/S0957417420303511.
20.
QuB.Y.ZhouQ.XiaoJ.M.LiangJ. and SuganthanP., Large-scale portfolio optimization using multiobjective evolutionary algorithms and preselection methods, Mathematical Problems in Engineering2017 (2017), 1–14. doi: 10.1155/2017/4197914.
21.
YevseyevaI.GuerreiroA.P.EmmerichM.T.M. and FonsecaC.M., A Portfolio optimization approach to selection in multiobjective evolutionary algorithms, in: Parallel Problem Solving from Nature – PPSN XIIIBartz-BeielsteinT.BrankeJ.FilipičB. and SmithJ., eds, Springer International Publishing, Cham, 2014, pp. 672–681. ISBN 978-3-319-10762-2.
22.
CrainicT.G. and ToulouseM., Parallel strategies for meta-heuristics (Capítulo de Livro), in: Handbook of MetaHeuristics, Kluwer Academic Publishers, New York, 2003, pp. 475–513.
23.
KarabogaD. and BasturkB., On the performance of artificial bee colony (ABC) algorithm, Applied Soft Computing8(1) (2008), 687–697. doi: 10.1016/j.asoc.2007.05.007. http://www.sciencedirect.com/science/article/pii/S1568494607000531.
24.
ZhuG. and KwongS., Gbest-guided artificial bee colony algorithm for numerical function optimization, Applied Mathematics and Computation217(7) (2010), 3166–3173. doi: 10.1016/j.amc.2010.08.049. http://www.sciencedirect.com/science/article/pii/S0096300310009136.
25.
StornR. and PriceK., Differential evolution: A simple and efficient heuristic for global optimization over continuous space, Journal of Global Optimization11 (1997).
26.
CostaJ.P.A.CortesO.A.C. and SaavedraO.R., A novel parallel SPEA2 for solving the environmental-economic dispatch problem: Competitive vs cooperative approach, Brazilian Symposium on Electrical SystemsAt: Santo André – SP, 2020.
27.
ReisT., Hang Seng: Saiba mais sobre o principal índice da Bolsa de Hong Kong, Fonte: Suno Research, 2019. https://www.sunoresearch.com.br/artigos/hang-seng/.
28.
Disford, Top 30 companies of Germany in the DAX index 2019, 2019. https://disfold.com/top-companies-germany-dax/.
29.
Disford, Top 30 companies of the UK in the FTSE index 2019, 2019. https://disfold.com/top-companies-uk-ftse/.