



Abstract
Diabetic retinopathy (DR) is one of the worse conditions caused by diabetes mellitus (DM). DR can leave the patient completely blind because it may have no symptoms in its initial stages. Expert physicians have been developing technologies for early detection and classification of DR to prevent the increasing number of patients. Some authors have used convolutional neural networks for this purpose. Pre-processing methods for database are important to increase the accuracy detection of CNN, and the use for an optimization algorithm can further increase that accuracy. In this work, four pre-processing methods are presented to compare them and select the best one. Then the use of a hierarchical genetic algorithm (HGA) with the pre-processing method is done with the intention of increasing the classification accuracy of a new CNN model. Using the HGA increases the accuracies obtained by the pre-processing methods and outperforms the results obtained by other authors. In the binary study case (detection of DR) a 0.9781 in the highest accuracy was achieved, a 0.9650 in mean accuracy and 0.007665 in standard deviation. In the multi-class study case (classification of DR) a 0.7762 in the highest accuracy, 0.7596 in mean accuracy and 0.009948 in standard deviation.
Keywords
Introduction
Diabetic retinopathy (DR) is one of the conditions caused by type 1 and type 2 diabetes mellitus (DM) [1], this condition is the main cause of blurred vision or its complete loss in people who did not receive adequate treatment [2]. A study estimated that in 2030 there will be twice as many people with this disease com-pared to the number of patients in 2010 [3]. That is, it is more likely that there will be twice as many people with a decrease in vision.
There are several issues as to why DR cases have grown so rapidly [4]. The first point is the age at which the disease begins to affect. DM patients with some degree of DR have been detected since the age of 20 years old [5]. Another problem with DR is the small number of people who are trained to detect this disease [6]. Due to this, different computer technologies have been used to help in the detection of this condition and make better decisions for the medical treatment for patients.
The use of artificial neural networks has benefited the detection of different diseases (not only DR) since the beginning of its implementation [7, 8]. Deep learning methods have been used to detect DR, and one of the methods that has offered the best results is convolutional neural networks (CNN) [9]. Satisfactory results can be obtained either by creating an architecture from scratch or by using an existing convolutional neural network model. However, these models have a margin of error, and optimization algorithms are used to reduce it [10], such as: particle swarm optimization and genetic algorithms.
Optimization methods have been used on existing trained CNN models like ResNet for COVID-19 [11, 12] and for CNN model made by scratch for DM classification [13]. Thanks to the promising results, hybrid intelligent systems are used to take advantage of two or more technologies and deep learning methods have greatly benefited, helping to solve different problems that would not have been possible to solve using each technology separately [14, 15].
In this work, the first step was creating four different pre-processing methods for the images of the database to improve the accuracy obtained by the CNN models. Other researchers only focused on the implementation of at most one pre-processing, but pre-processing methods are very important, and this could affect in negative way the final accuracy obtained after train the CNN. Two different CNN models are used with the intention to analyze what happens when are using a few convolution layers or too many of them. Study pre-processing methods could help other authors in the future to create or improve their CNN models.
The second step is the implementation of a hierarchical genetic algorithm to optimize the hyperparameters of the architecture of CNN for the detection of DR. Other research has already implemented genetic algorithms to optimize neural networks models, but with no focus on the detection or classification of diabetic retinopathy.
In Section 2, related work made by different authors are presented. In Section 3, basic concepts are detailed, and examples with figures are shown to fully understand this work. In Section 4, the methods applied in this work are explained and described in detail. In Section 5 the results of the experiments carried out are presented and finally, in Section 6, the conclusions are presented.
Related work
Different works have the same objective of detect and classify diabetic retinopathy. However, it is also important to mention the work of the authors regarding the optimization of convolutional neural networks. In this work, these two technologies were used to fulfill our objective, and it is important to point out that the previous works served as inspiration to our work.
The research carried out by Victor Vives-Boix and Daniel Ruiz-Fernandez consists of carrying out experiments to classify diabetic retinopathy in a binary and multiclass manner [16]. The authors decided to take existing and previously trained convolutional neural network architectures to focus on the classification of diabetic retinopathy, but they did not limit themselves to only using them, but also to modify these models to improve the results obtained.
According to its authors, a bioinspired approach on synaptic meta plasticity in CNN was proposed. This biological phenomenon is known to directly interfere with both learning and memory by reinforcing fewer common events during the learning process. Synaptic meta plasticity has been included in the back propagation stage of a convolution operation for each convolutional layer.
APTOS 2019 database was used with four existing CNN architectures. The results show that convolutional neural network architectures, including synaptic meta plasticity, improve the accuracy obtained. The best results have been obtained for the In-ceptionV3 architecture with synaptic meta plasticity with an accuracy of 95.56% for a binary classification using 3662 images for training and an accuracy of 76.67% for multiclass classification using the same modified architecture.
In the research made by Omar Dekhil et al., they saw a significant increase in patients losing vision due to diabetic retinopathy. In response to this problem, they presented a convolutional neural network-based computer-aided diagnostic tool to classify fundus images into one of five DR stages. The proposed method consisted of first applying a preprocessing to the APTOS 2019 database. The proposed CNN consists of five convolutional layers, each with the ReLU activation function. Finally, three fully connected layers were added [17].
Transfer learning was adopted to minimize overfitting by training the model on a larger dataset of 3.2 million images (i.e., ImageNet database) prior to use of the model in the APTOS 2019 database. The neural network model used to carry out the learning transfer was the VGG 2016. The proposed approach has achieved a test accuracy of 77% (0.7700), which offers, according to its authors, a promising solution for successful early diagnosis and automated staging of DR. No tests for binary classification were performed.
The research carried out by Ashray Bhandare and Devinder Kaur consists of the development of a genetic algorithm with the aim of discovering convolutional neural network architectures that can work without the intervention of an expert technician [18]. In other words, the aim was to automate the process of selecting a convolutional neural network using a genetic algorithm that was responsible for optimizing the hyperparameters of the network.
The database used in this work was that of MNIST, a database of images of the numbers from 0 to 9 written by hand. It is an extension of the “NIST” (National Institute of Standards and Technology) database, acronym of the original authors, however, the images were preprocessed to facilitate the work of the learning algorithms. Due to this change, the letter “M” was added to the database name.
The MNIST database contains 50,000 labeled images that are used to train and validate the convolutional neural network, and another 10,000 images that are not labeled and are normally used for testing. It is one of the most popular databases as it allows researchers to study their proposed methods in a controlled environment. In this work, the genetic algorithm is responsible for optimizing different hyperparameters of the convolutional neural network. Examples taken from MNIST database can be observed on Fig. 1.
Images examples taken from MNIST database.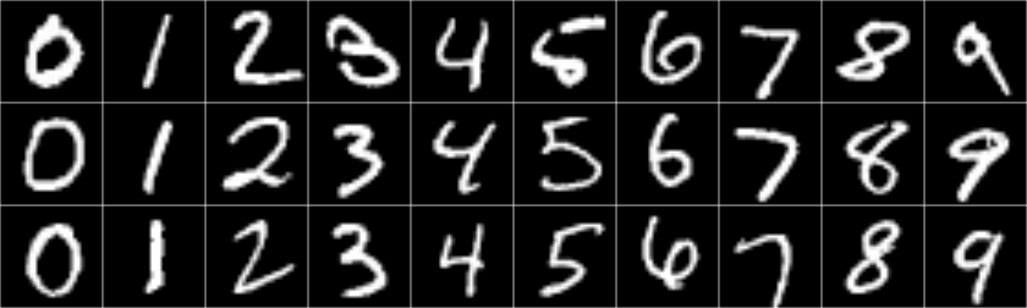
To insert all the values of the table in a chromosome, the authors of this work made the decision to create a binary chromosome, that is, each gene will have only values of 0 or 1. To obtain the decimal values of the ranges shown in the Table 1, several genes are taken according to the maximum value that each hyperparameter can obtain. This means that, to obtain the values of the number of epochs, 7 genes are necessary, while for the size of the filters only 3 genes are required. This representation can be seen in Fig. 2.
Example of the chromosome used to obtain the epochs.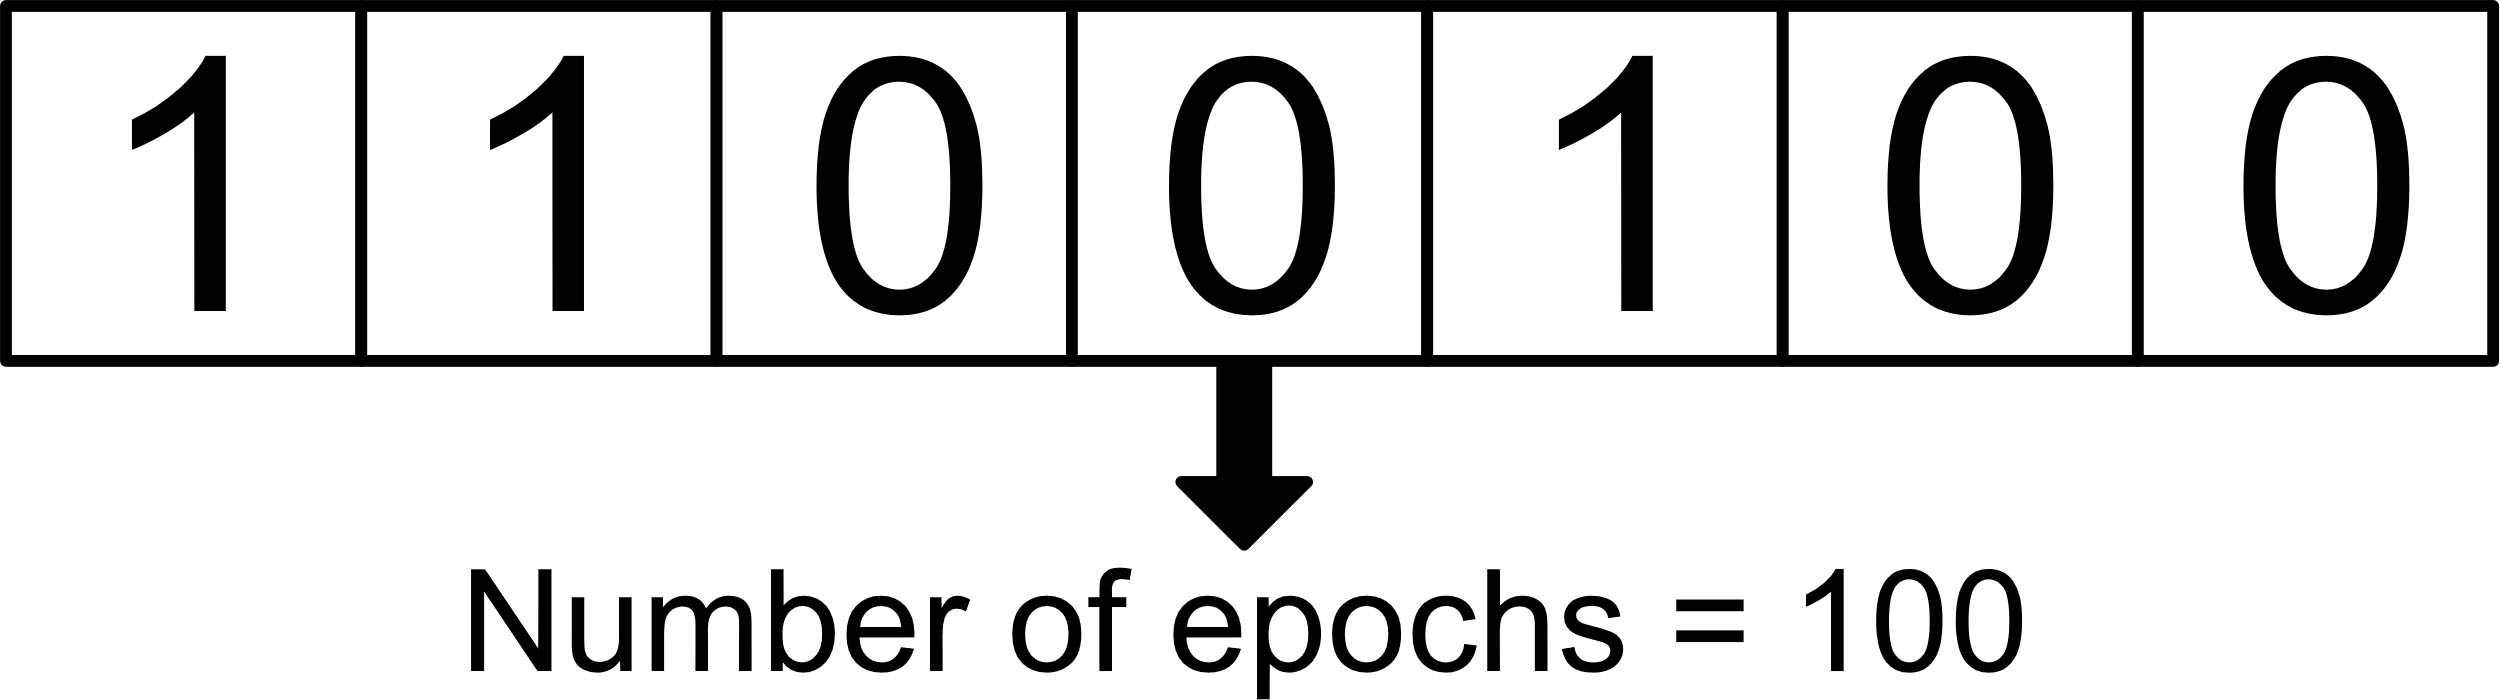
The population size of the genetic algorithm is 10 individuals, and the way to evaluate the fitness of each one is through the precision obtained (value between 0 and 1) of the CNN (created by taking the hyperparameters of the chromosome) with the evidence from the MNIST database.
As properties of the genetic algorithm, for the selection the tournament operation is performed by selection taking two individuals, for the crossing the crossing of a single point with a probability of 50%, and for the mutation the multipoint operation with a probability of 80%. mutating only 10% of the genes.
The genetic algorithm was executed 10 times, obtaining as the highest result a precision of 0.9919. Only the MNIST database was used, but the authors concluded that genetic algorithms have the potential to generate successful convolutional neural network architectures automatically.
In related work are used some method or technologies names, so, for a complete understanding of this work, it is essential to have knowledge of the concepts presented in this section.
Neural networks
Artificial neural networks have served since their creation for the detection of diseases, predictions, and pattern recognition [19]. To detect diseases, neural networks have better results if the network has supervised learning [20]. Super-vised learning means that the database for training the network has the information tagged.
To train a neural network with images is necessary to extract the best features of the images with an expert technician, but there is a kind of neural networks that does not need an expert technician: convolutional neural networks [21]. This network has the capacity of detection and classification of objects, medical dis-eases and more.
The main difference between convolutional neural networks and feed forward neural networks is the use of convolutional layers before the hidden layers [22]. CNNs have hierarchy in their layer, starting with a convolutional layer with an activation function and a MaxPooling layer [23].
Example of the convolutional function.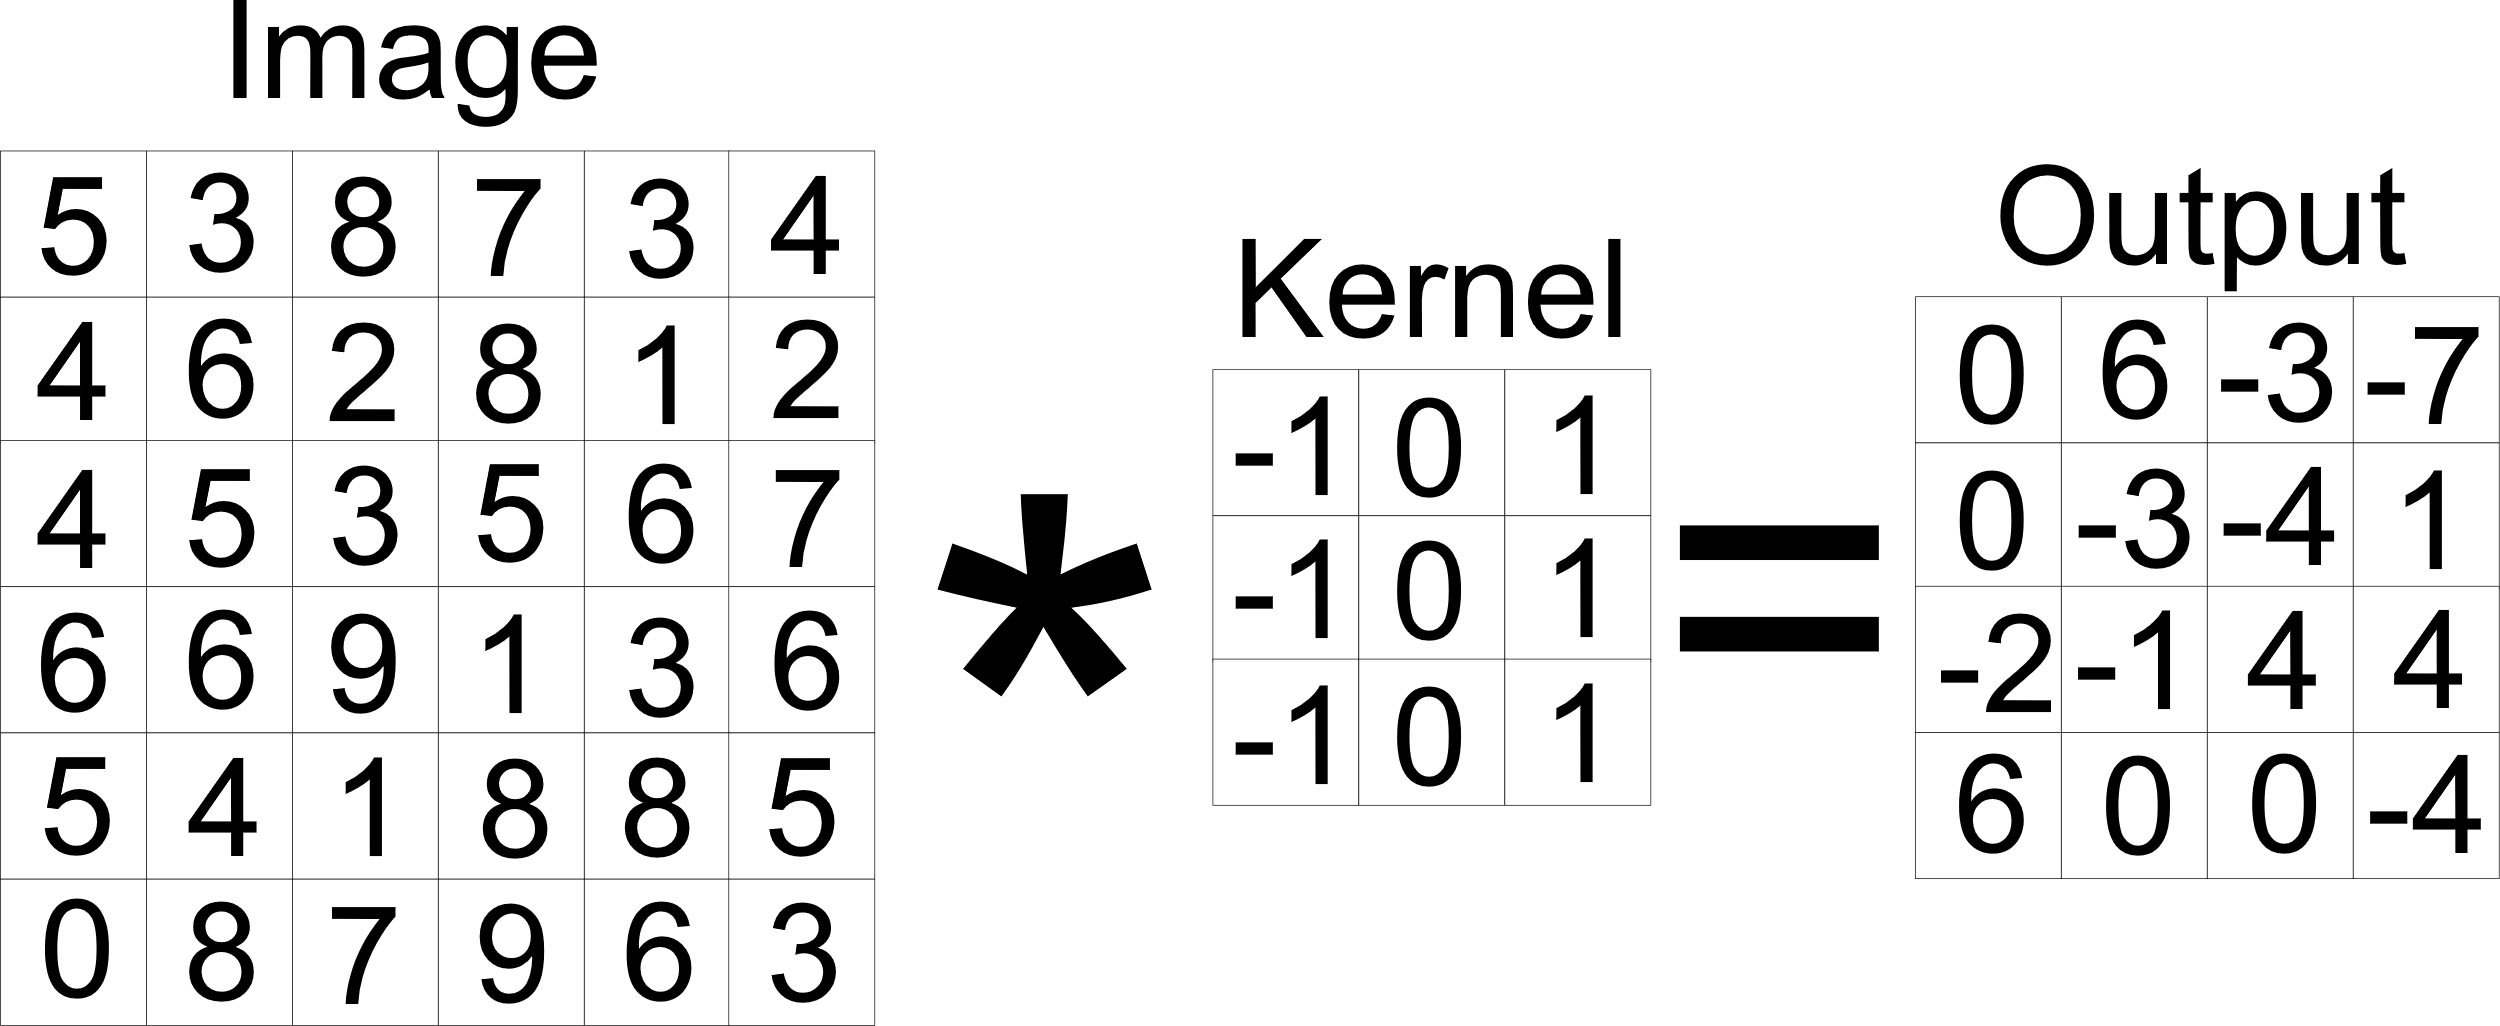
Example of the ReLU activation function.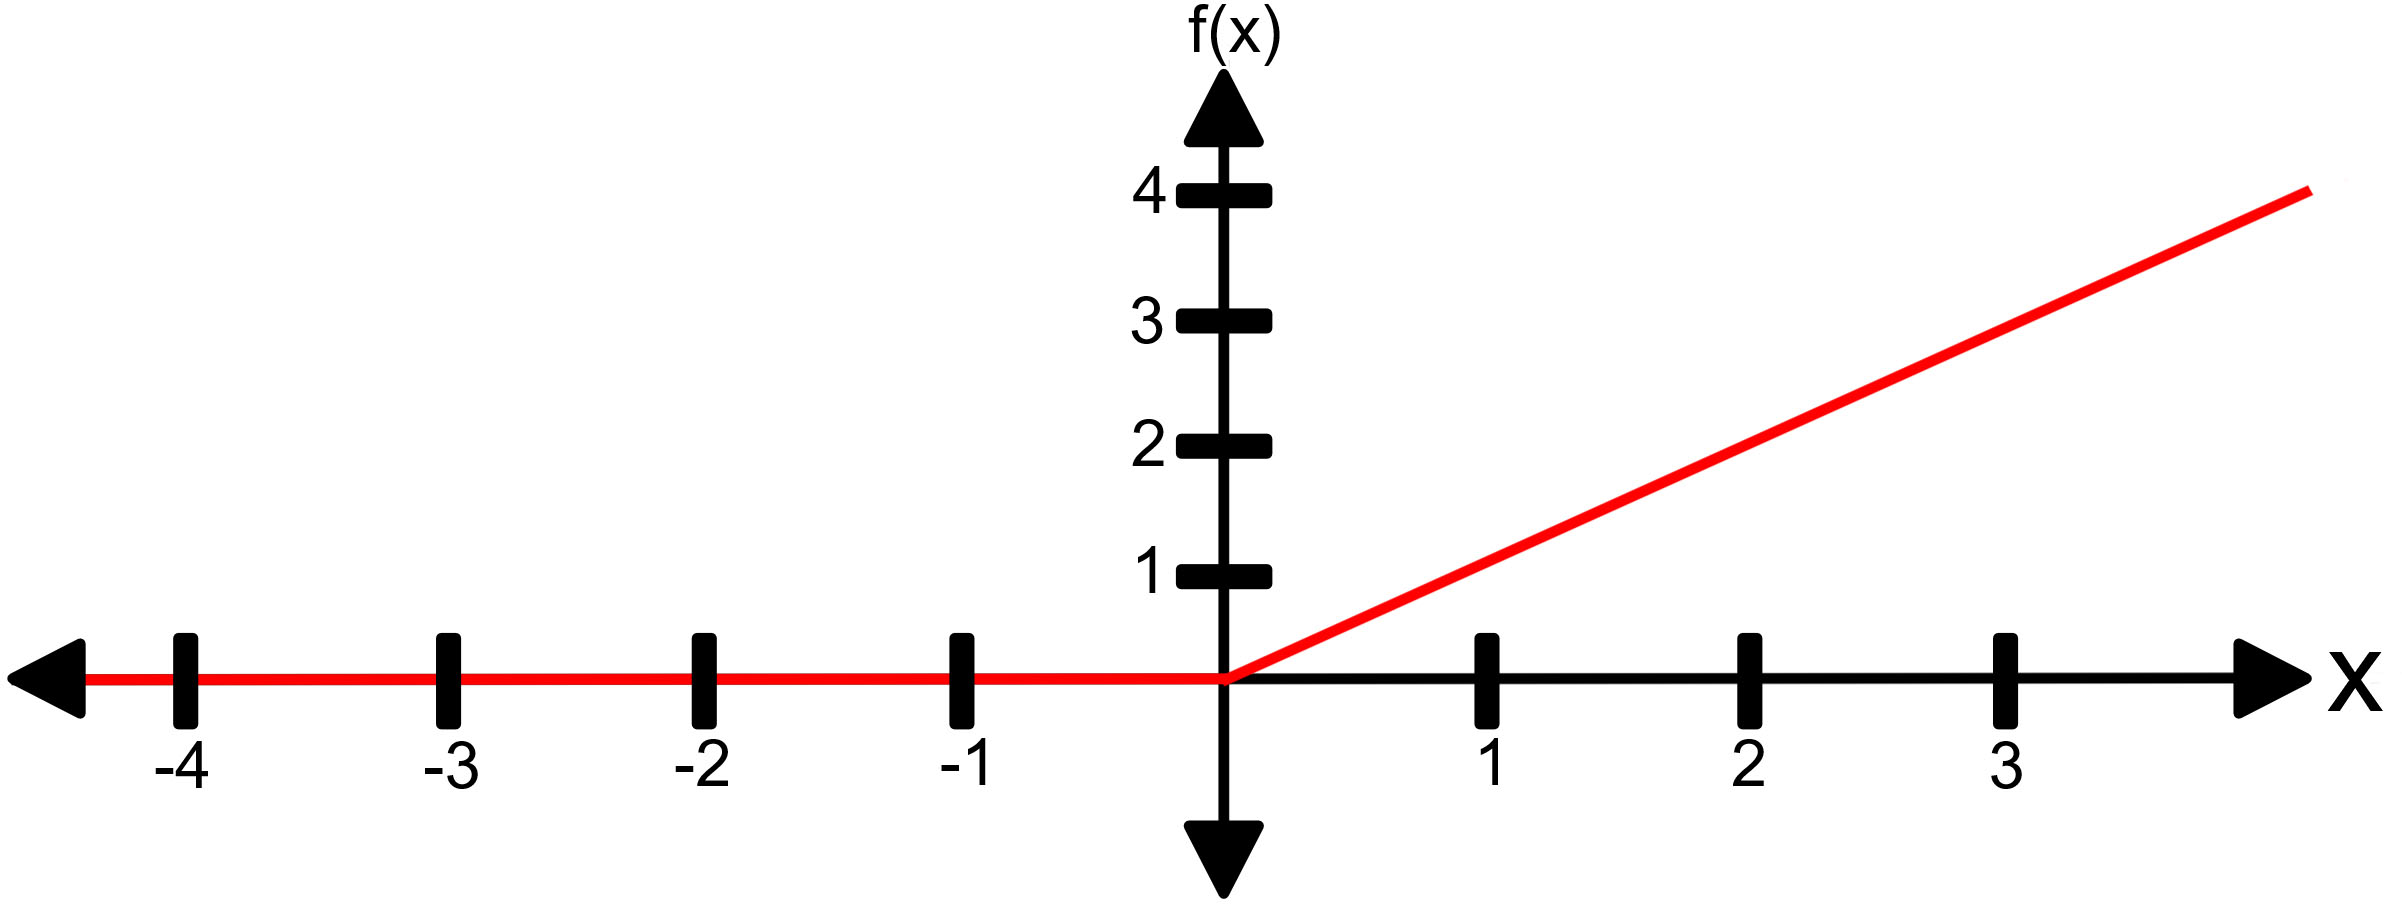
The first layer used in CNNs after the input layer is the convolutional layer. This function uses a kernel for lines and borders detection; the more you use, the more complex shapes it recognizes [24]. The kernel will go through all the neurons obtaining a new matrix. An example of this layer can be observed in Fig. 3.
Rectified linear unit function (ReLU)
As previously mentioned, after the convolution layer is needed an activation function, and one that has offer good results using CNNs is the ReLU function [25]. This function avoids negative numbers converting them in zeros and allow equal positive numbers. An example of this function can be seen in Fig. 4.
MaxPooling layer
Just like the convolutional layer, MaxPooling layer uses a kernel, but in this layer the kernel is used to find the maximum values in the matrix, that means, extract the best characteristic of the same area of the kernel [26]. This function reduces computational load because converts the original matrix in a smaller one. An example of this function can be observed in Fig. 5.
Example of the MaxPooling function.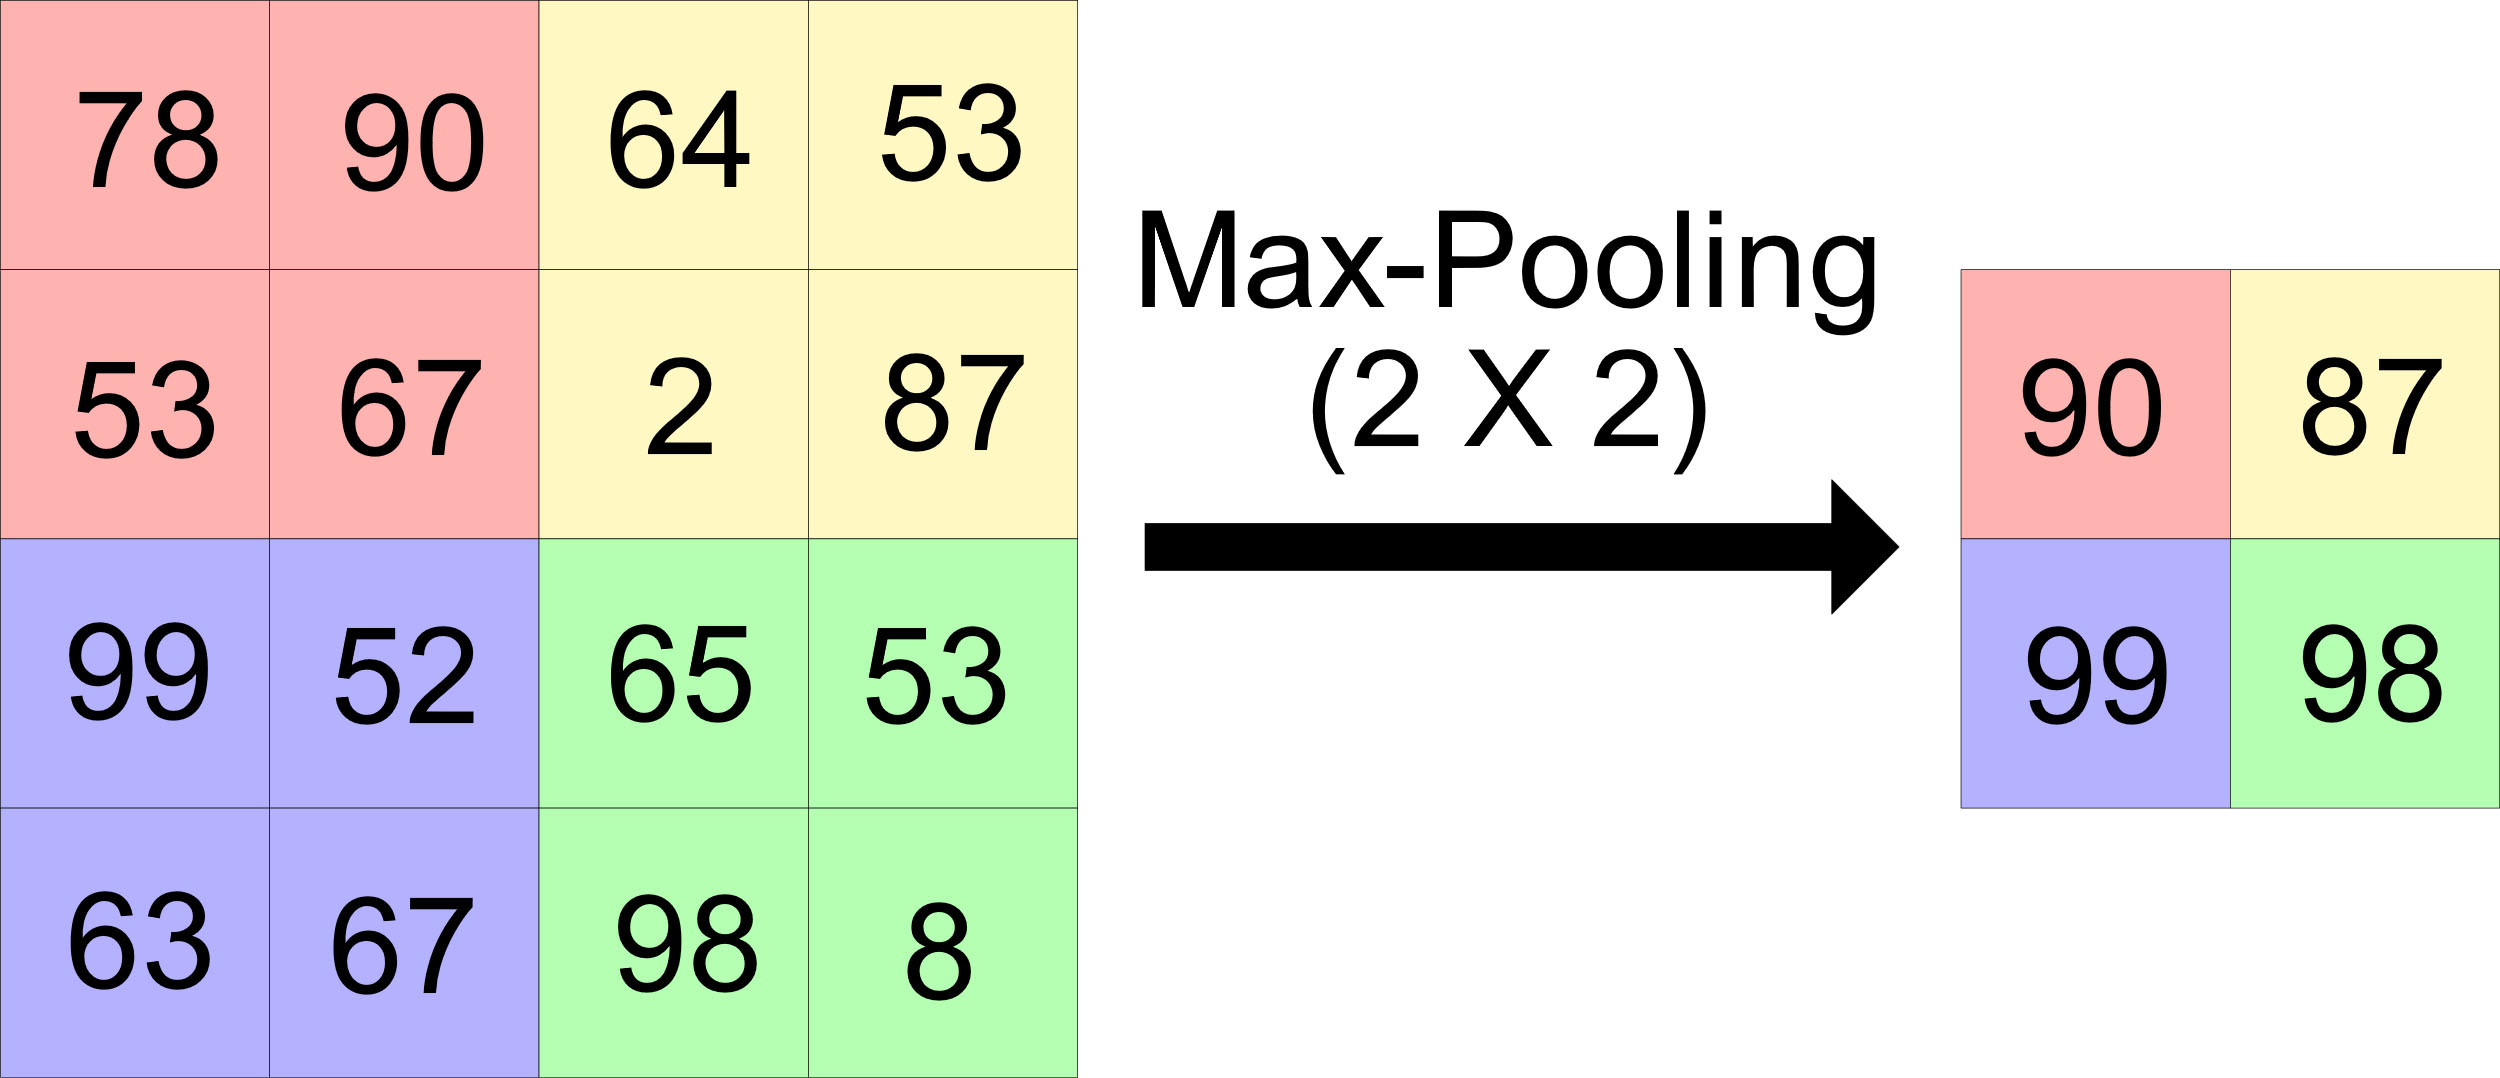
Many authors have been discussed about evolution theories for many years [27], and one of the most studied is the Darwin evolution theory. Genetic algorithms (GA) are based in how the theory of Darwin works: initial population, obtain the fitness of each one, selection of the population, crossover, and mutation [28].
Simple genetic algorithms have different extensions, and the one used in this work are the hierarchical genetic algorithms (HGA) used for hierarchical problems. Unlike simple GA, HGA used two types on genes: control and parametric [29]. It is usually represented as a tree where the control genes are the higher levels and control the parametric genes in lower levels. An example of HGA can be observed on Fig. 6.
Example of HGA.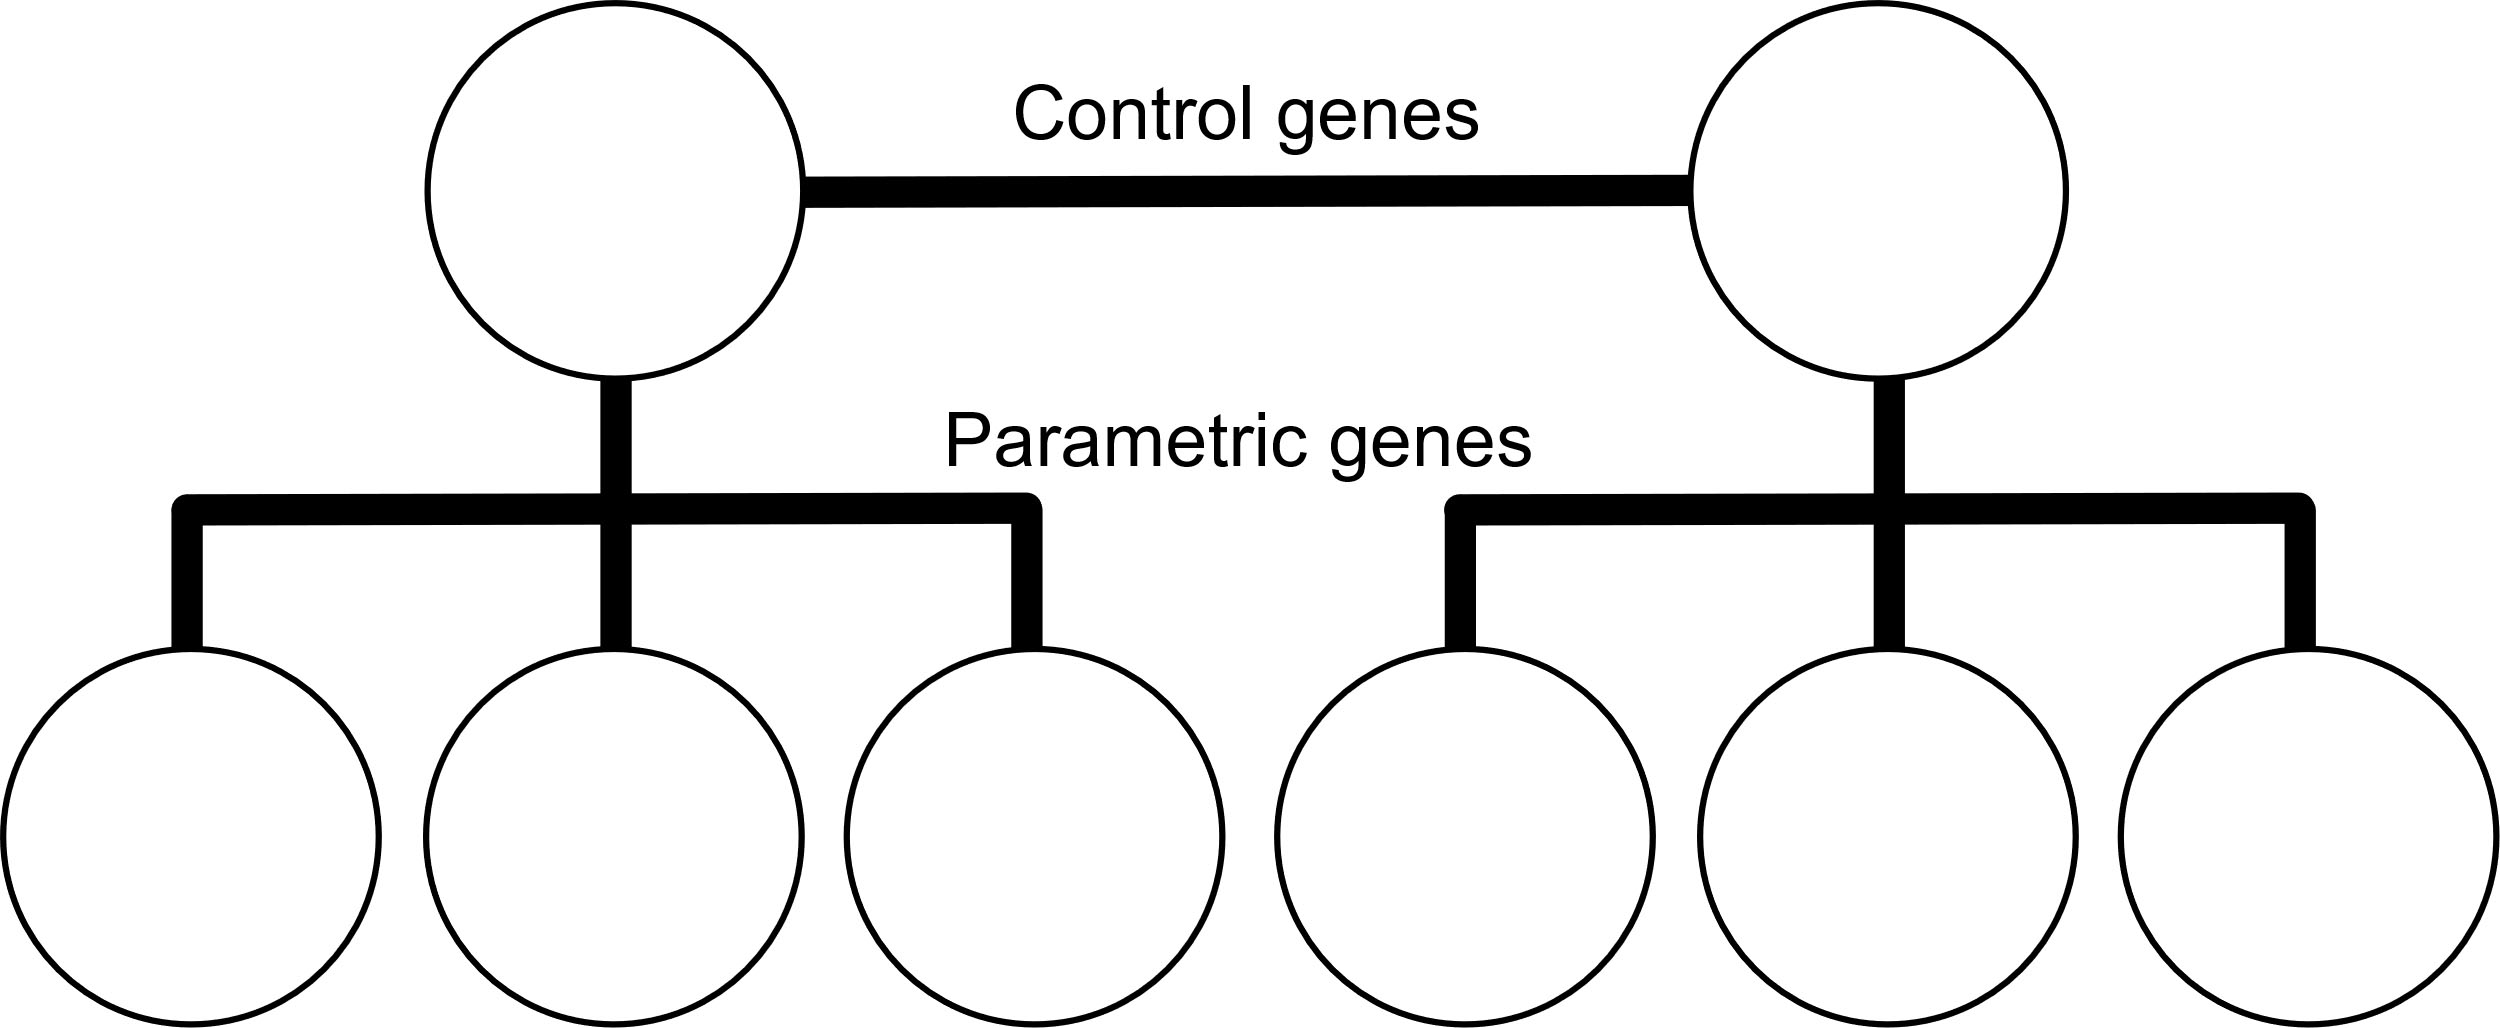
The two CNN architectures used in this work.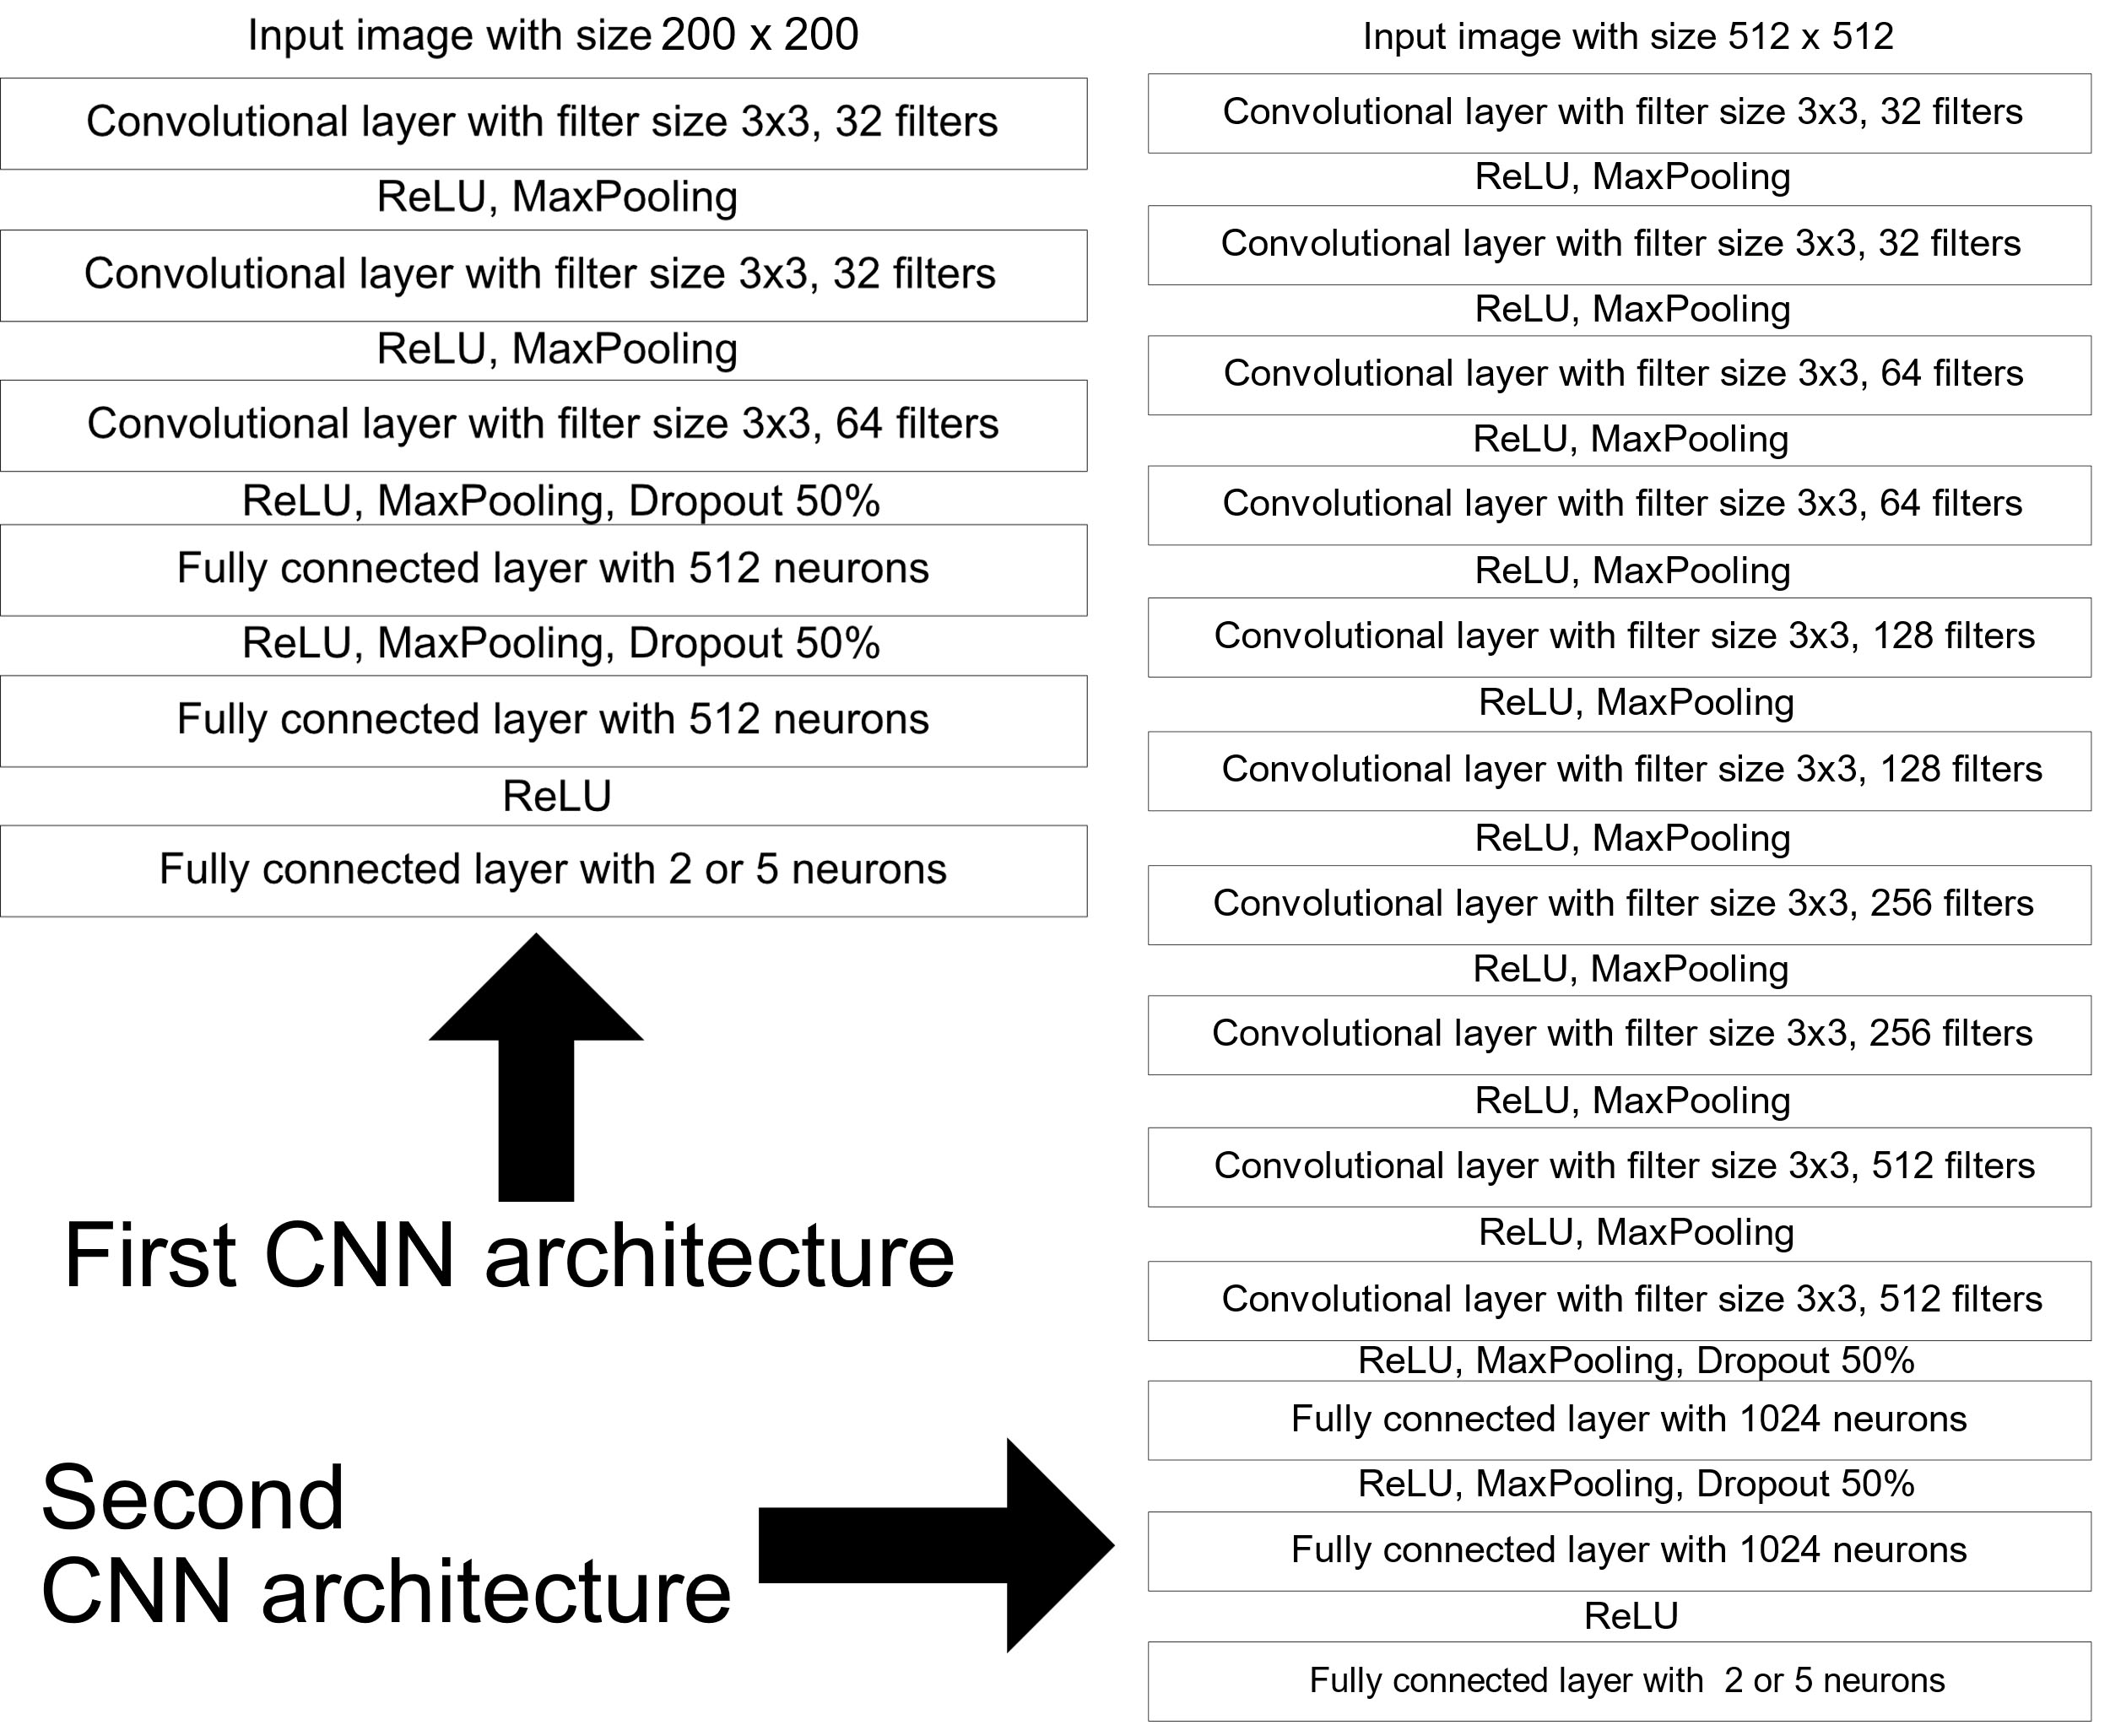
In this section, the information about the developed methods is presented. Starting with the CNN models for the pre-processing methods experiments. Then ex-plaining the APTOS 2019 database and the pre-processing methods applied to it. Finally, the structure of the HGA and the meaning of the value of each gen.
Convolutional neural networks models
Two difference CNN architecture were designed to train each one with the four pre-processing methods in two study cases. The main difference between the two CNN models is number of convolutional layers. The first model has 3 convolutional layers with input an image size of 200x200. The second model is similar with 10 convolutional layers with input an image size of 512x512.
Both models have two hidden layers after the convolution layers and an output layer of 2 or 5 neurons. The number of neurons in the output layer depends on the case study (2 neurons for binary study case and 5 for multi-class study case). Also, the activation function of the output layer depends on the study case, being Sigmoid function if it is the binary study case or the SoftMax if it is the multi-class study case. The complete CNN architectures can be observed in Fig. 7.
APTOS 2019 database
This database contains 3662 tagged images for the training and validation of the CNN for detection and classification of DR [30]. In the Table 1 are observed how many images have each stage of DR and in Table 2 the number of images for healthy retina and retina images with DR. Distribution images of Table 2 is used for the binary study case, while the distribution images of the Table 1 are used for the multi-class study case.
Number of stage images in APTOS 2019
Number of stage images in APTOS 2019
Number of healthy images and DR images in APTOS 2019
Four different pre-processing methods were implemented using the APTOS 2019 database with the intention of compare them using the two models of CNN.
Examples of the first pre-processing.
Examples of the second pre-processing.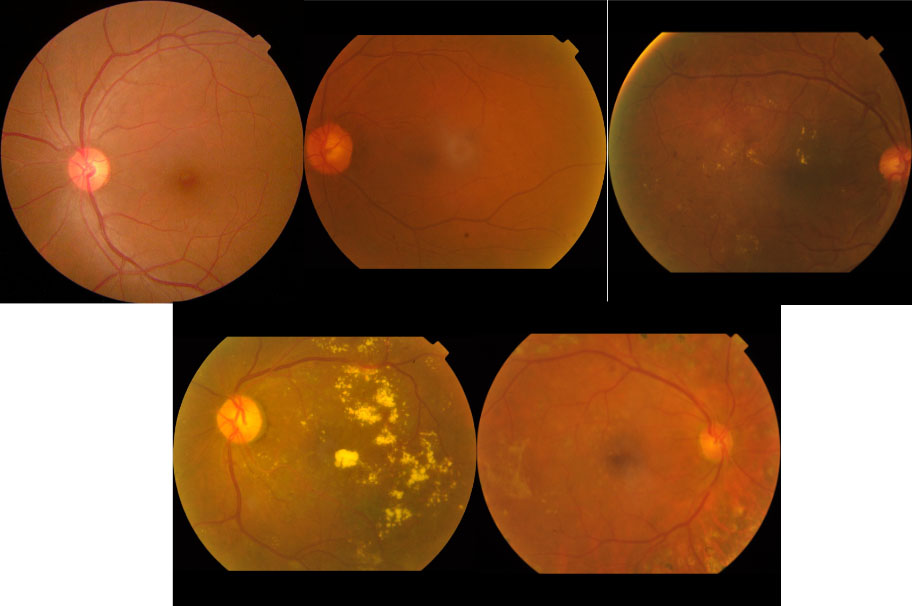
This pre-processing is also used in the next pre-processing methods, that means that this is the most important pre-processing and one of the most used by other authors. This method consists in delete the dark pixels of the background and extract the retina from the image. To do this, is necessary to convert the original images from RGB (it is an image that has three color channels: red, blue, and green) to grayscale. With a grayscale image is possible to convert the image to a binary image. To convert the grayscale image to a binary, each pixel of the image is selected. If the value of the individual pixel is less than 20, that means the new value of the pixel will be 0, otherwise, the value will be 1. With the new binary image, the next step is search and find the retina, with the binary image is easy to find it because is just needed the bigger shape. After find the retina, the position of it is extracted, and then it is used to extract the retina of the original images. The examples of the resulting images can be seen in Fig. 8.
Second pre-processing
This pre-processing method looks similar with the previous one. The resulting images of first pre-processing method have the necessary information to start training CNN models, but the CNN models in this work have same size for width and height for its input image. That means that the images in the training process will be deformed.
To solve this, the second pre-processing method consist in extract the width and height of the resulting images of pre-processing 1 method, and then add black pixels when is necessary to finally obtain an image with the same size of width and height. The examples of the resulting images can be seen in Fig. 9.
Third pre-processing
After applied the first pre-processing method, is needed to extract the color channel of the images. In this work the color space RGB is used, so after extraction the result will be three images, one for each channel. Then a histogram equalization is applied to each one, and finally merge the three images to have again only one retina image. Examples of the resulting images can be seen in Fig. 10.
Examples of the third pre-processing.
Examples of the fourth pre-processing.
This is the last pre-processing method and was made before by other authors. It is very similar to the third pre-processing method with the difference that only is used the green channel of the retina image. First, we extract the green channel of the image retina, and then apply a histogram equalization. That resulting retina image will be in grayscale. Examples of the resulting images can be seen in Fig. 11.
Fourth pre-processing
In Section 3 is mentioned that hierarchical genetic algorithms have control and parametric genes. Genes for control and parametric have different purpose and is necessary to understand what control and parametric genes do.
Representation of the control genes.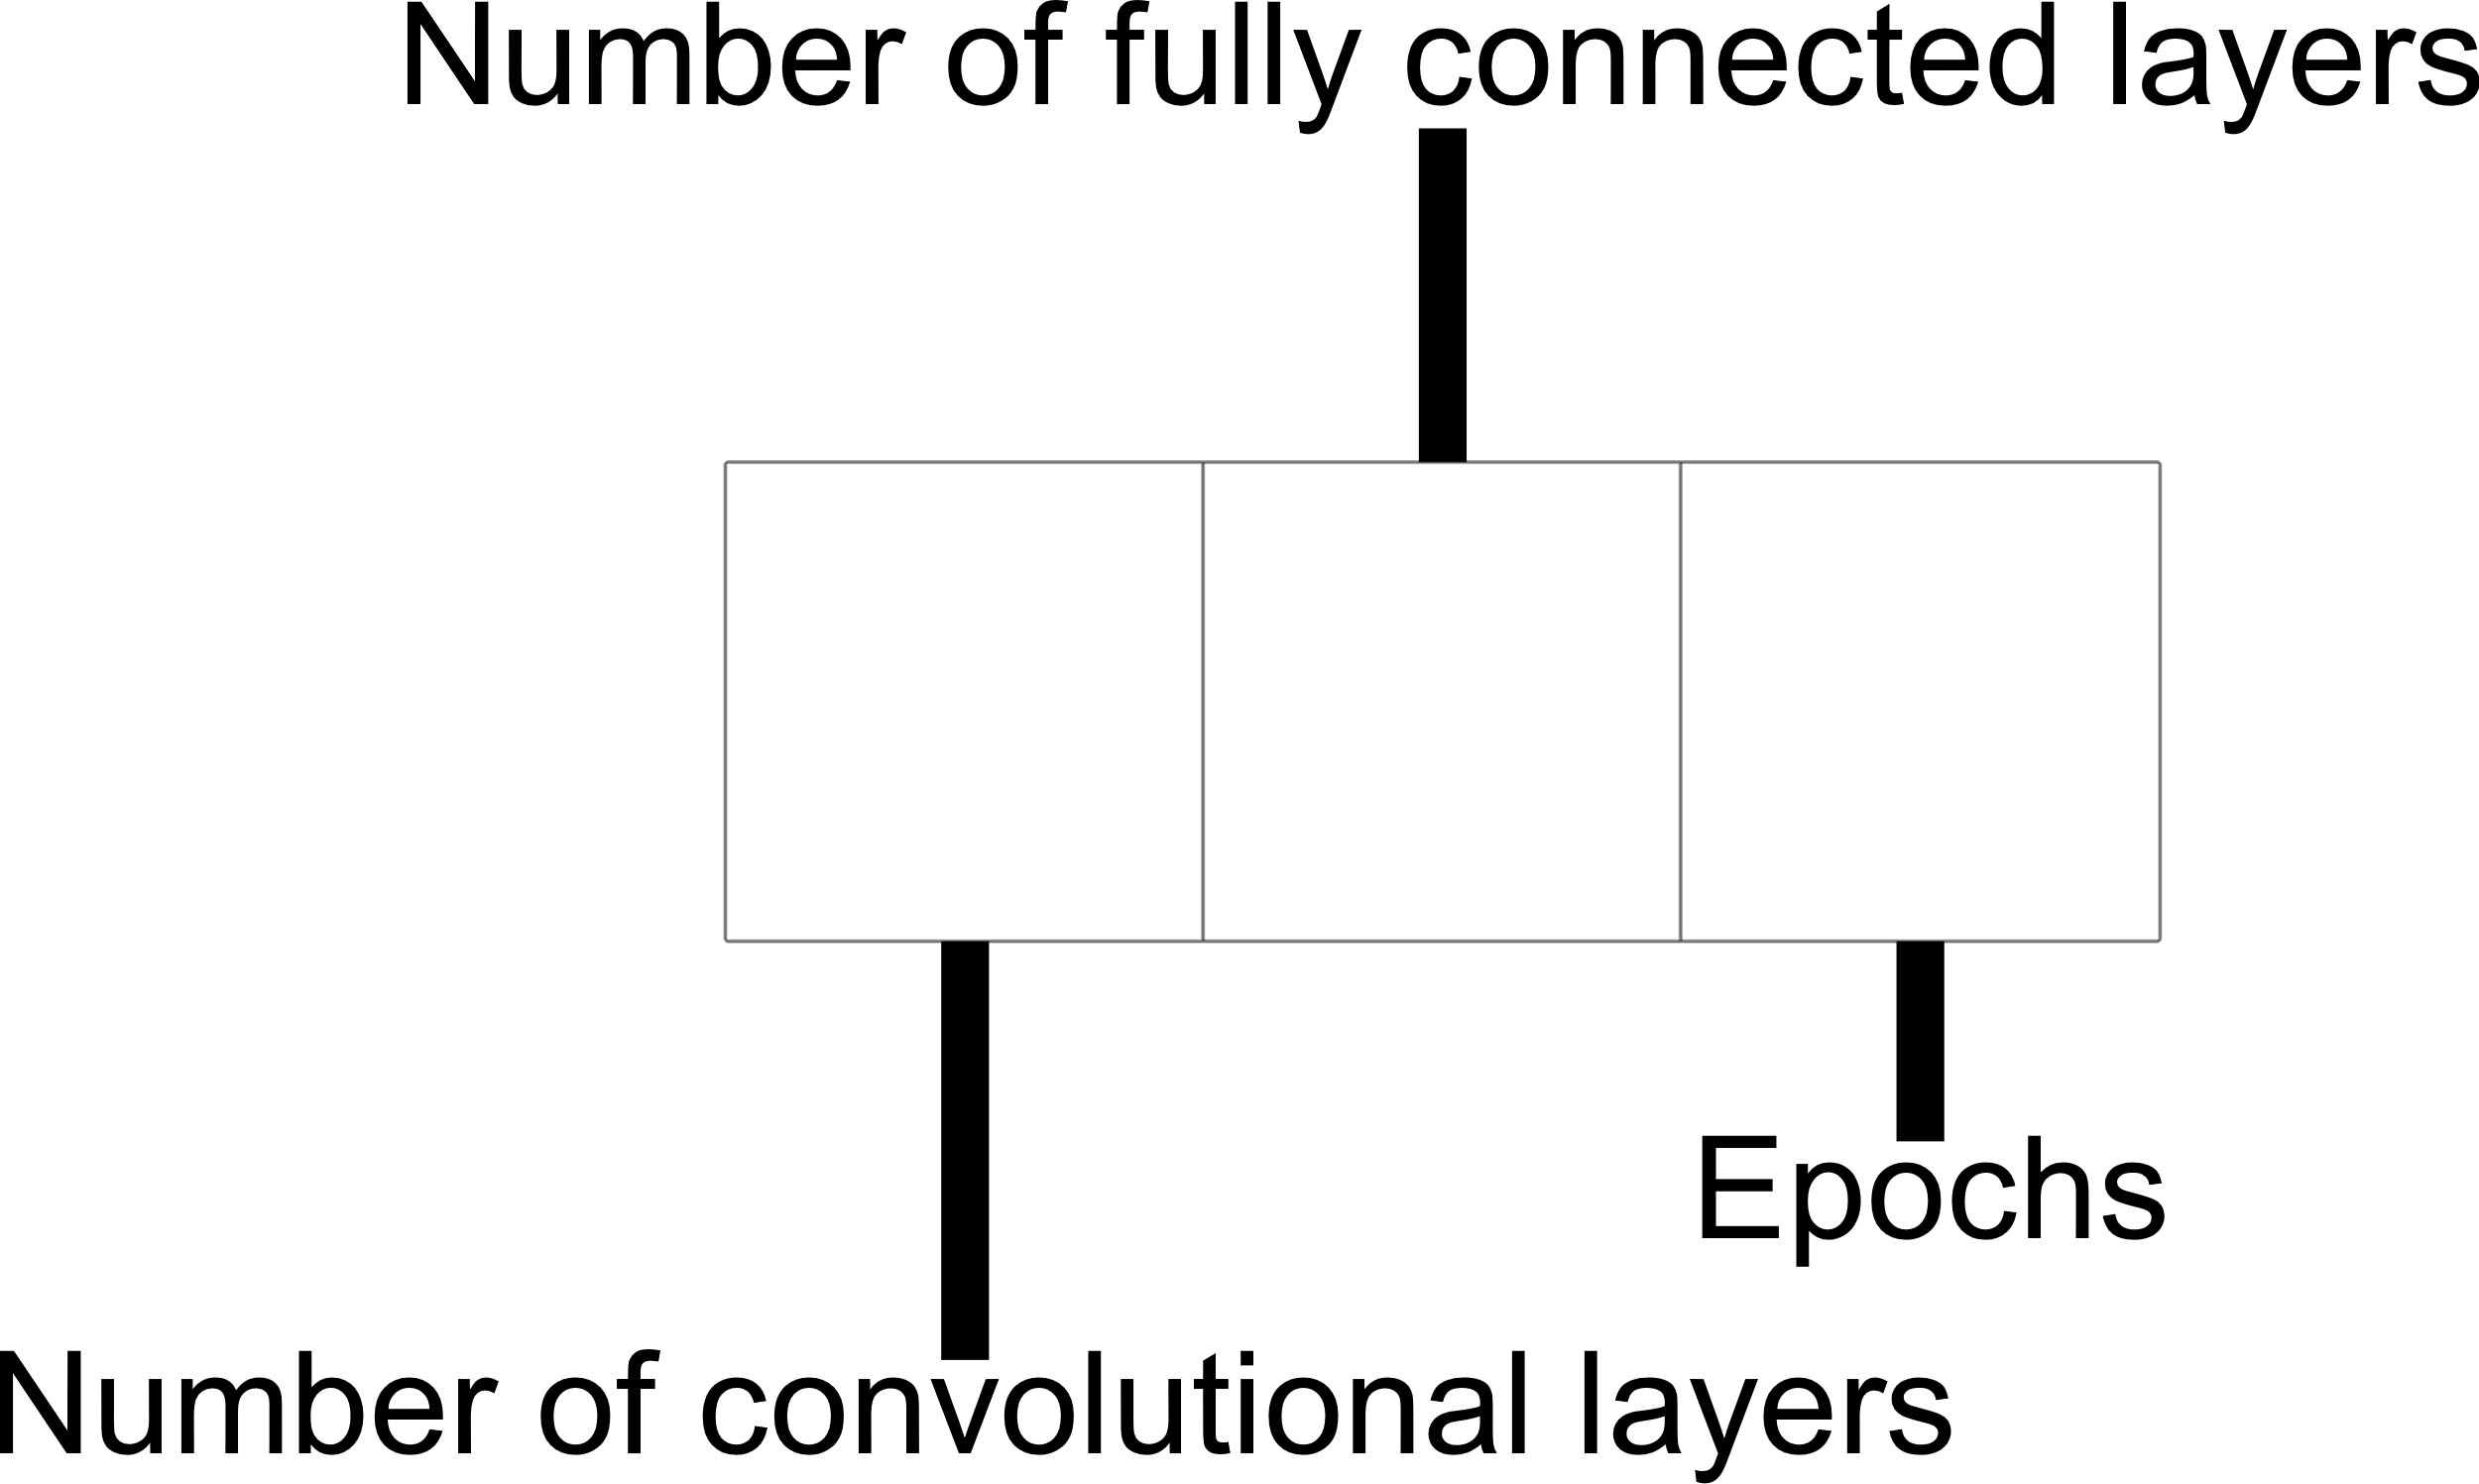
The first gen of the control genes has an integer value and decides how many convolutional layers will use the CNN model; the values are between 3 and 6, inclusive. The second gen has an integer value that specify how many fully connected layers will create after the convolutional layers. This gen does not include the output layer. The third and last control gen has an integer value between 10 and 100 and can be divided by 10 and represents the number of epochs. A graphic representation of the complete control chromosome fragment can be observed on Fig. 12.
Representation of the parametric genes for convolutional layers.
The first control gen will decide how many convolutional layers will have the CNN model, and all parametric genes will affect the hyperparameters of the convolutional layers created by control genes. This first gen has an integer value of 1, 2 or 3 and means which layers will have the convolutional layer after it. If the value is 1, the convolutional layer will have just the activation function ReLU. If the value is 2, ReLU function is added and a MaxPooling layer with a stride of 2 for a kernel of 2x2. If the value is 3, ReLU function and MaxPooling layer are added and a Dropout probability.
The second parametric gen has an integer value of 3, 4 or 5 and means the size of width and height for the size of the filter of the convolutional layer. The third gen also has an integer value, and it means how many filters will have the convolutional layer. The minimum and maximum value of this gen will depend on the position of the convolution layer. If the position is 1 or 2, minimum and maximum will be 16 and 32, inclusive. If the position is 3 or 4, minimum and maximum will be 64 and 128, inclusive. Finally, if the position is 5, minimum and maximum will be 256 and 512, inclusive.
The last parametric gen for convolutional layers has an integer value between 10 and 50, inclusive and must be divided by 10. Dropout layer needs a value between 0 and 1, so, before inserting this value in the CNN model, it will be di-vided by 100. A graphic representation of the complete parametric chromosome fragment for convolutional layers can be observed on Fig. 13.
Parametric genes for convolutional layers
The second control gen will decide how many fully connected layers will have the CNN model, and all parametric genes will affect the hyperparameters of the fully connected layers created by control genes. This first gen has an integer value of 1 or 2 and means which layers will have the fully connected layer after it. If the value is 1, the fully connected layer will have just the activation function ReLU. If the value is 2, ReLU function is added and a Dropout probability.
The second parametric gen has an integer value, and it means how many neurons will have the fully connected layer. The minimum and maximum value of this gen will depend on the position of the fully connected layer. If the position is 1 or 2, minimum and maximum will be 64 and 128, inclusive. If the position is 3 or 4, minimum and maximum will be 128 and 256, inclusive.
The last parametric gen for fully connected layers has an integer value be-tween 10 and 50, inclusive and must be divided by 10. Dropout layer needs a value between 0 and 1, so, before inserting this value in the CNN model, it will be divided by 100. A graphic representation of the complete parametric chromo-some fragment for fully connected layers can be observed on Fig. 14.
Representation of the parametric genes for convolutional layers.
Distribution of APTOS 2019 database
Results of the binary study case
Results of the multi-class study case
The first experimental results were about the pre-processing methods. Two study cases were considered: binary and multi-class cases. In both cases were used the CNN models showed in Section 4. For binary case were carried out 8 experiments and for multi-class also 8 experiments: using the 4 pre-processing methods with the two CNN models.
Each experiment for pre-processing methods was executed 30 times to obtain mean and standard deviation to do a statistical test and prove which pre-processing method offer better results. The minimum and maximum values were considered too. The optimizer used in each experiment was the Adaptive Moment Estimation (Adam). For all experiments, APTOS 2019 database was distributed as seen in Table 3. For hierarchical genetic algorithm experimentation were used the same properties.
Binary case for pre-processing experimentation
Eight experiments were realized for this study case as it was mentioned in Section 4. In Table 4 can be observed the best 4 experiments: 2 using the CNN models with 3 convolutional layers and 2 using the CNN model with 10 convolutional layers.
According with the results of the Table 4, the highest mean accuracy is in experiment #2 using the CNN model with 3 convolutional layers and the pre-processing method 2. The maximum value was obtained by experiment #3 using the CNN models with 10 convolutional layers and the pre-processing method 3.
Multi-class case for pre-processing experimentation
As same as binary study case, 8 experiments were realized for multi-class study case as it was mentioned in Section 4. In Table 5 can be observed the best 4 experiments: 2 using the CNN models with 3 convolutional layers and 2 using the CNN model with 10 convolutional layers.
According with the results of the Table 5, the highest mean accuracy is in experiment #6 using the CNN model with 3 convolutional layers and the pre-processing method 2. The maximum value was obtained by experiment #6 and #8 using the CNN models with 3 and 10 convolutional layers respectively, and the pre-processing method 2.
Comparison of pre-processing experimentation result
To have a better understanding of the data in the tables, different statistical tests were carried out to determine which pre-processing offers better results. According by the work [31], experiments using the CNN model with three convolutional layers offered best results than the experiments that used the CNN model with ten convolutional layers. So, for the statistical test only the two best experiments using the CNN with three convolutional layers were used.
Hypothesis testing for binary case in pre-processing experimentation
According to the results in Table 4, the hypothesis testing will be between the experiment #1 and #2. The second experiment got a higher mean accuracy, so, our statement is that the pre-processing method 2 offers a bigger mean accuracy than the offered by pre-processing method 1 for binary study case.
To reject the null hypothesis, the critical value must be less than
Hypothesis testing for binary study class for pre-processing experimentation.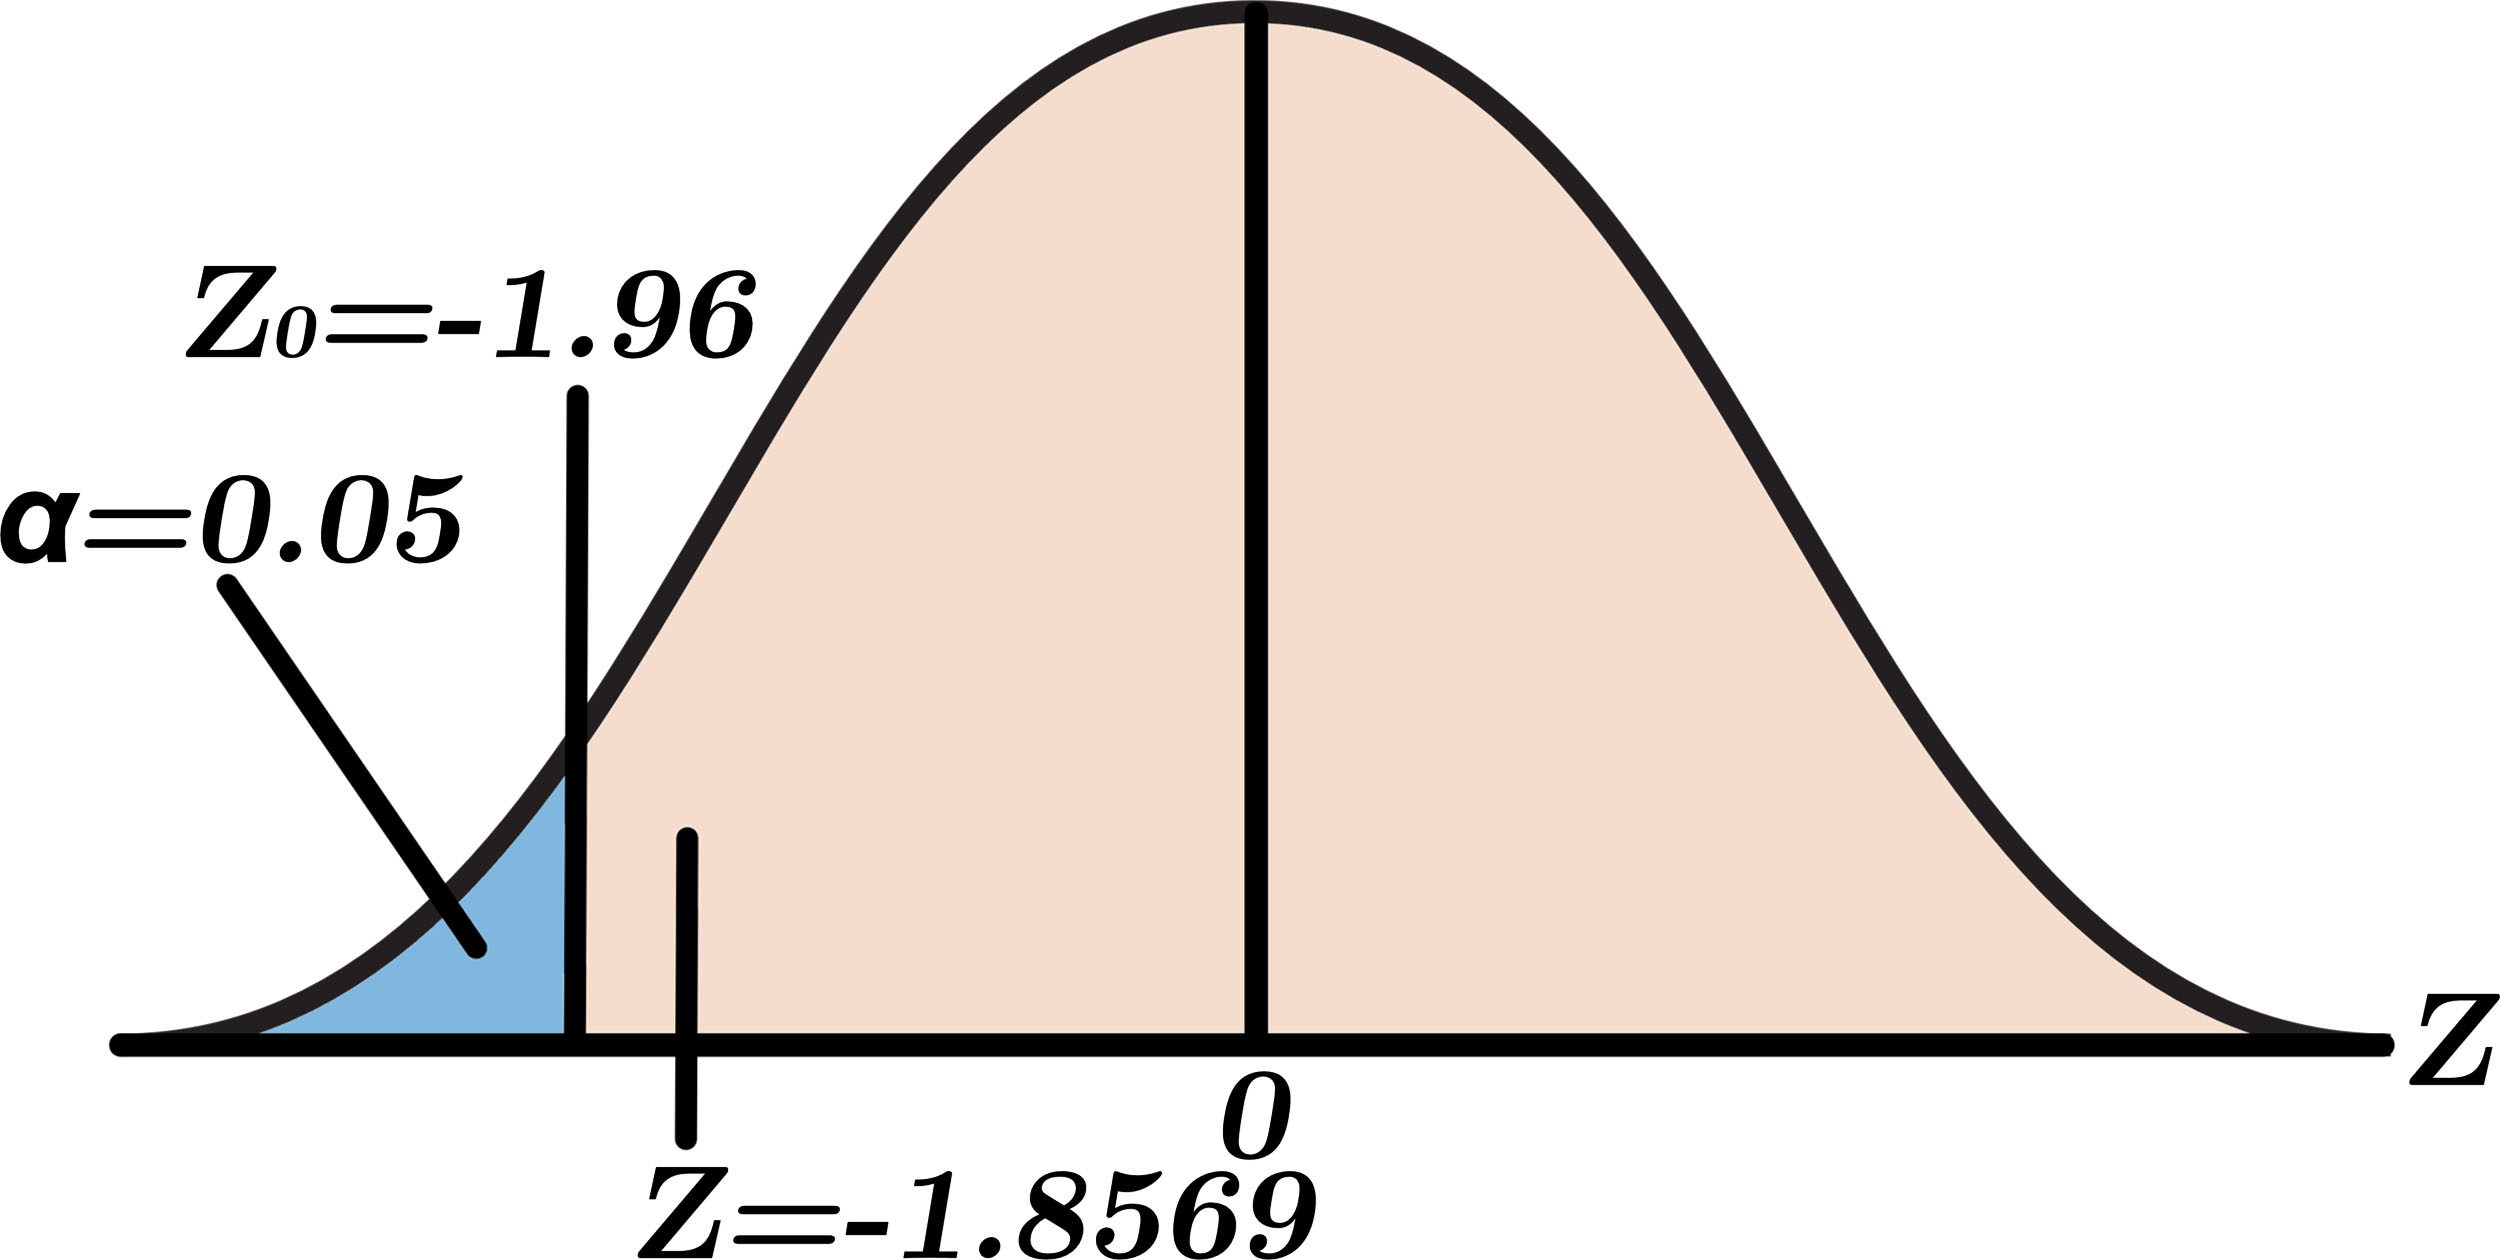
According to the results in Table 4, the hypothesis testing will be between the experiment #1 and #2. The second experiment got a higher mean accuracy, so, our statement is similar to binary study case: the pre-processing method 2 offers a bigger mean accuracy than the offered by pre-processing method 1 for binary study case.
To reject the null hypothesis, the critical value must be less than
Hypothesis testing for multi-class study class for pre-processing experimentation.
For the HGA experimentation is used the pre-processing method 2. The experiment consisted in execute the hierarchical genetic algorithm 30 times with an initial population of 10 individuals, 10 generations, 80% for selection probability, 50% for crossover probability and 80% for mutation probability. The best children replace the worst fathers. The binary crossover was used for this experiment and for mutation, it was implemented by taking a random row of each parametric gen and changing its value in the same way as detailed in previous section. The fitness for each chromosome was the accuracy obtained for the CNN model using the testing images. In Table 6 can be seen the five better fitness obtained by the hierarchical genetic algorithm.
Best five results obtained by the HGA for binary study case
Best five results obtained by the HGA for binary study case
According with the results, the higher fitness was obtained in the experiment #8 with an accuracy of 0.9781 using 100 epochs. The mean accuracy obtained by the experiments was 0.9650 with a standard deviation of 0.007665.
The same parameters for the hierarchical genetic algorithm were used in this study case. In Table 7 can be seen the results obtained by the hierarchical genetic algorithm.
Results obtained by the HGA for multi-class study case
Results obtained by the HGA for multi-class study case
According with the results, the higher fitness was obtained in the experiment #12 with an accuracy of 0.7762 using 90 epochs. The mean accuracy obtained by the experiments was 0.7596 with a standard deviation of 0.009948. The CNN architectures for binary and multiclass study cases can be observed on Fig. 17.
Comparison results for binary study case
Comparison results for multi-class study case
Best architectures of the CNN models for a) binary and b) multiclass study cases.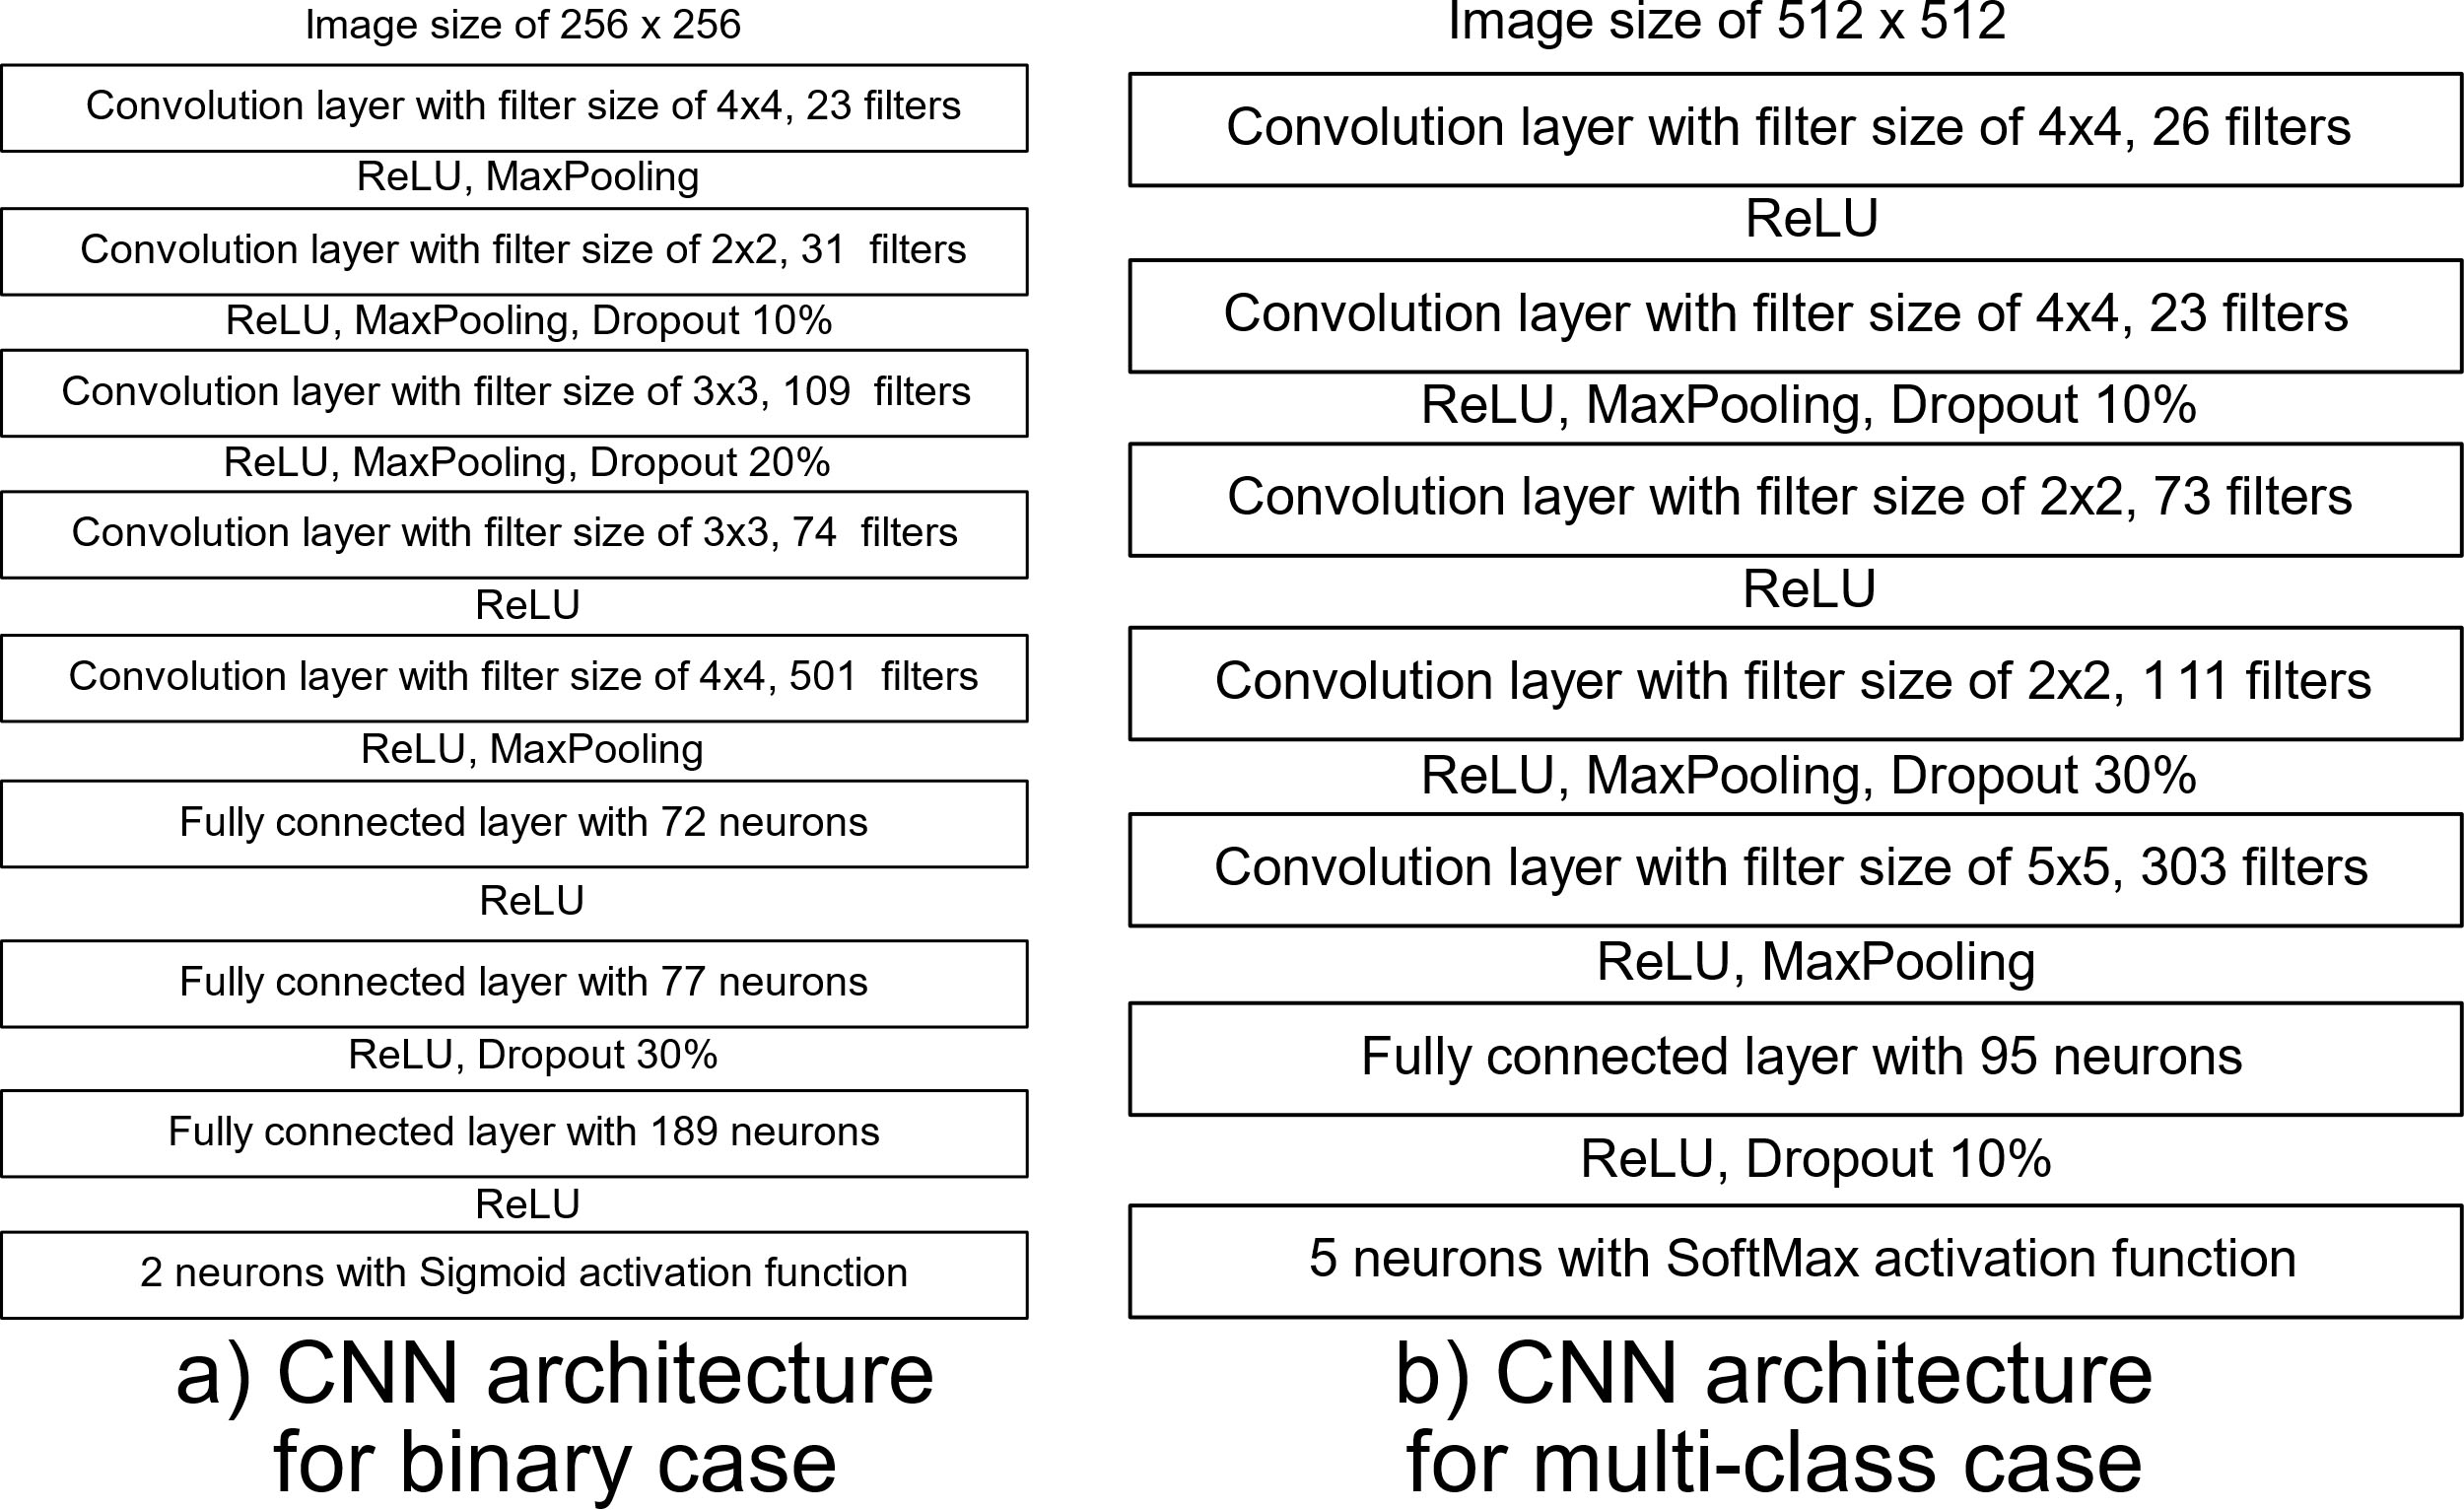
Before presenting the conclusions, the best accuracies for binary study case can be observed in Table 8. In Table 9 can be observed the accuracies for multi-class study case. Accuracies for related work, pre-processing methods experimentation and hierarchical genetic algorithms experimentation and this work are presented.
According with the Tables 8 and 9, there is not a possible way to do a statistical test because other authors did not provide mean accuracy nor standard deviation. So, the hypothesis testing below are only between pre-processing experimentation and HGA experimentation.
Hypothesis testing for binary case
According to the results in Table 8, the hypothesis testing will be between the work “Pre-processing experiment #2” and “HGA experimentation”. The HGA binary experimentation got a higher mean accuracy, so, our statement is that the HGA binary experimentation offers a bigger mean accuracy than the offered by Pre-processing experiment #2.
To reject the null hypothesis, the critical value must be less than
Rejection region for hypothesis testing of binary case.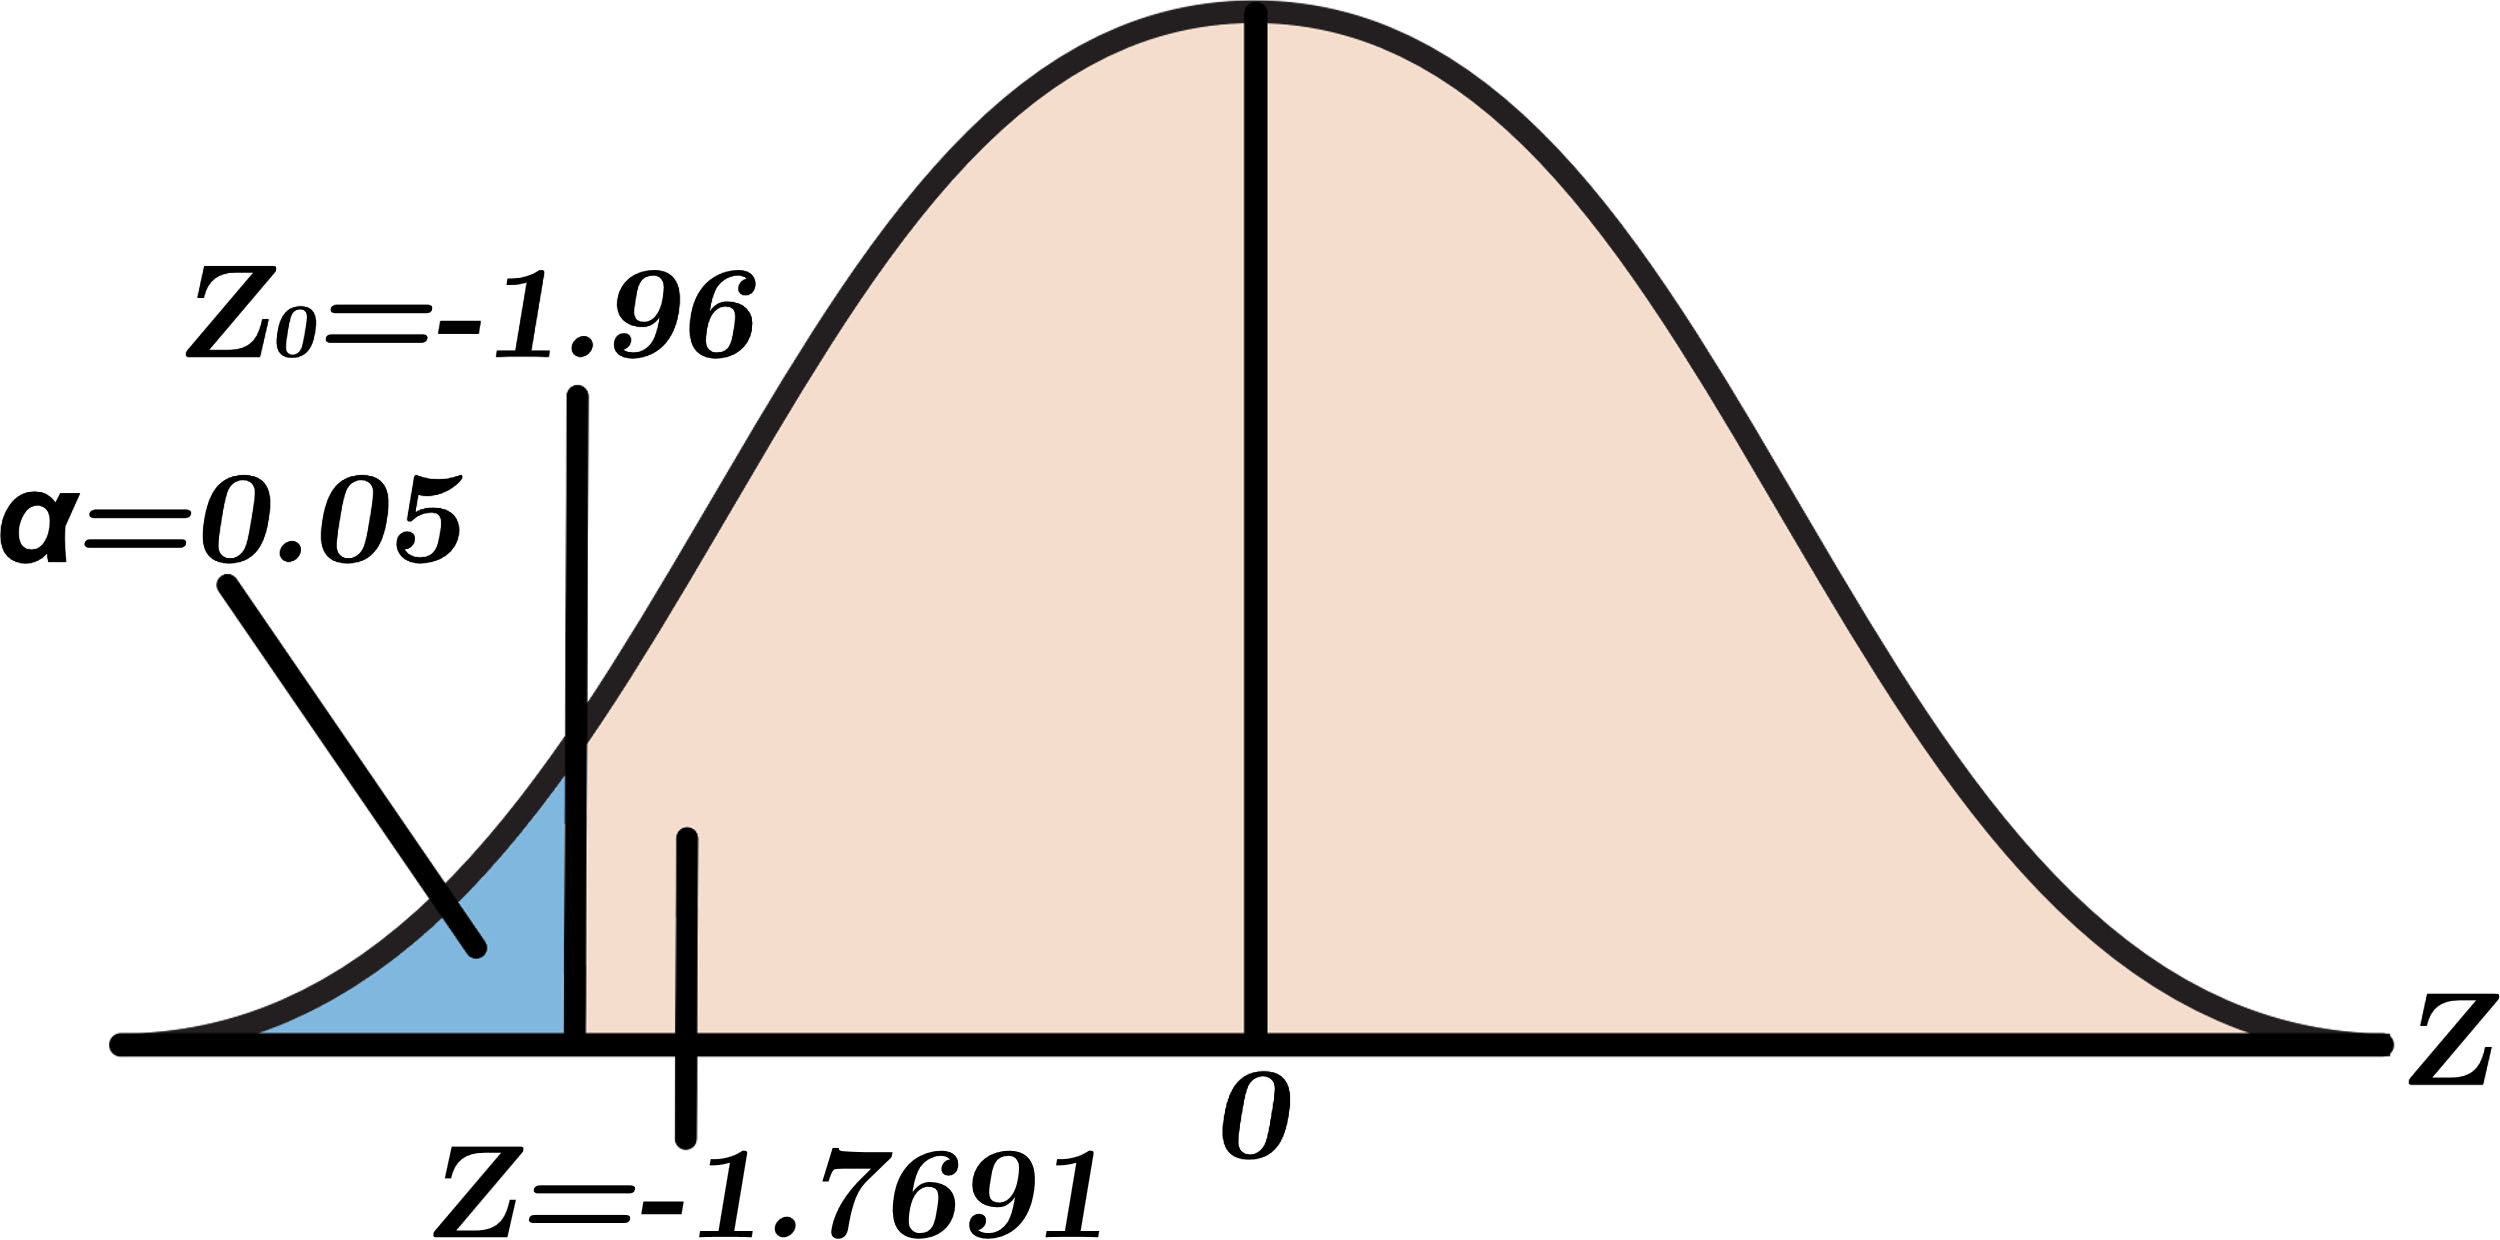
According to the results in Table 9, the hypothesis testing will be between the work “Pre-processing experiment #6” and “HGA multi-class experimentation”. The HGA multi-class experimentation got a higher mean accuracy, so, our statement is that the HGA multi-class experimentation offers a bigger mean accuracy than the offered by Pre-processing experiment #6.
To reject the null hypothesis, the critical value must be less than
Rejection region for hypothesis testing of multi-class case.
In this work four different pre-processing methods were presented and applied to the same images: APTOS 2019 database. After that, two different CNN models were developed and a comparison between them was made. Each CNN model had different number of convolutional layers. Then, two study cases were prepared: binary and multi-class. The CNN models with less convolutional layers offered better results than the other one with more convolutional layers. Also, the CNN model with higher accuracies was using the second pre-processing method, and it was used for the rest of the work.
The next step was to develop the HGA and improve the results obtained by the experiments of the pre-processing methods. The same HGA were used for the binary and multi-class study case. In the experiments, two CNN architectures were obtained with better results in the multi-class study case than the pre-processing methods experimentation for same study case, proved by its respective hypothesis testing.
As future work, the number of the pre-processing methods could be increased or changed. For example, the fifth pre-processing could be a combination of the pre-processing methods #2 and #4. The pre-processing method #2 were used along all the HGA experimentation, and an improvement of that method could increase even more the accuracy obtained.
Also, the HGA could be improved increasing the number of hyperparameters. There are many hyperparameters to use, like the size of the kernel for the Max-Pooling layer or more activation functions after the convolutional layer. HGA has its limits, so, change the optimizer algorithm could improve the complete CNN architecture.
Finally, APTOS 2019 is a good database for detection of DR, but it is not the biggest one. So, using a bigger database could help for detection and classification of this disease. With the results obtained was proved that the use of CNN models is a robust deep learning method that can detect complicated diseases that require an expert physician.